

TL;DR:
- Weaver enables you to treat telemetry (metrics, spans, logs) as a schema: define a registry of signals + attributes, validate it, generate docs and code, and enforce it across services.
- It supports commands like
weaver registry check,weaver registry diff,weaver registry live-check, so mismatches (wrong types, missing attributes, naming conflicts) can be caught early — in CI or runtime. - Weaver lets you extend the official semantic conventions with custom registries for your application domain, and triggers generation of constants/helper code so instrumentation mistakes (string typos, wrong attribute types) are less likely.
Introduction
Deploying a new service shouldn’t break dashboards. But it happens, usually because metric names or labels aren’t consistent across teams.
You end up with traces that don’t link, metrics that don’t align, and queries that take hours to debug, not because the system is complex, but because the telemetry is fragmented.
OTel Weaver addresses this by enforcing OpenTelemetry semantic conventions at the source. It helps teams generate consistent, structured telemetry, so observability data is easier to query, reason about, and trust.
The Real Cost of Inconsistent Telemetry
Let’s say a deploy goes out, and your alerts stop working. Nothing’s crashed; someone just renamed request_duration_ms to http_request_duration_seconds. The data’s still there. But your queries and dashboards aren’t.
This happens when teams define metrics on their terms, without a shared structure. Over time, you end up with:
- The same metric tracked under different names
- Labels like
env,environment, anddeployment_environmentmeaning the same thing - Queries that can’t be reused
- Dashboards that need constant patching
The OpenTelemetry project introduced semantic conventions to solve this. They define how common attributes, like http.request.method or db.systemshould be named and structured. The goal is consistency across services, so telemetry works the same way everywhere.
But applying these conventions manually doesn’t scale. Teams skip them, naming drifts, and the cycle repeats. OTel Weaver helps you enforce semantic conventions at the source, right in the development process, so telemetry stays consistent by default.
And, Last9’s Cardinality Explorer to identify when metrics have inconsistent labeling patterns. The root solution is standardizing your telemetry schema before the data reaches your observability system.
How OTel Weaver Works
Weaver treats telemetry as a schema you define, validate, and generate against, just like you would with API specs or database migrations. It helps ensure that what you emit stays correct, consistent, and easy to maintain across services.
Here’s how it fits into your workflow:
Validate Your Schema Before You Write Code
You start by defining a telemetry registry, a structured file that describes:
- What metrics or spans you’re emitting
- What attributes they include
- How each field is typed and whether it’s required
Before anyone writes instrumentation, you can validate this schema with:
weaver registry check -r registry-pathThis step identifies:
- Conflicting types for the same attribute (e.g., string vs number)
- Attributes marked optional when they should be required
- Metric name collisions or incompatible changes (e.g., histogram → counter)
Think of it as a linter for your telemetry model—so you catch bad definitions before they break your alerts or dashboards.
Generate Documentation That Matches Your Schema
Teams rarely write telemetry documentation, and when they do, it’s usually out of date. Weaver fixes that by turning your registry into Markdown:
weaver registry update-markdown -r registry-path --target=markdownThe generated docs include:
- Every metric, span, and attribute defined in the registry
- Clear descriptions, types, and usage examples
- Guidance on required vs optional fields
Since this comes from the registry itself, the docs are always accurate—and easy to version with the rest of your code.
Generate Type-Safe Instrumentation Code
Instead of writing string-based labels by hand, you can generate constants and helper functions:
weaver registry generate -r registry-path -t templates-root-dir goThis gives you:
- Constants like
semconv.HTTPRequestMethodinstead of raw strings - Optional builder patterns for spans or metrics
- IDE autocompletion and type checks at compile time
It reduces human error and makes correct instrumentation easier than incorrect.
Track Schema Changes Over Time
As your services evolve, your telemetry will too. Weaver makes that evolution safe and reviewable:
weaver registry diff -r current-version --baseline-registry previous-versionThis highlights:
- New or removed attributes
- Any fields that were renamed or retyped
- Breaking changes flagged clearly
You can use these diffs in code reviews or change management. It’s especially useful when multiple teams depend on shared observability standards.
Check Live Instrumentation Output
Even with a well-defined schema, actual code might miss fields or emit the wrong data. Weaver helps verify that your running application emits telemetry that matches the registry:
weaver registry live-check --registry registry-pathIt works like a runtime linter for telemetry. It checks:
- Are all required fields present?
- Are field types correct?
- Do the emitted names match the schema?
You can run this as part of CI to prevent observability regressions before merging or deploying.
Emit Realistic Sample Data
Dashboards usually get built after telemetry exists. That delays testing. With Weaver, you can emit realistic synthetic data before the app is instrumented:
weaver registry emit --registry registry-path --endpoint http://localhost:4317This generates:
- Spans and metrics with realistic value distributions
- Proper label combinations based on your schema
- Time-consistent data useful for alert testing and dashboard previews
SREs can work on dashboards and alert logic while instrumentation is still in progress.
To better understand how trace context is propagated across services, this breakdown of the Traceparent header will help you.
Domain-Specific Telemetry with Custom Registries
The official OpenTelemetry registry covers common infrastructure signals, HTTP requests, database queries, and errors, but applications often need custom metrics that reflect their specific behavior.
Weaver makes it easy to extend the standard registry with your own definitions, while keeping full support for validation, code generation, and documentation.
Step 1: Create a Registry Manifest
Start by defining your registry and importing any base dependencies, such as the OpenTelemetry semantic conventions:
name: todo_appdescription: OTel signals for our task management applicationsemconv_version: 0.1.0dependencies: - name: otel registry_path: https://github.com/open-telemetry/semantic-conventions/archive/refs/tags/v1.34.0.zip[model]This sets up your application to build on top of the existing conventions.
Step 2: Define Application-Specific Signals
You can now define your own signals, while selectively importing parts of the base registry:
imports: metrics: - db.client.* # Bring in all DB client metrics events: - app.* # Application-level events - exception # Standard exception signals entities: - host - host.cpuDefine a new metric for tracking task completion time:
groups: - id: metric.todo.completion_time type: metric brief: Time between task creation and completion metric_name: todo.completion_time instrument: histogram unit: s attributes: - id: todo.priority type: string brief: Task priority level (high, medium, low) - id: todo.category type: string brief: Task category or project assignment - ref: user.id requirement_level: required entity_associations: - os.name - os.versionThis metric uses a custom schema, but reuses standard attributes like user.id.
Step 3: Define Custom Events
Events follow the same structure:
- id: event.todo.deleted type: event brief: Emitted when user deletes a task attributes: - id: delete.reason type: string brief: Reason for task deletion (completed, cancelled, duplicate) - id: todo.priority type: string brief: Priority of deleted task - ref: user.id requirement_level: required entity_associations: - os.name - os.versionTooling Support Remains the Same
Your custom registry supports:
- Validation with
weaver registry check - Markdown docs with
weaver registry update-markdown - Code generation with
weaver registry generate
This gives you the benefits of semantic conventions, consistency, type safety, and documentation tailored to your application’s domain.
Integrating Weaver Into Existing Workflows
Weaver works best when it fits naturally into your existing tooling. Instead of requiring teams to follow manual steps or track telemetry changes, you can bake schema validation and instrumentation checks into CI pipelines, local development environments, and test suites.
CI/CD: Prevent Schema Drift Before It Reaches Production
You can add registry validation directly into your CI pipeline. This allows every change to your telemetry definitions to be reviewed just like application code.
Here’s an example GitHub Actions workflow:
# .github/workflows/validate-telemetry.ymlname: Validate Telemetry Schema
on: [push, pull_request]
jobs:  validate:    runs-on: ubuntu-latest    steps:      - uses: actions/checkout@v3      - name: Validate Registry        run: |          wget https://github.com/open-telemetry/weaver/releases/latest/download/weaver-linux-amd64          chmod +x weaver-linux-amd64          ./weaver-linux-amd64 registry check -r ./telemetry/registry
If someone introduces a change that breaks existing telemetry, such as modifying a field’s type or removing a required attribute, the workflow flags it during review. This protects dashboards, alerts, and downstream tooling from unexpected changes.
Local Development: Keep Code and Schema in Sync
Teams can install Weaver locally and use it to generate constants, helpers, and builder functions from the telemetry registry. This keeps instrumentation consistent and reduces manual errors.
# Install Weavercurl -L https://github.com/open-telemetry/weaver/releases/latest/download/weaver-$(uname -s)-$(uname -m) -o weaverchmod +x weaversudo mv weaver /usr/local/bin/
# Generate Go code from the registryweaver registry generate -r ./telemetry/registry -t ./templates go
This step can also be automated inside your build or pre-commit scripts, so instrumentation code always reflects the latest schema changes.
Testing: Validate Instrumentation During Runtime
Weaver’s live-check lets you verify that your running application emits telemetry that matches the registry definition. It’s especially useful during integration or system tests.
Here’s an example test in Go:
func TestInstrumentationCoverage(t *testing.T) {    app := startTestApplication()    defer app.Stop()
    runTestScenarios(app)
    output := captureOTLPOutput()    coverage := weaver.LiveCheck(output, registryPath)
    if coverage.MissingSignals > 0 {        t.Errorf("Missing %d expected signals", coverage.MissingSignals)    }}
This test helps verify that:
- All expected metrics or spans are present
- Attributes are named and typed correctly
- The telemetry structure follows the defined conventions
This way, by running as part of your CI test suite, you treat observability as a contract, enforced just like any other part of your application behavior.
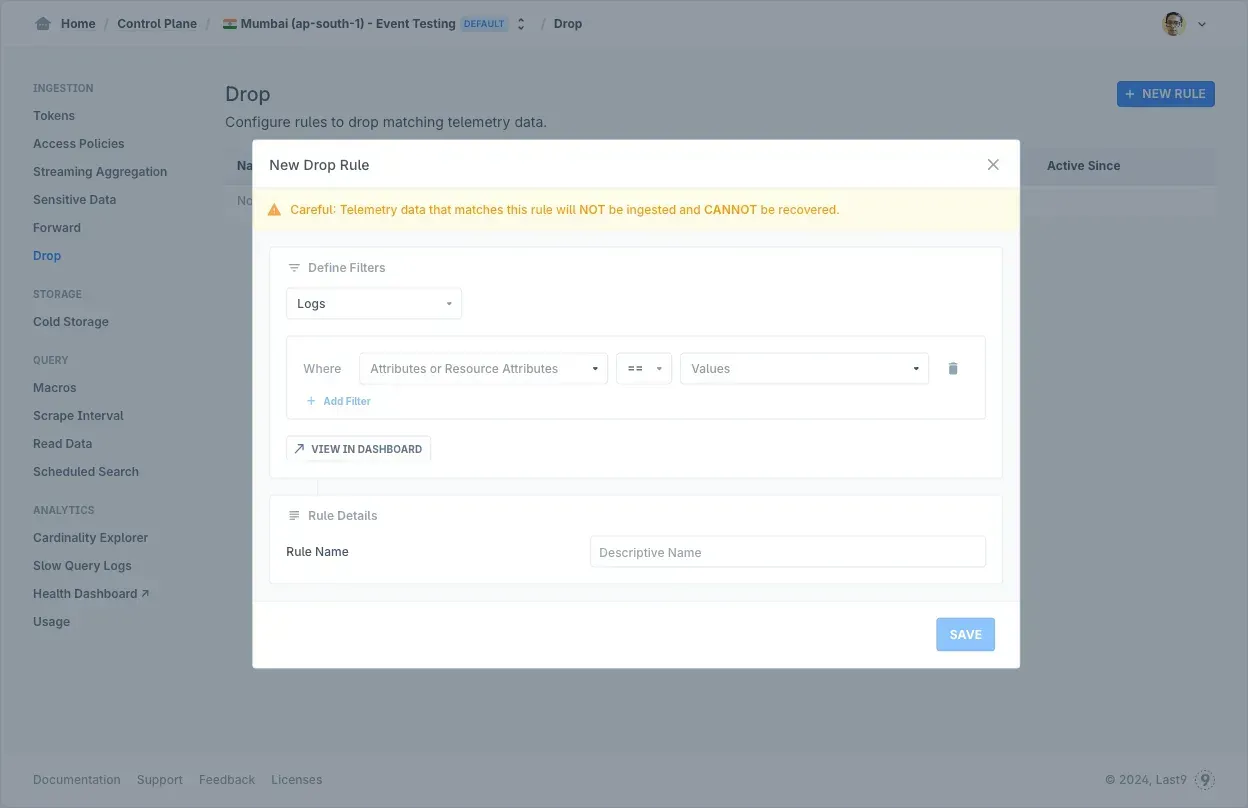
Last9’s Control Plane lets you clean up and standardize telemetry, like renaming metrics, fixing label keys, and redacting sensitive data, right at ingestion.
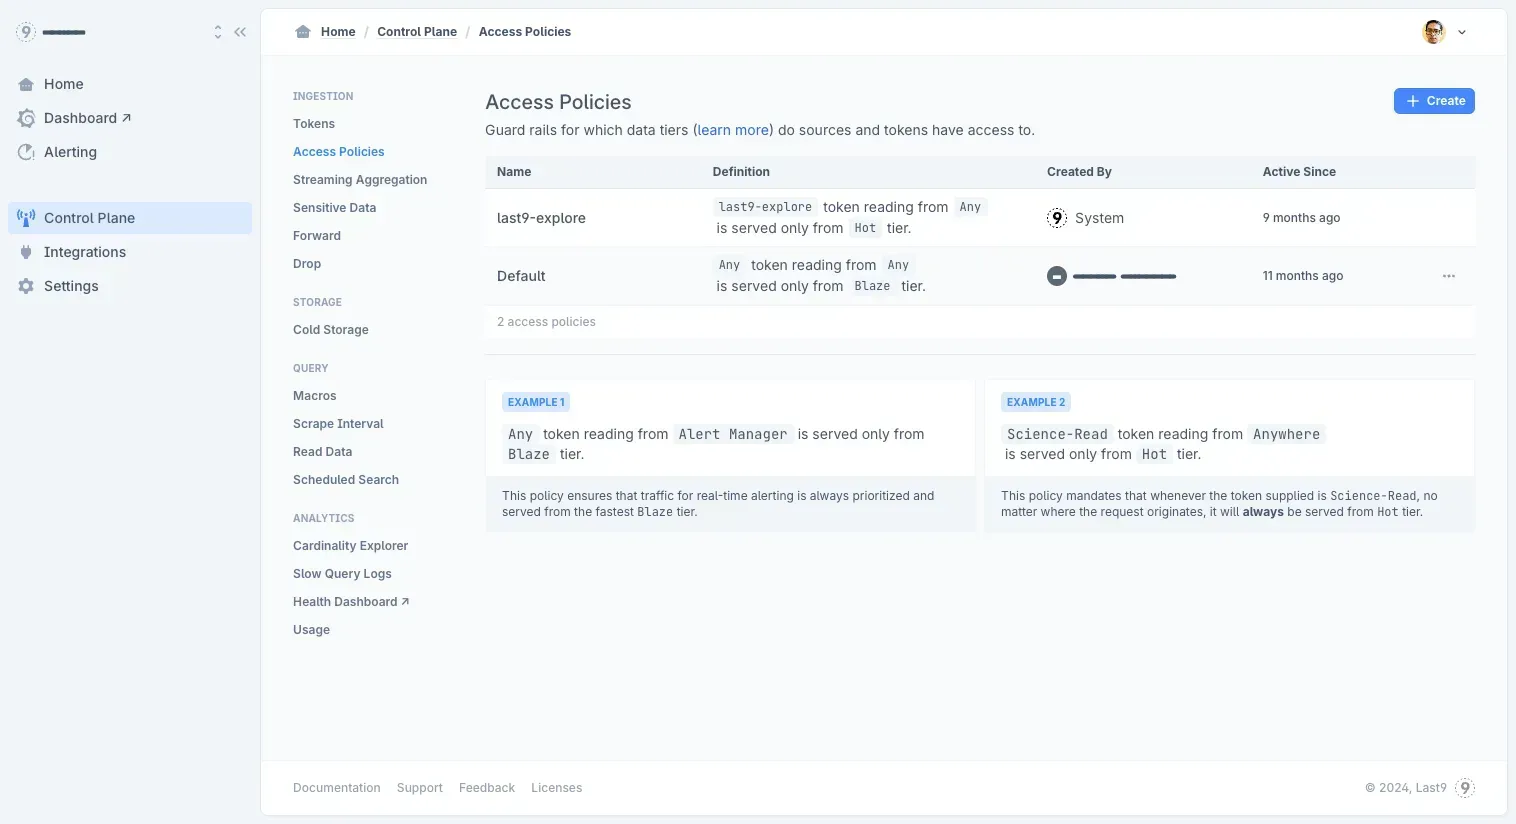
You can drop noisy data, forward logs to cold storage, and apply consistent naming across services, all without changing your application code. This helps reduce cardinality, control costs, and make dashboards and alerts more reliable.
Getting Started with OTel Weaver
Weaver is available as a pre-built binary for all major platforms, as well as a Docker image for CI/CD environments. It works alongside existing OpenTelemetry instrumentation; no need to rewrite your application code.
To get started:
- Validate your current telemetry against the standard OpenTelemetry registry
- Use
live-checkto compare your actual telemetry output to the expected schema - Identify inconsistent naming, missing fields, or unexpected types
- Begin adopting generated constants and helper functions in new services or modules
What’s Coming Next
The OpenTelemetry project is actively improving Weaver to support larger, more distributed systems. Some of the upcoming features include:
- Multi-registry support, making it easier to manage shared telemetry definitions across services and teams
- Schema packaging, so teams can version, publish, and consume telemetry schemas like any other dependency
- Improved code generation, including more complete support for type-safe instrumentation in multiple languages
Weaver’s direction is clear: treat observability schemas as shared infrastructure. Instead of every vendor or team building their formats, the ecosystem can align around standard, machine-readable definitions.
And if you want to go further, join our Discord community. There’s a dedicated channel where you can discuss your setup, ask technical questions, and get help from other developers.

