

TL;DR:
- Naming problems usually show up the moment you try to search or aggregate telemetry - two similar metrics mean different things, or a span name carries a UUID that quietly explodes cardinality. This update focuses on fixing those issues early.
- OTel encourages keeping names stable and descriptive (
http.server.request.duration), while pushing details like service, route, or status into attributes where they can be filtered and grouped properly. - When changes are needed, rolling out new names gradually - or translating them at ingestion - helps keep existing dashboards and alerts working without breaking queries during the transition.
Introduction
An incident’s in progress. Services are slow, customers are frustrated, and your dashboards… look fine. At least, until you search for payment metrics and get 47 different names for the same signal. Suddenly, the real issue isn’t latency - it’s inconsistency.
The OpenTelemetry project recently published a three-part series on naming conventions to solve exactly this problem. The guidance covers how to name spans, attributes, and metrics consistently, so your telemetry is easier to query, correlate, and trust.
The Problem: Naming Chaos Across Teams
Without a shared naming standard, you end up with:
- The same operation reported under different metric names across services
- Attribute keys like
user_id,userId,user.id, anduidall representing the same dimension - Metric identifiers overloaded with service names, versions, and units:
payment_service_v2_latency_ms - Span names polluted with high-cardinality values, such as
process_invoice_#98765 - Queries that only resolve correctly for a single service or team
This fragmentation makes it difficult to:
- Write portable queries that run across all services
- Build dashboards that capture system-wide behavior
- Correlate spans, metrics, and logs across teams
- Aggregate time series across microservices
- Debug distributed failures end-to-end
The impact is: longer incident response times, broken dashboards after deploys, and observability data you can’t fully trust.
Automatically instrument your Linux apps with the OTel Injector-no code changes required, quick setup, and support for Java, Node.js, Python, and .NET.
Part 1: How to Name Your Spans
OpenTelemetry published a guide on span naming. The principle is straightforward: use a {verb} {object} pattern when naming your custom business logic spans. This keeps names clear, consistent, and low cardinality.
Here’s what that looks like:
- Good:
process payment,send invoice,calculate tax,validate order - Bad:
process_invoice_#98765,user_jane_doe_login,calculate_tax_for_order_12345,payment_service_process_v2
The difference is subtle but important. Span names describe the type of operation, not the specific instance. If you need to record high-cardinality details-such as invoice numbers or user IDs-put those into span attributes, not the name.
Keeping span names low cardinality pays off quickly. You can group all spans for the same operation, filter them by type, compare execution times, and avoid excess storage usage. In short, your telemetry stays easier to query, analyze, and control.
This approach matches OpenTelemetry’s semantic conventions. For example, HTTP server spans follow patterns like GET /api/users, database spans use SELECT products, and message queues use verbs like publish order.created. When you follow the same structure for your own spans, you build on the same design philosophy that powers the broader OpenTelemetry ecosystem.
Part 2: How to Name Your Span Attributes
Span Attributes are the contextual fields that make spans more than just timing markers. Attributes give you the “who, what, and where” needed to debug effectively.
Start with Semantic Conventions
The first rule of thumb: stick to OpenTelemetry’s conventions when they exist. They’re there to make sure data lines up across different systems.
Here’s an example with database spans:
Harder to query
{ "database": "postgres", "query": "SELECT * FROM users", "db_host": "prod-db-1"}Clearer and consistent
{ "db.system": "postgresql", "db.statement": "SELECT * FROM users WHERE id = ?", "db.name": "users_db", "server.address": "prod-db-1"}Using the standard keys means your backend can automatically correlate operations, queries stay consistent across teams, and many backends provide pre-built dashboards out of the box. Before inventing a new attribute, check the semantic conventions-you’ll often find the field already exists.
Create Custom Attributes
You’ll still need attributes unique to your business logic. For those, a few guidelines make the data easier to work with:
- Lowercase with dot separators
- Clearer:
order.priority,user.subscription_tier,payment.method - Harder to query:
orderId,order_total,status
- Clearer:
- Namespace related attributes under a common prefix
- Clearer:
order.id,order.total,order.status,order.created_at - Harder to query: scattering them as
orderId,total, orcreated
- Clearer:
- Be specific, but avoid unnecessary nesting
- Clearer:
http.request.method - Too nested:
request.http.method - Too vague:
method
- Clearer:
- Keep names stable-let values carry the dynamic data
Clearer and consistent
{ "user.id": "12345" }{ "user.action": "login" }{ "order.id": "67890" }{ "order.status": "completed" }Harder to query
{ "user_12345.action": "login" }{ "order_67890.status": "completed" }Why is this Important
Following these practices gives you attributes that are consistent, queryable, and easy to correlate across services. Instead of fighting with mismatched keys or exploding cardinality, you get telemetry that helps you focus on debugging the issue at hand.
Consistent naming works best when your backend supports it-see how Prometheus 3.0 handles resource attributes in OTel metrics.
Part 3: How to Name Your Metrics
The third part focuses on metrics-the quantitative backbone of observability.
Service Names and Metric Names
It’s common to see service names baked directly into metric names. That works locally but becomes harder to manage across systems. For instance:
payment.transaction.countpayment.latency.p95payment.error.rateuser_service_auth_latency_msinventory_db_query_secondsA more flexible pattern is to use a clean metric name and keep the service identity in attributes:
transaction.count with service.name=paymenthttp.server.request.duration with service.name=paymenterror.rate with service.name=paymentauth.duration with service.name=userdb.client.operation.duration with service.name=inventoryThis way, queries scale naturally. You can run sum(transaction.count) to see totals across all services, or narrow it with service.name="payment" when you need to focus. With this style, one query works everywhere instead of needing a different query for each team.
Handling Units
Another pattern you may have run into is including units in metric names:
response_time_millisecondsmemory_usage_bytesthroughput_requests_per_secondOpenTelemetry encourages putting units in metadata instead:
http.server.request.duration with unit: mssystem.memory.usage with unit: Byhttp.server.request.rate with unit: {request}/sThis keeps names uncluttered, ensures units follow the UCUM standard, and lets backends handle conversions automatically.
Rich Context Instead of Long Names
What really sets OpenTelemetry metrics apart is the layered context model. Rather than overloading the name, you can rely on resources, scopes, and attributes:
Traditional (Prometheus-style):
payment_service_transaction_total{method="credit_card",status="success"}user_service_auth_latency_milliseconds{endpoint="/login",region="us-east"}OpenTelemetry approach:
transaction.count  Resource: service.name=payment, service.version=1.2.3, deployment.environment=prod  Scope: instrumentation.library.name=com.acme.payment  Attributes: method=credit_card, status=success
auth.duration  Resource: service.name=user, service.version=2.0.1  Scope: instrumentation.library.name=express.middleware  Attributes: endpoint=/login, region=us-east  Unit: ms
This separation keeps metric names concise while still preserving all the context you need to analyze, filter, and compare results across environments.
Practical Migration Examples
Here’s a side-by-side view of how traditional metric names compare to OpenTelemetry’s model, and what you gain by making the shift:
| Traditional (context + units in name) | OpenTelemetry (clean separation) | Why it works better |
|---|---|---|
payment_transaction_total | transaction.count + service.name=payment | Can be aggregated across services |
user_service_auth_latency_ms | auth.duration + service.name=user + unit: ms | Standard name with proper unit metadata |
inventory_db_query_seconds | db.client.operation.duration + service.name=inventory + unit: s | Aligns with semantic conventions |
api_gateway_requests_per_second | http.server.request.rate + service.name=api-gateway + unit: {request}/s | Clean name with proper rate unit |
With OpenTelemetry, the metric name stays concise while context is captured in attributes and metadata. This keeps queries consistent and makes it easier to reuse the same dashboards across multiple services.
Audit Your Existing Telemetry
Telemetry in production often grows unevenly over time. Different teams, different services, and shifting priorities can all leave traces in the form of inconsistent naming. An audit is a practical way to understand where things stand today and where conventions can make querying and analysis smoother.
High-Cardinality Names
High-cardinality span names or metrics usually indicate that dynamic data ended up in the name rather than in attributes. You’ll notice this when:
- A name only shows up once or a handful of times
- Identifiers like UUIDs, user IDs, or timestamps are included directly in the name
- There are hundreds of slight variations of what’s essentially the same operation
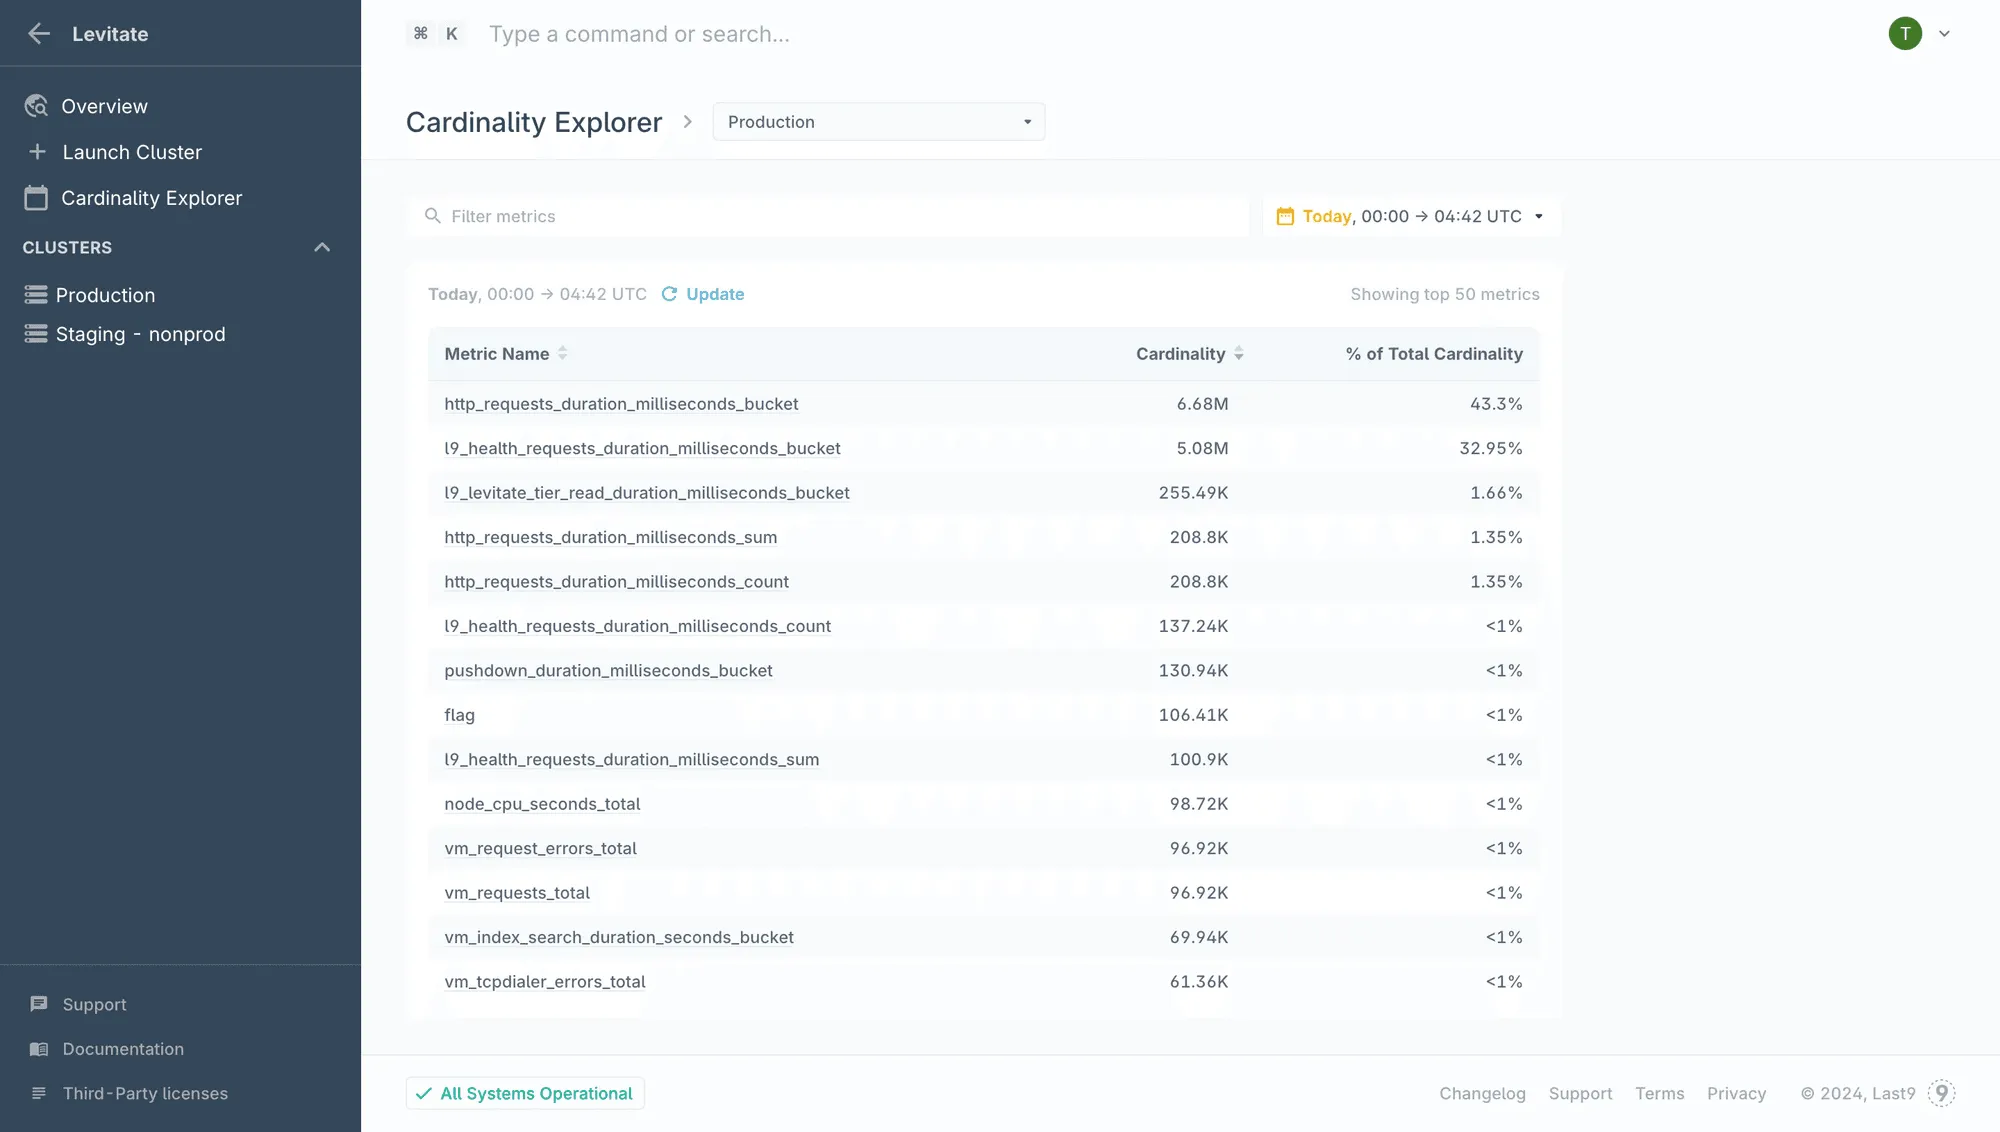
Last9’s Cardinality Explorer makes it simple to review cardinality and pinpoint where unique names are higher than expected.
Inconsistent Naming
It’s also common to find the same concept expressed in multiple ways. For example:
- Spans:
process_payment,processPayment,payment_processor,handle_payment_request - Attributes:
service.env,service.environment,deployment.environment,env,environment - Metrics:
payment_latency_ms,payment.duration,payment_service_latency,PaymentProcessingTime
Searching for common terms is a quick way to spot this kind of variation and identify where naming could be standardized.
Missing Semantic Conventions
When attributes don’t line up with OpenTelemetry’s semantic conventions, you lose some built-in advantages.
For instance, database calls without db.system, db.statement, and db.name won’t be automatically correlated, and pre-built dashboards won’t display as expected. Following conventions ensures these features work out of the box and keeps queries simpler.
Metric Naming Patterns
Metrics often carry extra baggage in their names. Look for cases where the metric name includes:
- Service names, e.g.
payment_service_latency - Versions, e.g.
api_v2_requests - Environments, e.g.
prod_payment_errors - Technology stacks, e.g.
nodejs_payment_memory - Units, e.g.
latency_ms,memory_bytes
Each of these is easier to manage when expressed as attributes or metadata, leaving the metric name itself clear and reusable.
Fix Bad Naming Without Breaking Everything
When you update telemetry naming, you also touch dashboards, alerts, and queries that depend on existing names. To avoid disruption, you’ll want a migration strategy that balances consistency with continuity. Here are three ways you can approach it.
Strategy 1: Dual Emission
You can emit both the existing and updated names for a short transition period.
# Attributesspan.set_attribute("user_id", user_id)      # Existingspan.set_attribute("user.id", user_id)      # Updated (semantic convention)
# Metricspayment_latency_ms.record(duration_ms)      # Existinghttp_server_request_duration.record(        # Updated    duration_ms,    attributes={"service.name": "payment"})
This gives you time to:
- Update dashboards and queries gradually
- Confirm that the updated names are flowing correctly
- Retire the older names in a later release
The result is temporary duplication in your telemetry data, but you get a zero-downtime migration.
Strategy 2: Transform at Ingestion
With Last9’s Control Plane, you can standardize telemetry as it arrives-before it’s stored-without touching application code. Ingestion rules let you:
- Remap attribute keys (for example,
user_id→user.id) - Consolidate variations (
env,environment,deployment.environment) into one field - Drop redundant or deprecated attributes
- Rewrite metric and attribute names to match OpenTelemetry conventions
- Redact sensitive values when needed
Because this happens at the ingestion layer, you can experiment with naming changes, clean up third-party instrumentation, or unify data across services-all while your applications keep sending data unchanged.
Strategy 3: Incremental Rollout
You can also adopt conventions gradually. Start with new services and apply the updated naming from day one. For existing services, refactor as you touch the code. If you need both versions in play during the transition, you can fall back on the dual-emission pattern.
This avoids a disruptive “big bang” migration and gives you a path to consistency at a pace your teams can handle.
Make Good Naming Stick
Once you’ve cleaned up your telemetry, the next challenge is keeping it consistent. A few practices can help you avoid drifting back into old habits.
Use OTel Weaver for Schema Validation
With OTel Weaver, you can define a telemetry schema and validate instrumentation against it. Consider it as a registry where you describe spans, attributes, and metrics, then check code against those rules.
For example, you might define a payment span and a transaction metric:
groups:  - id: span.payment.process    type: span    brief: Process a payment transaction    span_name: process payment    attributes:      - ref: payment.id        requirement_level: required      - ref: payment.amount        requirement_level: required
  - id: metric.transaction.count    type: metric    brief: Number of transactions processed    metric_name: transaction.count    instrument: counter    unit: "1"    attributes:      - ref: payment.method      - ref: transaction.status
You can then validate your code against this schema:
weaver registry check -r ./telemetry-schemaThis step ensures naming issues are caught before they ever reach production.
Add CI/CD Checks
Schema validation works best when it’s automated. You can add a check in your CI pipeline so any pull request introducing inconsistent naming gets flagged during review:
# .github/workflows/validate-telemetry.yml- name: Validate Telemetry Schema run: | weaver registry check -r ./telemetryDocument Your Standards
Alongside automation, clear documentation helps everyone stay on the same page. Your guide should cover:
- Which OpenTelemetry semantic conventions to follow
- How your team names custom attributes
- Examples of consistent vs. inconsistent naming
- How to validate instrumentation locally
- Strategies for migrating older code
Sharing this as part of onboarding means new engineers adopt the same practices from the start.
Troubleshoot Common Issues
Even with the best intentions, telemetry data often drifts into patterns that confuse later. Here are some of the ways it usually happens.
Span names, which describe what your service is doing, can get overloaded with details. Instead of just saying “process payment”, you might see names that include specific IDs or version numbers. That makes them harder to group.
- Example of a problem:
process_invoice_98765 - Better:
process paymentwith the invoice number stored separately
Attributes-the extra details attached to spans or metrics-can also become messy. Teams sometimes use different styles for the same thing, or squash multiple pieces of information into one field.
- Example of a problem:
userId,user_id, anduser.idall are being used for the same concept - Better: pick one consistent style and stick to it
Metrics are where naming tends to spiral the most. It’s tempting to put every bit of context in the name itself, but that makes queries clunky and dashboards harder to maintain.
- Service names in the metric:
payment_service_latency - Version numbers:
api_v2_requests - Environment labels:
prod_errors - Units jammed in:
latency_ms,memory_bytes
Keep names simple.
- For spans: use short action phrases like “process payment”
- For attributes: use one consistent style and reuse common standards
- For metrics: keep the name clean and add details elsewhere
Resources
OpenTelemetry Official Guides:
Last9 Resources:

