

Modern application observability is essential for ensuring system performance, diagnosing issues, and optimizing user experiences. OpenTelemetry (Otel) and Grafana serve as two key components in achieving end-to-end visibility.
While OpenTelemetry focuses on instrumenting applications to collect telemetry data, Grafana specializes in visualizing this data, making it actionable and insightful.
What is OpenTelemetry?
OpenTelemetry is an open-source observability framework that provides APIs, libraries, agents, and instrumentation to collect and export telemetry data, including metrics, traces, and logs. It supports multiple programming languages, making it a flexible choice for distributed applications.
What is Grafana?
Grafana is an open-source analytics and monitoring platform that allows users to query, visualize, and alert on metrics. It integrates seamlessly with various data sources such as Prometheus, Loki, Tempo, and OpenTelemetry to create rich, customizable dashboards.
To enhance your Grafana dashboards with dynamic filtering and customization, check out our guide on Grafana Variables.
Step-by-Step Guide to Configuring OpenTelemetry with OTLP Exporters
To integrate OpenTelemetry with Grafana, follow these steps:
Install OpenTelemetry SDKs and Collectors:
Ensure your application is instrumented with OpenTelemetry SDKs (available for Python, Java, Go, etc.) and deploy an OpenTelemetry Collector.
- Define the OTLP endpoint in the configuration file:
- Configure OpenTelemetry Collector to send data to a backend that Grafana can query.
- Example Prometheus receiver:
Deploy and Run:
- Start OpenTelemetry Collector:
otelcol --config=config.yaml - Ensure metrics and traces appear in Grafana.
Set Up a Backend (e.g., Prometheus, Loki, or Last9):
receivers: prometheus: config: scrape_configs: - job_name: "otel-metrics" static_configs: - targets: ["localhost:9464"]Configure the OTLP Exporter:
exporters: otlp: endpoint: "http://grafana-instance:4317" tls: falseVisualize Your Telemetry Data with Grafana Dashboards
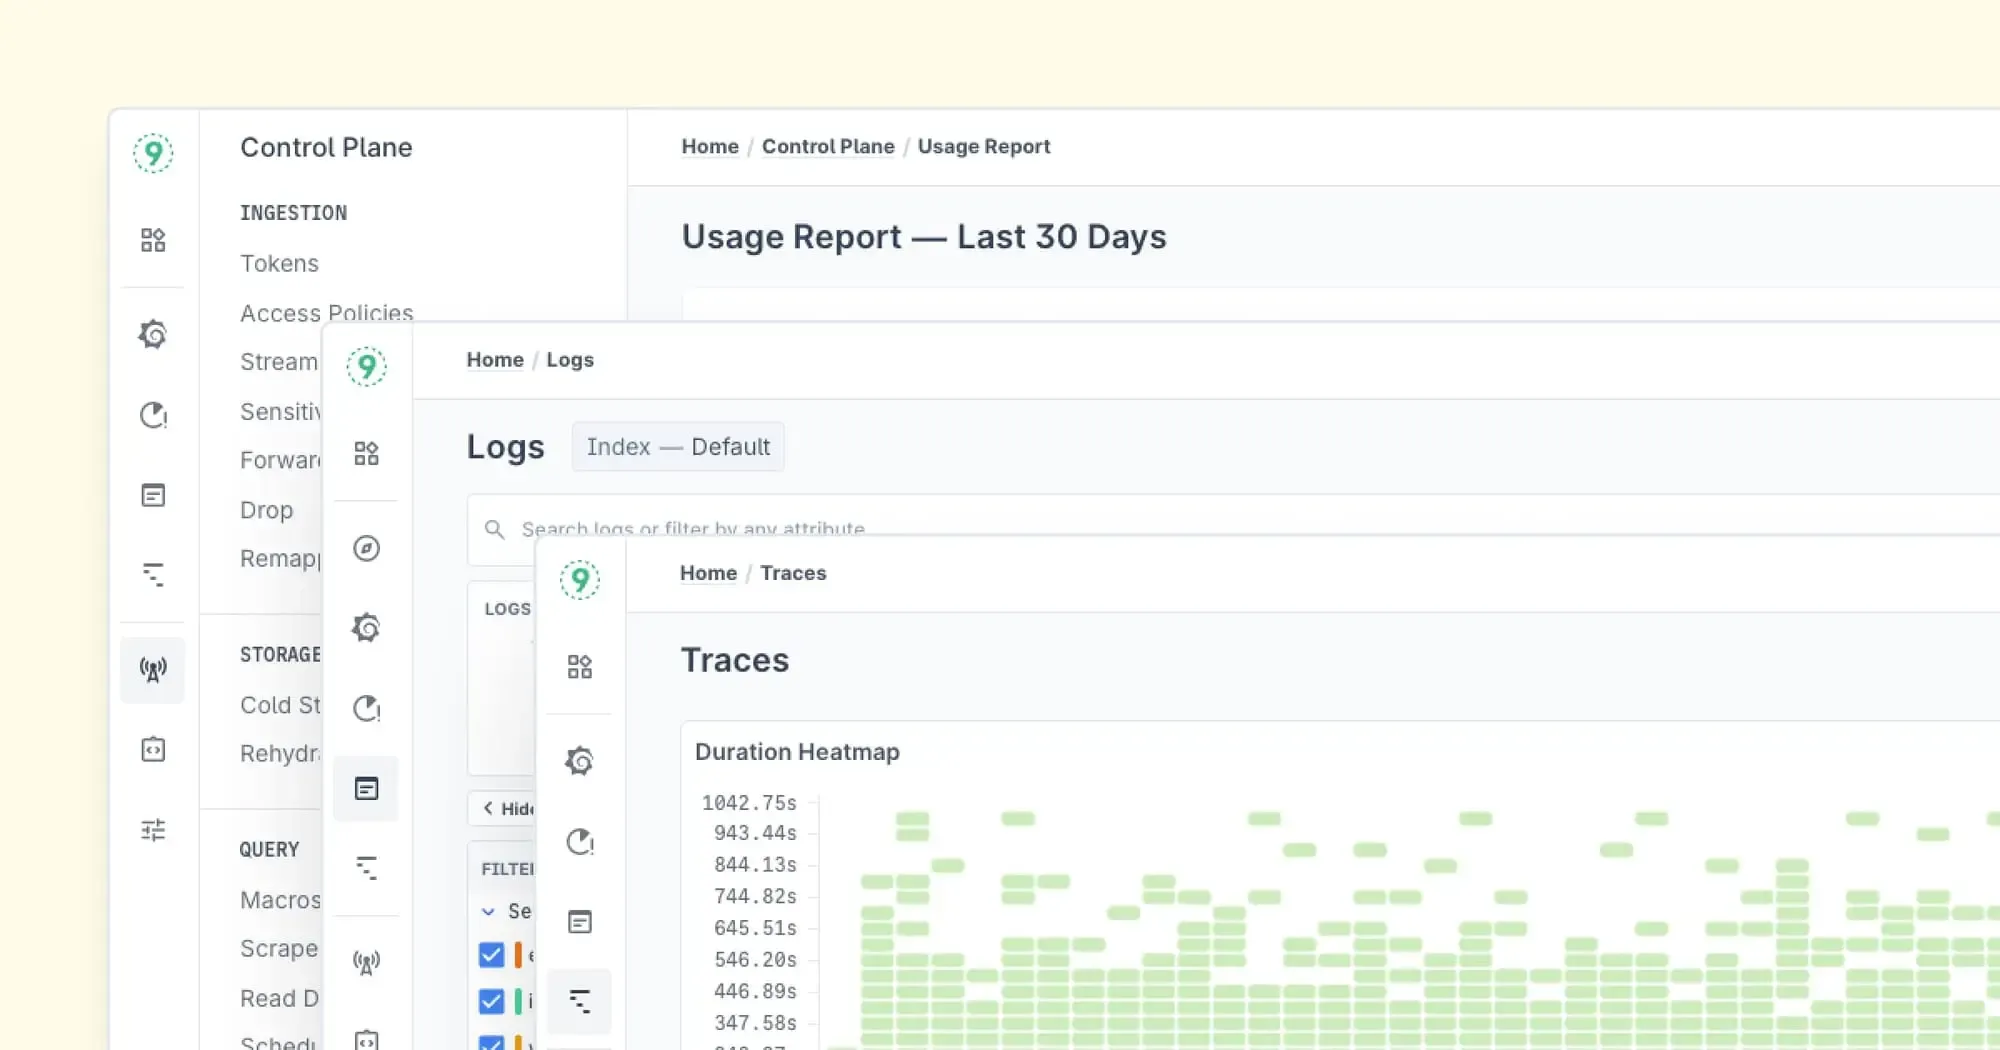
Grafana provides powerful dashboards to visualize traces, metrics, and logs collected via OpenTelemetry. Some key ways to leverage dashboards include:
- Creating time-series charts for CPU and memory usage.
- Setting up heatmaps to analyze request latencies.
- Using histograms to track application performance over time.
OpenTelemetry vs. Grafana
OpenTelemetry: The Data Collection Framework
OpenTelemetry (OTel) is an open-source observability framework that focuses on generating, collecting, and exporting telemetry data, including:
- Traces – To track requests across distributed systems.
- Metrics – To measure system performance, such as CPU usage or request latency.
- Logs – To capture detailed event data for debugging.
OTel provides SDKs and APIs that developers can use to instrument their applications, meaning it enables applications to emit telemetry data that can be later analyzed. However, OpenTelemetry does not store or visualize this data—it simply collects and forwards it to backends like Prometheus, Jaeger, or Grafana.
Grafana: The Visualization and Analysis Platform
Grafana is a powerful observability platform designed for visualizing and analyzing telemetry data. Unlike OpenTelemetry, which focuses on data collection, Grafana is responsible for:
- Creating dashboards – Turning raw telemetry data into meaningful charts and graphs.
- Setting up alerts – Notifying teams when metrics cross predefined thresholds.
- Exploring logs and traces – Helping developers diagnose issues in real-time.
Grafana does not generate telemetry data on its own—it depends on sources like Prometheus, Loki, Jaeger, or OpenTelemetry for incoming data.
How OpenTelemetry and Grafana Work Together
Since OpenTelemetry gathers data and Grafana visualizes it, they work seamlessly together in the observability pipeline:
- Instrumentation with OpenTelemetry
- Developers use OpenTelemetry SDKs to collect traces, metrics, and logs from their applications.
- Exporting Data
- OpenTelemetry exports the collected telemetry data to observability backends such as Prometheus (for metrics), Jaeger (for traces), or Last9 (for metrics, logs, and traces).
- Visualization in Grafana
- Grafana connects to these data sources and transforms raw data into meaningful dashboards, alerts, and analytics.
- Monitoring and Troubleshooting
- Engineers use Grafana to monitor system performance, set up alerts for anomalies, and analyze logs and traces to troubleshoot issues.
Use Case: Observing a Distributed Microservices System
Imagine you have a microservices-based application running in Kubernetes:
- OpenTelemetry is instrumented in the services to collect traces and metrics.
- The telemetry data is exported to Prometheus (metrics) and Jaeger (traces).
- Grafana visualizes the data, allowing developers to see service dependencies, request latencies, and error rates in real time.
For a deeper look into visualizing telemetry data, explore our guide on OpenTelemetry UI.
How Can You Visualize OpenTelemetry Metrics Effectively
Craft Visualization Solutions
To make the most of OpenTelemetry data, use Grafana’s built-in features:
- Pre-configured dashboards for Prometheus, Loki, and Tempo.
- Custom panels to filter and aggregate telemetry data.
- Real-time alerts to notify teams about anomalies.
Grafana Cloud and Prometheus – How They Integrate for Metrics Collection
Prometheus acts as a robust storage solution for OpenTelemetry metrics. Configuring Grafana to use Prometheus as a data source enables real-time monitoring and analysis.
Example Prometheus data source configuration in Grafana:
apiVersion: 1datasources: - name: Prometheus type: prometheus access: proxy url: http://prometheus:9090Open Source Tools: Utilizing Loki and Tempo for Distributed Tracing
- Loki: Efficiently handles logs to provide contextual insights.
- Tempo: Enables distributed tracing to monitor complex microservices interactions.
Example Loki configuration:
scrape_configs: - job_name: "loki" static_configs: - targets: ["loki:3100"]Learn how to optimize performance and handle high-volume telemetry data with our guide on Scaling the OpenTelemetry Collector.
How to Create Time Series Visualizations in Grafana Dashboards
Using Grafana’s visualization tools, you can create:
- Time-series charts for real-time metric monitoring.
- Heatmaps to analyze system load.
- Pie charts and bar graphs for custom KPIs.
Example panel JSON configuration for a time-series graph:
{ "title": "Request Latency", "type": "timeseries", "targets": [ { "expr": "histogram_quantile(0.99, rate(http_request_duration_seconds_bucket[5m]))", "legendFormat": "99th percentile" } ]}Grafana Labs Plugins:
Grafana Labs provides a rich ecosystem of plugins that enhance the functionality of Grafana, allowing users to integrate different data sources, customize dashboards, and improve visualization capabilities.
These plugins extend Grafana’s capabilities beyond its default features, making it a powerful observability platform for a wide range of use cases.
Types of Grafana Plugins
Grafana plugins fall into three main categories:
- Data Source Plugins
- Allow Grafana to connect to various databases and observability backends.
- Examples: Prometheus, Loki, Last9, OpenTelemetry exporters
- Panel Plugins
- Provide additional visualization options beyond Grafana’s built-in charts.
- Examples: Plotly panel, Map panel, Pie Chart panel
- App Plugins
- Bundle multiple functionalities, such as custom dashboards, UI enhancements, and integrated workflows.
- Examples: Kubernetes Monitoring, AWS CloudWatch App
Discover how to efficiently export metrics with our Comprehensive Guide to Prometheus Remote Write Exporter.
OpenTelemetry Exporters in Grafana Plugins
Grafana Labs offers plugins that support OpenTelemetry exporters, ensuring smooth data ingestion from OpenTelemetry-instrumented applications.
These exporters allow OpenTelemetry-collected telemetry data (traces, metrics, logs) to be sent directly to Grafana-compatible backends like Prometheus, Tempo, and Last9
How OpenTelemetry Plugins Enhance Observability in Grafana
- Seamless Data Flow
- OpenTelemetry collects telemetry data from applications and forwards it to a backend (e.g., Prometheus for metrics, Tempo for traces).
- Grafana plugins pull this data from backends, enabling real-time visualization.
- Improved Customization
- Users can fine-tune dashboards using OpenTelemetry-specific visualization panels.
- Enhanced Troubleshooting
- OpenTelemetry data combined with Grafana’s dashboards provides deeper insights into system performance and application health.
Potential Limitations of OpenTelemetry
While OpenTelemetry is a powerful observability framework, it comes with its own set of challenges. Setting it up and maintaining it requires technical expertise, and users may encounter integration hurdles along the way.
However, OpenTelemetry’s open-source flexibility and strong community support help mitigate these challenges.
Complex Configurations: Challenges in Setting Up OpenTelemetry Pipelines
Getting OpenTelemetry up and running isn’t always straightforward. It requires configuring SDKs, setting up exporters, and ensuring proper backend integration.
This can be time-consuming, especially for teams new to observability tools. Understanding the right setup for traces, metrics, and logs in a distributed system takes effort and planning.
Compatibility Issues: Troubleshooting gRPC and SDK Integrations
Different versions of OpenTelemetry SDKs and communication protocols like gRPC can sometimes lead to compatibility issues. These problems may arise when integrating with third-party backends, requiring careful debugging.
Ensuring all components—applications, SDKs, and telemetry backends—are correctly configured can be a challenge, particularly in large-scale systems.
Understand log severity and best practices with our guide on Log Levels: Answers to the Most Common Questions.
How to Navigate These Challenges
Vendor-Neutral Solutions: Emphasizing Open Source Flexibility
One of OpenTelemetry’s biggest advantages is its vendor-neutral approach.
Unlike proprietary observability solutions, it allows users to send collected data to various backends like Prometheus, Last9, and Zipkin. This flexibility helps organizations avoid vendor lock-in and choose the best tools for their specific needs.
Community Support: Using GitHub and Webinars for Troubleshooting
Despite its complexities, OpenTelemetry benefits from a strong and active community. Developers worldwide contribute to its open-source development, and users can find support through GitHub discussions, forums, and webinars.
Whether troubleshooting issues or learning best practices, the OpenTelemetry community provides valuable resources to help teams adopt and optimize the framework.
What is Grafana Alloy?
Grafana Alloy is a new observability solution that builds on OpenTelemetry, providing deeper insights and enhanced alerting for monitoring distributed systems.
Integration with Kubernetes
Optimized for Kubernetes, Grafana Alloy simplifies monitoring in cloud-native environments, making it ideal for containerized applications.
Use Cases and Advantages
Distributed Tracing and Alerting
Grafana Alloy improves tracing capabilities, helping detect latency issues and visualize service dependencies in real-time.
Compatibility with AWS and Docker
It integrates easily with AWS, Docker, and other cloud platforms, making it a flexible solution for diverse infrastructures.
How to Configure a Free Account on Grafana Cloud
Grafana Cloud offers a free tier for getting started. Simply sign up, integrate your OpenTelemetry data, and start visualizing insights instantly.
Conclusion
With OpenTelemetry and Grafana, organizations can build a robust observability strategy that improves performance monitoring and troubleshooting. Using open-source projects like Prometheus, Loki, Tempo, and Grafana Alloy enables cost-effective and scalable observability solutions.
And if you’d like to continue the discussion, join our Discord community! We have a dedicated channel where you can share your use case with other developers.
FAQs
How to connect OpenTelemetry with Grafana?
To connect OpenTelemetry with Grafana, first instrument your application using OpenTelemetry SDKs and configure exporters to send telemetry data. Use Prometheus for metrics, Tempo for traces, and Loki for logs. In Grafana, add these backends as data sources and create dashboards for visualization.
What is the difference between OpenTelemetry and Grafana?
OpenTelemetry focuses on generating and collecting telemetry data, including traces, metrics, and logs. Grafana, on the other hand, is a visualization and monitoring tool that processes this data to create dashboards, alerts, and insights. OpenTelemetry gathers data, while Grafana helps interpret it.
How to visualize OpenTelemetry metrics?
Export OpenTelemetry metrics to a backend like Prometheus, then configure Prometheus as a data source in Grafana. Create custom dashboards using Grafana’s visualization panels to monitor trends and system performance.
What are the disadvantages of OpenTelemetry?
OpenTelemetry can be complex to configure, requiring expertise in SDKs, exporters, and backend integrations. Compatibility issues may arise with different versions of SDKs and gRPC protocols. Additionally, it lacks a built-in storage or visualization component, requiring integration with external tools like Prometheus and Grafana.
What is Grafana Alloy?
Grafana Alloy is an observability solution that extends OpenTelemetry’s capabilities by offering deeper insights, enhanced alerting, and better integration with monitoring tools. It is designed for cloud-native environments and works efficiently with Kubernetes.
Why use Grafana Alloy as an OpenTelemetry collector?
Grafana Alloy improves OpenTelemetry’s data collection by optimizing ingestion, processing, and forwarding of telemetry data to observability backends. It enhances performance, simplifies configuration, and integrates well with Kubernetes and cloud platforms.
Why and how to adopt the native OTLP log format?
The OTLP (OpenTelemetry Protocol) log format is a standardized way to transmit logs efficiently. Adopting OTLP ensures seamless integration with OpenTelemetry’s ecosystem, reducing the need for custom log processing. To implement it, configure OpenTelemetry’s logging pipeline to export logs in OTLP format to compatible storage solutions like Loki.
What is Prometheus?
Prometheus is an open-source monitoring system that collects and stores time-series metrics. It is widely used for monitoring applications, particularly in Kubernetes environments, and integrates with Grafana for visualization.
Why use Grafana observability with OpenTelemetry?
Grafana’s observability stack provides a centralized view of OpenTelemetry data, making it easier to analyze trends, set up alerts, and troubleshoot issues. It integrates with OpenTelemetry’s telemetry pipelines, ensuring seamless monitoring and visualization.
How do you automate feature engineering using pipelines and frameworks?
Feature engineering automation involves using tools like Apache Airflow, Kubeflow, or MLflow to preprocess and transform data. Pipelines automate data ingestion, feature selection, and transformation steps, improving efficiency and scalability in machine learning workflows.
How can I integrate OpenTelemetry with Grafana for monitoring and visualization?
Set up OpenTelemetry in your application, configure exporters to send data to Prometheus (metrics), Tempo (traces), or Loki (logs), and add these data sources in Grafana. Create dashboards and alerts in Grafana to monitor and analyze the collected telemetry data.

