

Most developers are familiar with Opentelemetry core components—Traces, Metrics, and Logs. But there’s one part of the OpenTelemetry ecosystem that doesn’t always get the spotlight: processors. These behind-the-scenes operators shape your data pipeline, helping you filter, enrich, and fine-tune telemetry data before it reaches your backend systems.
Processors play a key role in making sure your data is cleaner, more useful, and just the way you need it. In this guide, we’ll break down what they do, why they matter, and how you can use them to get better insights from your telemetry data.
What Are OpenTelemetry Processors?
In simple terms, processors in OpenTelemetry are components that sit between the data collection (or “receiving”) and data exporting stages. They allow you to modify the telemetry data in transit, applying various transformations or filtering based on your needs. To see where processors sit in the larger pipeline, read our breakdown of how the OpenTelemetry Collector works.
Think of processors as the data middleman—taking the raw data collected by OpenTelemetry, processing it, and sending it to where it needs to go. They allow for things like:
- Batching telemetry data for more efficient transmission
- Dropping data that’s irrelevant or noisy
- Filtering specific traces, metrics, or logs
- Modifying the data (like adding tags, changing names, or altering attributes)
Processors offer flexibility that can be critical in scaling your observability infrastructure. Without them, you risk flooding your backends with unnecessary or redundant data, impacting both performance and cost.
For more on configuring OpenTelemetry, check out our guide on using environment variables.
Types of OpenTelemetry Processors
There are several types of processors available within OpenTelemetry, each serving a different purpose. Below are the key ones you need to know about:
1. Batch Processor
The Batch Processor is one of the most commonly used processors in OpenTelemetry. It groups telemetry data into batches before exporting them to the backend systems. This helps reduce network traffic and minimizes the number of API calls, improving performance and cost efficiency.
- Why it matters: The Batch Processor can improve system efficiency, especially in high-throughput scenarios. By batching data, you avoid overloading your backend with individual data points.
2. Span Processor
The Span Processor handles tracing data, specifically spans. It allows you to configure different behaviors for span processing, like deciding whether to record or drop specific spans. This is useful if you’re collecting trace data but want to apply filters or additional logic.
- Why it matters: For applications that produce a large number of traces, using a Span Processor can help you reduce noise or focus on the spans that matter most, improving the clarity of your observability data.
3. Attribute Processor
The Attribute Processor is designed to modify or filter attributes within telemetry data. This can be incredibly useful if you need to alter the context of a trace, metric, or log.
- Why it matters: For teams using OpenTelemetry in a distributed system, having control over the attributes in your telemetry data allows you to fine-tune what’s being tracked and how it’s being contextualized across your infrastructure.
4. Metrics Processor
The Metrics Processor is used specifically for modifying metric data before it is exported. With this processor, you can adjust the aggregation strategy, filter out unwanted metrics, or even apply custom transformations.
- Why it matters: It ensures that only the relevant metrics are sent for analysis, reducing clutter and enabling better decision-making.
5. Log Processor
The Log Processor focuses on log data. It helps in altering log entries, including modifying log levels or filtering certain types of logs before they’re sent to your logging backend.
- Why it matters: This processor ensures that you only get the logs that matter to you, preventing unnecessary logs from taking up space and cluttering your observability systems.
6. Resource Processor
A Resource Processor works with resource attributes like hostname, container ID, and environment details. It’s perfect for adding additional context to the telemetry data as it’s processed.
Why it matters: Resource-level data can be critical in large-scale distributed systems. This processor allows you to enrich your telemetry with relevant resource-related information for better visibility.
Learn more about performance insights with OpenTelemetry profiling in our detailed guide.
How Do OpenTelemetry Processors Work?
Processors are part of the OpenTelemetry SDK, and you generally configure them as part of your telemetry pipeline. They sit between your receivers (which collect telemetry data) and exporters (which send the data to monitoring or storage solutions). The data flows like this:
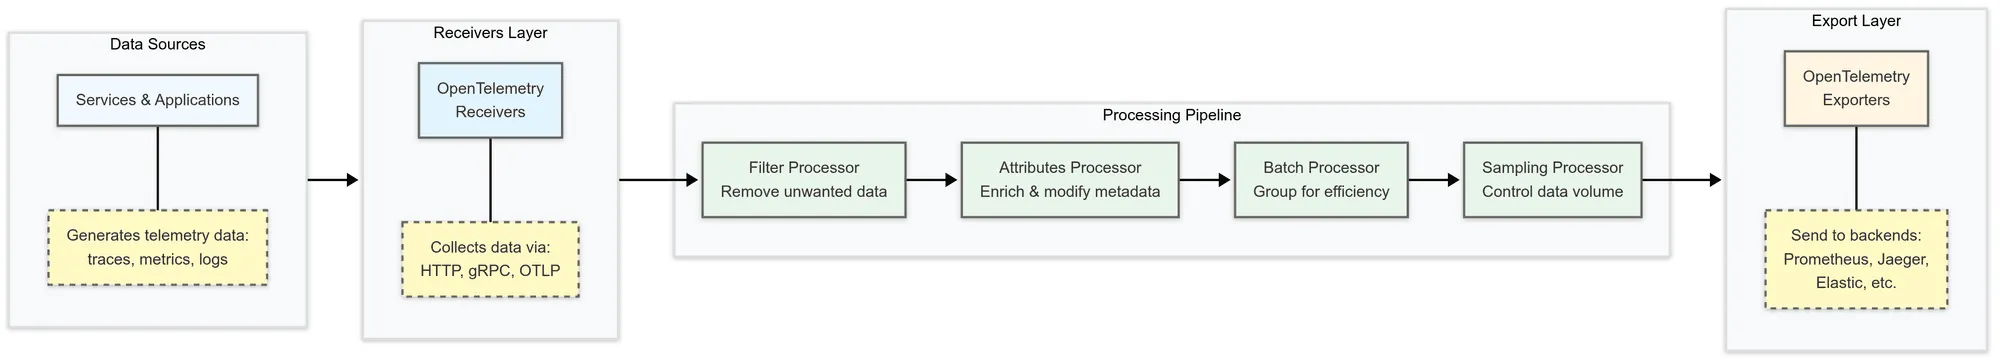
- Collection: Data is received from different sources (like applications or services).
- Processing: This raw data is sent through the processors, which modify or filter it based on your configuration.
- Export: Finally, the processed data is exported to your observability backend for analysis.
Configuring OpenTelemetry processors involves setting them up in your OpenTelemetry SDK using a configuration file. These files define how processors interact with other OpenTelemetry components, allowing you to customize their behavior and optimize your telemetry pipeline.
How to Configure OpenTelemetry Processors
OpenTelemetry configurations are typically written in YAML or JSON format. These files specify how telemetry data flows through receivers, processors, and exporters, ensuring all components work together.
Here’s a basic example of a YAML configuration file:
service:  pipelines:    traces:      receivers: [otlp]      processors: [batch, spanfilter]      exporters: [logging]
processors:  batch:    timeout: 5s    send_batch_size: 100
  spanfilter:    include:      - span_name: "http.request"
exporters:  logging:    loglevel: "debug"
Key Sections of Configuration Files
- Service: Defines the pipelines for processing and exporting telemetry data. This section specifies which receivers collect data, which processors modify it, and where the data is sent.
- Pipelines: Organized under the service section, pipelines define the data flow for traces, metrics, and logs. Each pipeline includes a combination of receivers, processors, and exporters.
- Processors: This section lists the processors that modify telemetry data before exporting it. Each processor has configurable options, such as batch size or filtering conditions.
Components in Processor Configuration
- Receivers: These collect telemetry data from sources (e.g., OTLP receiver for OpenTelemetry Protocol).
- Processors: Modify telemetry data before it’s exported. For example:
- A Batch Processor controls batch sizes and timeouts.
- A SpanFilter Processor filters traces based on span names or attributes.
- Exporters: Define where processed data is sent (e.g., Jaeger, Prometheus, logging systems).
- Additional Components: Depending on your setup, you may also configure samplers (to control trace sampling rates) and resource processors (to enrich telemetry data with contextual information).
Discover how to extend OpenTelemetry capabilities with the OpenTelemetry Collector Contrib in our full Collector Contrib guide.
Best Practices for Configuring OpenTelemetry Processors
Organizing Configuration Files
Keeping your OpenTelemetry configuration files well-structured ensures clarity and maintainability. Here are some best practices:
- Use Modular Configuration Files: As your project grows, consider breaking configurations into smaller, modular files. For example, separate tracing, metrics, and logs into individual files and import them into a central configuration.
Example:
imports: - traces.yaml - metrics.yaml - logs.yaml- Use Clear Naming Conventions: Descriptive names for pipelines and processors help teams understand their purpose, making scaling and modifications easier.
- Add Comments for Clarity: Since configurations can get complex, include comments to explain key sections, especially for team collaboration.
- Set Sensible Default Values: Specify only necessary changes to keep your configuration clean and manageable.
Practical Examples of Processor Configurations
Here’s how you can configure some commonly used processors:
Batch Processor Example
This configuration ensures efficient network usage by grouping telemetry data into batches before sending it.
processors: batch: timeout: 10s send_batch_size: 200When to use: Ideal for high-throughput systems to optimize network calls and reduce latency.
SpanFilter Processor Example
This processor helps filter trace spans based on specific criteria.
processors: spanfilter: include: - span_name: "http.request" exclude: - span_name: "internal.system"When to use: Useful for focusing on user-facing interactions while ignoring internal system processes.
See how OpenTelemetry events can enhance your observability in our detailed guide to the role of OpenTelemetry events.
When to Use Processors in Your OpenTelemetry Setup
Processors play a key role in refining telemetry data, but not every setup requires extensive processing. Consider adding processors when:
- Reducing Data Volume: Use batch processing or filters to send only essential data.
- Modifying Telemetry: Customize traces, logs, or metrics by adding attributes or altering names.
- Enforcing Consistency: Maintain uniform formatting across different telemetry sources.
- Improving Performance: Optimize resource usage with processors like batch processing.
Data Sampling Methods in OpenTelemetry Processors
As your system scales, managing the volume of telemetry data becomes crucial. Without proper data sampling, you risk overwhelming your observability platform, leading to performance issues or high costs.
OpenTelemetry provides different sampling techniques to selectively reduce the data being sent for processing, ensuring that you capture meaningful insights while minimizing overhead.
In this section, we’ll explore the main sampling methods in OpenTelemetry: Probabilistic Sampling, Tail-Based Sampling, and Rate-Limiting Sampling. Each method serves different needs, and understanding when and how to use them will help optimize your telemetry data collection.
1. Probabilistic Sampling
Probabilistic sampling is a common technique for handling high-volume trace data. It works by randomly selecting a subset of traces based on a predefined probability.
How it works:
- A sampling rate is defined (e.g., 1% or 10%).
- Each trace is assigned a random value between 0 and 1.
- If the value is below the sampling rate, the trace is recorded and sent; otherwise, it is discarded.
Example: With a 10% sampling rate, 1 out of every 10 traces will be sent to the observability platform.
When to use:
Use probabilistic sampling when you want a general view of your system’s behavior without overwhelming your storage or processing capabilities. It’s useful in steady traffic situations where you don’t need to capture every single event.
Pros:
- Reduces the data load.
- Simple to implement and configure.
Cons:
- May miss rare but important events.
- Lack of granularity in capturing burst traffic or variability.
Check out our guide on OpenTelemetry metrics to learn how they can improve your monitoring strategy.
2. Tail-Based Sampling
Tail-based sampling focuses on capturing the “tail” of the latency distribution, prioritizing traces from slow or high-latency operations.
How it works:
- After traces are completed, the system evaluates their characteristics (e.g., trace duration, latency threshold, or specific error conditions).
- Only traces that meet certain criteria (e.g., latency above 1 second or involving errors) are retained.
Example: If you set a latency threshold of 1 second, only traces taking longer than that would be kept.
When to use:
Tail-based sampling is useful when performance or error rates are more important than capturing every event. It’s particularly effective for diagnosing performance bottlenecks or identifying critical issues in your system.
Pros:
- Focuses on high-latency or error-prone transactions.
- Helps identify impactful performance issues.
Cons:
- Adds complexity due to tracking additional metrics like latency.
- May introduce latency in deciding which traces to sample.
3. Rate-Limiting Sampling
Rate-limiting sampling is a method to set an upper limit on the number of traces sent to the backend within a specific time frame.
How it works:
- Rate-limiting is typically combined with other sampling techniques (e.g., probabilistic or tail-based).
- Once the trace limit is reached, additional traces are discarded.
When to use:
Rate-limiting is ideal when traffic surges are unpredictable. It helps ensure that your observability system isn’t overloaded during high-load periods.
Pros:
- Prevents overloading the observability system.
- Useful during traffic spikes.
Cons:
- May discard useful data during peak periods.
4. Comparison of Sampling Techniques
| Technique | Use Case | Pros | Cons |
|---|---|---|---|
| Probabilistic Sampling | General system overview | Simple, reduces data load | May miss rare events, not focused on performance |
| Tail-Based Sampling | Performance optimization, error-prone transactions | Focuses on critical data, better for debugging | Increased complexity, potential latency overhead |
| Rate-Limiting Sampling | Preventing overload during traffic spikes | Prevents system overload | May discard useful data during peak periods |
Data Scrubbing and Filtering in OpenTelemetry
Managing telemetry data effectively is critical in large-scale distributed systems. Not all data is equally useful, and some data can be sensitive or irrelevant.
Data scrubbing and filtering help optimize the volume and quality of data being processed, ensuring you only keep the essential information.
1. Data Scrubbing in OpenTelemetry
Data scrubbing is the process of removing or redacting unwanted, irrelevant, or sensitive data from telemetry traces and spans before they’re sent to observability platforms. This step is crucial for protecting privacy and meeting compliance standards, especially in industries like healthcare or finance.
How Data Scrubbing Works:
- Redacting Sensitive Information: PII (personally identifiable information) such as user names, credit card numbers, or any other personal data are masked or removed from traces.
- Removing Unnecessary Metadata: Extra internal data or debugging details that aren’t essential for most use cases are scrubbed out.
For example, you might scrub headers with personal user information or unnecessary internal metadata from traces.
For more insights on OpenTelemetry Protocol (OTLP) and its role in telemetry data collection, take a look at our post on how OTLP transmits telemetry data.
2. Span Filtering in OpenTelemetry Processors
Span filtering is an advanced technique in OpenTelemetry that enables you to include or exclude traces based on specific attributes. This helps in optimizing your observability pipeline, ensuring only the most relevant data is processed and sent to the backend.
How Span Filtering Works: You define rules to filter spans based on criteria like:
- Span Names: Filter traces by operation name (e.g., GET /api/user).
- Attributes: Filter by attributes such as HTTP status codes, error flags, or custom attributes.
- Status: Focus on spans with specific status values, such as error status.
Example of Span Filtering Configuration:
processors: spanfilter: include: - span_name: "http.request" attributes: http.status_code: 500 exclude: - span_name: "internal.system" attributes: http.status_code: 200This configuration includes traces of HTTP requests that resulted in 500 errors while excluding internal system traces with 200 status codes.
3. Types of Span Filters
There are two primary types of span filters: include and exclude filters. Both can be combined for more granular control.
- Include Filters: Only spans that match specific criteria will be included.
processors: spanfilter: include: - span_name: "database.query" attributes: http.method: "POST"- Exclude Filters: Spans matching specific conditions will be excluded.
processors: spanfilter: exclude: - span_name: "health.check" attributes: error: "false"4. Benefits of Span Filtering
- Reduced Data Volume: Filtering unnecessary spans decreases the overall data that needs to be processed and stored.
- Improved Focus: Helps focus on important traces such as high-priority services or error-related spans.
- Better Performance: Reduces the load on observability backends by eliminating irrelevant data.
- Cost Optimization: Reduces the amount of data sent to observability platforms, potentially lowering costs.
5. Challenges and Considerations
While span filtering is beneficial, there are some challenges to consider:
- Over-filtering: Filtering too much data could result in missing critical information.
- Performance Impact: Complex filtering rules can add processing overhead.
- Dynamic Filters: Some environments might require dynamic filtering based on real-time conditions, which requires more advanced configurations.
If you want to know about how OpenTelemetry stacks up against traditional APM tools? Check out our blog for a detailed comparison of OpenTelemetry vs traditional APM tools.
What is Custom Tagging in OpenTelemetry?
Custom tagging in OpenTelemetry allows you to enrich telemetry data with additional context specific to your application or environment.
Custom tags are typically added as key-value pairs to spans, which are individual units of work in your traces. This extra metadata helps you track specific user interactions, and services, or even pinpoint performance issues or errors.
1. Why Use Custom Tags?
Custom tags offer several key benefits:
- Contextual Information: Tags allow you to add relevant context to your traces, helping you to diagnose performance issues or failures linked to specific users, services, or components.
- Improved Searchability: By tagging traces with specific identifiers like
user_idorsession_id, you can more easily track user journeys and other critical metrics. - Enhanced Observability: Tags give you a richer view of your system’s performance and behavior, making it easier to pinpoint areas that need attention.
2. Implementing Custom Tagging for Traces
OpenTelemetry lets you add custom tags (referred to as “attributes”) to spans. These key-value pairs provide additional context to each span’s execution. Here’s an example of how you might add custom tags using OpenTelemetry SDKs.
Example in Python:
from opentelemetry import trace
# Get tracertracer = trace.get_tracer(__name__)
# Start a new span with custom tagswith tracer.start_as_current_span("my-span") as span:    span.set_attribute("user_id", "12345")    span.set_attribute("transaction_id", "abc-xyz")    span.set_attribute("environment", "production")    # Your application logic here
In this example, the custom tags user_id, transaction_id, and environment are attached to the span to provide context about the user, transaction, and environment.
Attributes vs. Tags
In OpenTelemetry, tags are technically called attributes. While “tags” and “attributes” are often used interchangeably, they refer to the same thing when discussing OpenTelemetry.
3. Custom Tagging with OpenTelemetry Collector
The OpenTelemetry Collector allows you to modify and enrich telemetry data globally, without needing to alter your application code. You can apply custom tags to spans or metrics within the Collector, which simplifies managing and centralizing your telemetry data across services.
Example Collector Configuration:
processors:  attributes:    actions:      - key: "user_id"        value: "12345"        action: insert      - key: "transaction_id"        value: "abc-xyz"        action: insert      - key: "environment"        value: "production"        action: insert
service:  pipelines:    traces:      processors: [attributes]      receivers: [otlp]
This configuration applies the custom tags user_id, transaction_id, and environment to all spans passing through the OpenTelemetry Collector before they are exported to your observability backend.
If you’re looking to optimize your OpenTelemetry setup with filtering, sampling, and enrichment, check out our full guide.
Benefits of Using the Collector for Custom Tagging:
- Centralized Tagging: Apply tags across all services without modifying the code for each application.
- Consistency: Ensure that tags are applied uniformly across services for better correlation.
- Decoupling: Separate application logic from telemetry data management, making it easier to modify tags without changing your code.
4. Use Cases for Custom Tagging
Here are a few practical scenarios where custom tagging can be beneficial:
- User-Related Tags: Use
user_idorsession_idto track a specific user’s interactions or sessions.
processors: attributes: actions: - key: "user_id" value: "dynamic_user_id" action: insert- Service or Environment Tags: Add
service_name,environment, orversionto categorize traces by service or environment.
processors: attributes: actions: - key: "service_name" value: "payment-service" action: insert- Error and Performance Tags: Add tags like
error_typeorresponse_timeto track performance bottlenecks or specific errors.
span.set_attribute("query_duration", 500) # in milliseconds- Custom Business Metrics: Tag traces with business-specific identifiers like
order_idorproduct_idto correlate system performance with business outcomes.
processors: attributes: actions: - key: "order_value" value: "1000" action: insertConclusion
OpenTelemetry processors are essential tools that give you fine-grained control over your observability data pipeline. They help you filter, modify, and manage the data before it reaches your backend systems, ensuring that only the relevant and useful data is sent.
And if you’re looking to chat more about OpenTelemetry, come join us on Discord! We’ve got a channel where you can connect with other developers and share your use cases. We’d love to see you there!

