

In modern IT systems-distributed services, cloud-native platforms, and dynamic networks-just knowing that something is “up” isn’t enough. Green checkmarks on dashboards don’t tell you why performance shifted, why latency crept in, or why a perfectly healthy-looking service suddenly failed.
This is where the conversation around visibility and observability begins. They sound similar, but they solve very different problems.
Visibility is about confirmation: dashboards, uptime checks, resource metrics. They tell you the states you already expect to see-“is it running?”
Observability, on the other hand, is about explanation. It stitches together metrics, logs, and traces to let you ask questions you didn’t plan for. Instead of confirming the obvious, it helps uncover the unknown.
The difference shows up in the hard moments: unexplained latency spikes, performance dips that come and go, or outages where every visible dashboard still looks fine. Visibility will reassure you the system is alive. Observability will tell you why it’s struggling.
In this blog, we’ll unpack these two ideas, show how they complement each other, and explain why observability has become central to running resilient, scalable systems today.
The Core Concept: Visibility
Visibility is like a car’s dashboard-it gives you an instant view of the basics: speed, fuel, engine temperature. In IT systems, that means CPU utilization, memory consumption, network traffic, error rates, or active user counts. It’s the operational snapshot that answers: “What’s happening right now?”
For day-to-day work, that’s powerful. A disk nearing capacity shows up immediately. A sudden drop in traffic is obvious. A web server crash triggers an alert right away. Visibility helps teams stay on top of issues that cross well-defined thresholds.
To explore how metrics, events, logs, and traces work together as the building blocks of observability, see this guide.
What Traditional Visibility Looks Like
Most visibility stacks share the same building blocks:
- Monitoring tools that scrape predefined metrics like CPU, memory, or latency.
- Alerts that fire when thresholds are breached.
- Dashboards that visualize the numbers in graphs and status indicators.
- Logs that provide a record of events, often reviewed after something has gone wrong.
Think of it as a cockpit full of gauges-each showing a narrow but important slice of system health.
Where Visibility Works
In predictable setups-like a monolithic web app backed by a single database-this is often enough. If a server goes down, or traffic suddenly dips, visibility tools make it obvious and allow for quick response.
Where Visibility Has Limits
As systems become more dynamic and interconnected, visibility alone doesn’t always tell the full story.
- Metrics in isolation can look fine. A checkout service might feel slow to users even if CPU, memory, and error rates are all normal. The issue could be tied to a dependency or a chain of interactions that metrics don’t capture.
- It focuses on symptoms, not causes. Visibility shows what is happening but doesn’t explain why.
- Cloud-native patterns add complexity. With Kubernetes pods or serverless functions starting and stopping constantly, static thresholds are harder to rely on.
- It’s reactive. Visibility reflects the present moment. It’s less about anticipating problems, more about confirming current conditions.
In other words, visibility is a strong foundation-it tells you when something looks different. But understanding why it changed often requires going beyond visibility into observability.
What is Observability?
Observability is your ability to understand the inner workings of a system just from the data it produces-metrics, logs, and traces. It doesn’t just confirm what is happening; it helps you figure out why it’s happening, and sometimes even gives you clues about what’s coming next.
When your system is observable, it’s instrumented to emit rich, contextual telemetry. That means you aren’t limited to predefined thresholds or dashboards-you can ask new questions about behavior as they come up, even if you didn’t know to ask them before.
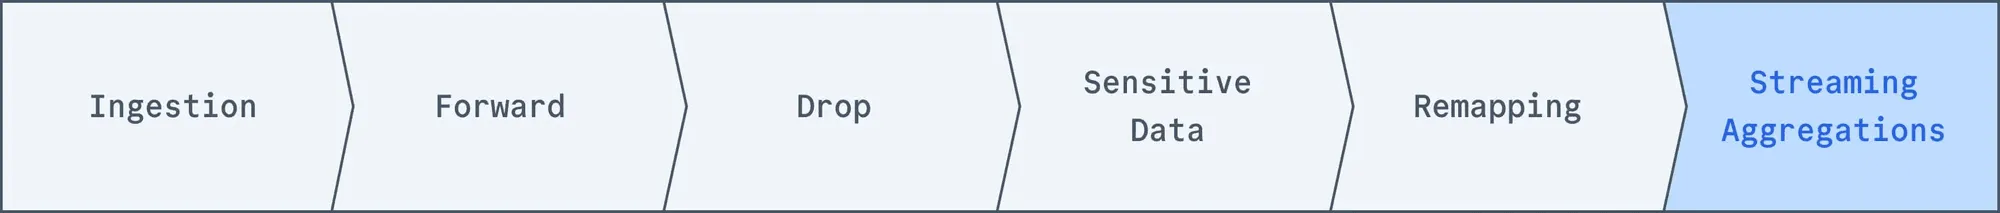
The Three Pillars of Observability
- Metrics
You already use metrics like latency, request counts, or error rates. But in an observable system, these metrics come with labels-region, API version, user ID-that let you break things down in detail. Instead of just knowing “latency is up,” you can see that it’s happening only in one geography or after a particular release. - Logs
Logs become much more useful when they’re structured and carry identifiers like service names or trace IDs. Instead of scrolling through endless text, you can connect a log entry to the trace it belongs to and the metric it triggered. This turns logs into data you can actively query and correlate. - Traces
A trace follows the journey of a single request across services. Each span records what happened-how long it took, whether an error occurred, which dependency was involved. For you, this means seeing exactly where a checkout request slowed down, or which downstream service caused a cascade of retries.
To understand how observability compares with traditional APM approaches, read this detailed comparison.
Why Observability Matters
With metrics, logs, and traces working together, you get capabilities that visibility alone can’t give you:
- Find root causes faster – You can move from “something is slow” to “this service call to the database is the culprit.”
- Tackle new problems – When unexpected failures crop up, you’re not stuck waiting for a new dashboard-you already have the context to investigate.
- Spot issues early – Patterns often surface before users complain, giving you time to act before a full outage.
- Debug in production – Instead of struggling to reproduce an issue locally, you can use telemetry to investigate what actually happened in your live system.
This way, you’re not just reacting to symptoms-you’re equipped to understand why your system behaves the way it does and make better decisions in the moment.
Observability vs. Visibility: The Scope of Questions
The distinction comes down to scope.
- Visibility works with known knowns. You monitor CPU, memory, error counts-metrics you chose ahead of time. When they breach thresholds, you know there’s a problem.
- Observability lets you explore unknown unknowns. With rich telemetry, you can ask: Why are only checkout requests in us-east-1 failing? Why did latency rise after the last deploy even though CPU is stable? Why does Service A slow down only when Service B retries a call?
Let’s consider a critical application as a black box:
- Visibility lets you watch the dials outside-uptime, CPU, request rates. If a dial spikes, you know something’s wrong, but you can’t see the inner workings.
- Observability instruments the inside. You see how requests flow, how dependencies interact, and where the failure originated. Instead of guessing, you trace the sequence of events that caused the issue.
The operational impact is just as clear:
- Visibility is reactive. It alerts you after thresholds are crossed, leaving you to piece together symptoms.
- Observability is proactive. It connects metrics, logs, and traces so you can resolve issues faster and even detect risks before users feel the pain.
Why This Difference Matters
For Cloud-Native and Distributed Systems
Cloud-native architectures don’t sit still. Microservices scale up and down in seconds, Kubernetes workloads shift constantly, and serverless functions appear and vanish on demand. On top of that, you’ve got services talking to each other across regions, clouds, and APIs. The result? A system with thousands of moving parts and countless ways to fail.
Visibility alone struggles here. Static dashboards and thresholds can’t keep pace with environments where the “normal state” changes every minute.
Observability closes that gap by giving you a transparent view of how the system actually behaves. With detailed metrics, logs, and traces, you can:
- Follow a request as it hops through multiple services and platforms.
- Investigate why a distributed transaction failed halfway across dozens of dependencies.
- Build a real-time picture of how infrastructure shifts under load, traffic spikes, or redeployments.
For DevOps and SRE Teams
If you’re running incident response, you know the difference between chasing symptoms and getting to causes. Observability helps shorten that cycle. Instead of piecing together clues from isolated dashboards, you and your team work from shared telemetry-everyone sees the same metrics, logs, and traces.
The outcomes are practical:
- Faster MTTR – Trace issues directly to the root, instead of losing time in guesswork.
- Higher reliability – Spot anomalies early, before users feel them.
- Better collaboration – Devs and ops debug together using the same data, not assumptions.
- Smarter decisions – Use telemetry trends to guide scaling, architecture changes, and performance improvements.
For Business Continuity and Customer Experience
The technical advantages of observability quickly ripple out to the business. Fewer outages mean fewer customer interruptions. Faster fixes mean performance stays consistent. And reliability builds trust-the currency every digital product depends on.
Concretely, observability supports:
- Business continuity – Outages happen, but their impact is minimized.
- Customer satisfaction – Stable, predictable services improve user confidence.
- Revenue protection – Services stay available when customers need them most.
- Brand reputation – Reliability becomes part of your company’s identity.
Getting Started in 5 Minutes
If you want to see the difference between visibility and observability without committing to a huge rollout, you can start small. Pick a service – maybe the checkout flow or your login API-and add a little instrumentation.
With OpenTelemetry, it’s often just a matter of dropping in an agent or library. For example, in Python:
pip install opentelemetry-distroopentelemetry-bootstrap -a installopentelemetry-instrument python app.pyOnce that’s running, point it at an observability backend-whether that’s Last9, Prometheus, or any platform you’re experimenting with. Fire off a test request, and you’ll start seeing traces tied to metrics and logs.
For instance, a simple login request might produce a trace that shows:
- The
webtier handled the request in5ms. - The
authservice took40ms. - A downstream
Redislookup added120ms.
On a visibility-only dashboard, you’d just see login latency = 165ms. With observability, you can follow the request across services and immediately spot that Redis was the bottleneck.
From there, you can expand at your own pace-add more services, sprinkle in custom spans, and grow your observability footprint where it helps most.
You can start by sending OpenTelemetry demo data into Last9 using this guide.
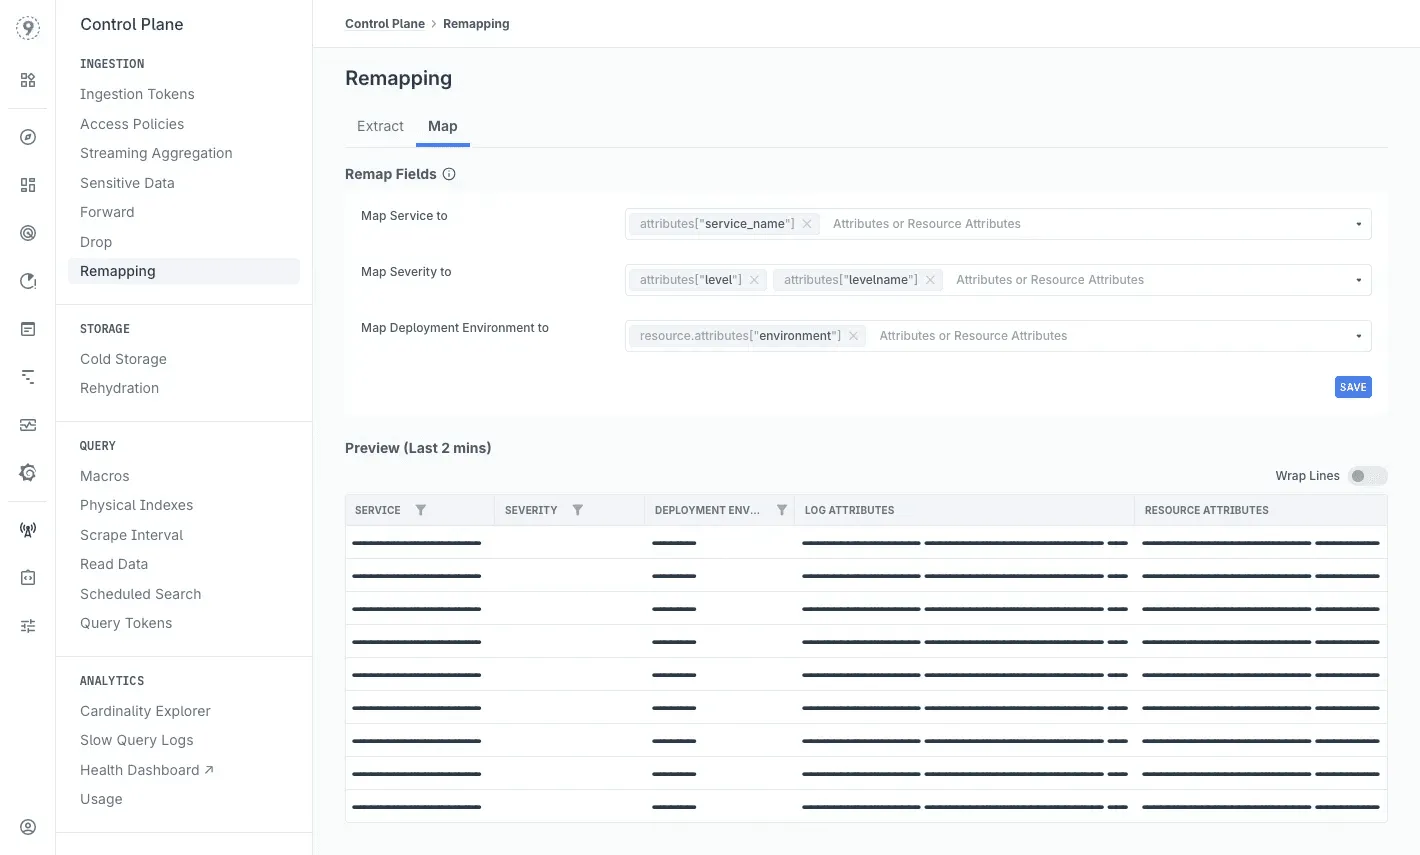
How Last9 Helps You Observe Better
Modern systems are full of moving parts. A request can pass through dozens of services, pods may spin up and down within seconds, and telemetry floods in from every corner. Last9 helps you make sense of it all by turning raw signals into context you can act on.
You can turn traces into real-time metrics (TraceMetrics) and use them like any other metric for monitoring and alerting.
- Example: instead of running a query every time you want to check “checkout success rate,” you create a metric once and track it continuously-even breaking it down by
regionorAPI version.
You get fine-grained control over what telemetry to keep, drop, or forward. This keeps data useful without overwhelming storage or your team.
Forward only error traces from a staging cluster, while dropping verbose debug logs. That way, the signals that matter don’t get buried.
Cardinality Explorer
High-cardinality labels such as user_id, region, or version often explode in scale. Last9 makes them easy to explore interactively, so you can find patterns that matter.
- Example: latency is steady overall, but Cardinality Explorer shows it’s spiking only for
v2.3users inus-west.
Logs & Traces Explorer
Metrics tell you something’s off, but combining logs and traces helps you pinpoint where. Last9 lets you jump between them without leaving context behind.
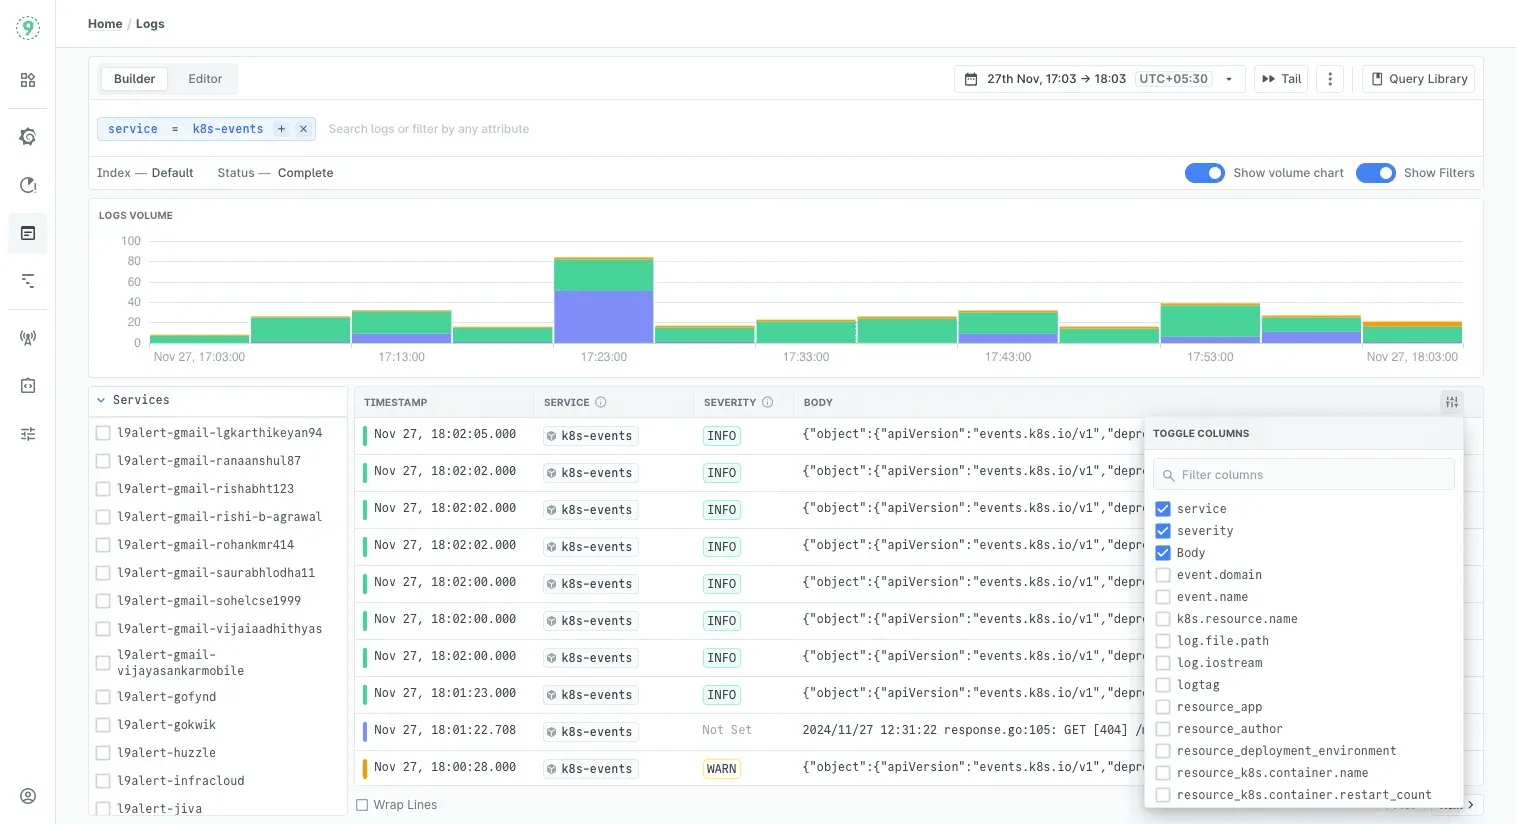
- Example: an error-rate alert leads you to a trace, which then links directly to the Redis log line that explains the failure.
With Last9, observability feels less like digging through raw data and more like following a clear trail: from metrics, to traces, to the exact service causing trouble.
Start for free today or book sometime with us to know how it fits within your stack!
FAQs
What are the three types of observability?
The “three pillars” of observability are metrics, logs, and traces.
- Metrics give aggregated, numerical views of system health over time (CPU usage, latency, error rates).
- Logs are detailed, time-stamped event records that capture discrete system activities.
- Traces follow the path of a request across distributed services, showing where time is spent and where failures occur.
Together, they provide the context needed to infer a system’s internal state and reason about unexpected behaviors.
What is the difference between monitoring and visibility?
- Monitoring is the act of collecting and displaying data about system performance, typically through predefined metrics and alerts.
- Visibility is what monitoring provides: a snapshot of the system’s current state based on those predefined indicators.
Monitoring gives you the data; visibility is the level of insight that data offers.
What’s the difference between observability and monitoring?
Monitoring answers the question: “Is something wrong?” It works with known conditions, such as thresholds for CPU or memory.
Observability answers: “Why is it happening?” It provides enough context to debug novel or unexpected issues. Monitoring is part of observability, but observability extends beyond it by enabling exploration of unknown problems.
What exactly is observability?
Observability is the ability to understand the internal state of a system by examining the telemetry it produces - metrics, logs, and traces. It enables engineers to ask new questions, investigate unknown failure modes, and troubleshoot distributed systems without needing direct access to every component.
Is observability really a separate category from network monitoring?
Yes. Network monitoring focuses on traffic flows, packet loss, throughput, and connectivity. Observability covers the full system: applications, services, dependencies, and infrastructure. Network monitoring can be part of observability, but observability is a broader category that spans all layers of a system.
Why is observability more important than ever in cloud-native and microservices architectures?
Cloud-native systems are highly dynamic: services scale up and down, fail in complex ways, and often interact across clusters or providers. Traditional visibility tools only track predefined conditions. Observability captures detailed, contextual telemetry that allows teams to:
- Trace requests across ephemeral services.
- Understand distributed transaction failures.
- Predict and prevent issues before they escalate.
Without observability, diagnosing problems in microservices architectures becomes guesswork.
Is Network Observability Different from Visibility and Monitoring?
Yes. Network observability focuses on making network behavior explainable by capturing telemetry at the packet or flow level and correlating it with higher-layer signals. Visibility and monitoring provide snapshots or alerts, but network observability explains why traffic behaves the way it does - for example, why latency is introduced at a specific hop in a service chain.
How do MantisNet solutions (specifically the CVF) compare to the latest observability tools?
MantisNet’s Continuous Visibility Fabric (CVF) emphasizes real-time packet-level visibility and programmable telemetry pipelines for network data. Compared to general observability platforms, CVF focuses more narrowly on network traffic observability. Full observability platforms (e.g., those built on OpenTelemetry) extend beyond the network, correlating metrics, logs, and traces across applications, infrastructure, and services. CVF can complement observability by enriching telemetry with detailed network-level context.
How does observability help with troubleshooting and root cause analysis in distributed systems?
Observability correlates metrics, logs, and traces to create a connected view of how requests flow through a system. This makes it possible to:
- Detect where in the request path latency or errors occur.
- Link anomalies back to the specific service, dependency, or deployment causing them.
- Move from symptoms (e.g., “service is slow”) to causes (e.g., “database connection pool exhausted”).
This reduces investigation time and improves accuracy in root cause analysis.
How do observability and visibility contribute to proactive system management?
- Visibility provides alerts when predefined thresholds are crossed, enabling teams to respond quickly to known problems.
- Observability goes further by identifying patterns, anomalies, and interdependencies that point to emerging risks.
Together, they support proactive management: visibility handles the “known knowns,” while observability exposes the “unknown unknowns.”
How do visibility and observability contribute to effective system performance management?
Visibility ensures that performance baselines are met by tracking metrics like CPU, memory, and network usage. Observability adds the ability to correlate performance issues across services, identify bottlenecks in distributed workflows, and understand how changes impact end-to-end latency or throughput. Combined, they give both a surface-level view of system health and the deeper insights needed to optimize performance.

