

If you’re trying to control observability spend without cutting visibility, the platforms that usually offer the best cost balance at enterprise scale are Last9, Grafana Cloud, Elastic, and Chronosphere - depending on the shape of your telemetry and the level of operational ownership you want.
Why Telemetry Data Grows Faster Than Infrastructure
Modern applications emit approximately 100x more telemetry than a decade ago. Netflix ingests 5 petabytes of logs daily-10.6 million events per second, peaking at 12.5 million. OpenAI processes petabytes of logs daily, with volume growing by more than 20% each month. At this scale, the observability platform can cost more than the infrastructure being monitored.
Several factors drive this growth:
Container churn in Kubernetes: Pods scale up and down constantly, with each container ID creating a new metric series. A single deployment can generate thousands of short-lived series that persist in your time-series database.
Microservice proliferation: Breaking a monolith into 50 services doesn’t create 50x the metrics-it creates exponentially more because inter-service communication, service meshes, and distributed tracing multiply data generation.
High-cardinality labels: Adding user IDs, request IDs, or container IDs to metrics creates unbounded cardinality. Engineers at Expedia Group noted that collecting custom metrics tagged by experiment ID was “out of the question, since that would be too expensive.”
Beyond cost, most legacy observability backends start to strain when the data gets richer. Memory usage climbs, indexes get heavier, and ingestion slows down during sudden increases in label combinations. In high-traffic moments-when teams depend on fast queries-one service with rapidly changing labels can push these older systems close to their limits.
Also explore how different monitoring platforms approach AI-native anomaly detection in our breakdown here!
How Datadog/New Relic Pricing Scales With Your Infrastructure
Datadog
Datadog focuses on ease of adoption. You get a polished interface, strong APM depth, and broad integration coverage. For many teams, this makes it a straightforward choice when you want full-stack visibility without managing infrastructure. The part that needs closer attention is how its pricing behaves when your system becomes more dynamic or label-heavy.
Pricing: Datadog uses a multi-SKU model. Infrastructure monitoring, APM, logs, RUM, synthetics, and custom metrics are all priced separately. Infra monitoring starts around $15–23 per host per month, but the main cost drivers show up in areas linked to dimensionality and ingest volume.
Key behaviors at scale:
- Custom metrics are billed per unique time series (~$0.05 each).
- Cost scales with metric name + label combinations, not metric names alone.
- The high-water-mark model bills you for the peak host count during the month.
- Log indexing is priced separately from ingestion.
Some real workload patterns illustrate this:
- A 200-node Kubernetes cluster with typical labels (status code, region, user agent, container ID, node) can generate ~1.8M custom metrics, adding ~$68,000/month before APM or infra charges.
- Log indexing is $1.70 per million events. A service emitting 100M events/day incurs ~$5,100/month in indexing alone.
- Scaling from 50 → 200 hosts for a single event results in being billed for 200 hosts for the entire monthly cycle.
These behaviors aren’t unexpected given the pricing model, but they are important to account for if your workloads have high churn.
Cardinality Handling: Every metric + tag combination counts as a billable series. Microservices, per-pod metrics, tenant identifiers, or version-based rollouts naturally increase these combinations.
Labels that often increase series count quickly:
- pod_name
- container_id
- customer_id or tenant identifiers
- version
- endpoint/route patterns
A monolithic workload might emit 20k time series. A large Kubernetes environment can easily reach hundreds of millions, depending on label variety and workload churn.
Datadog offers Metrics Without Limits, which allows you to drop or include specific tags. This gives you control but requires maintenance because dropped tags reduce context, and rules must be configured per metric family.
OpenTelemetry Compatibility: Datadog accepts OTLP, but OTel metric points still count as custom metrics, so the pricing behavior stays the same even if you switch instrumentation standards.
The Datadog Agent now includes OTel components, which makes hybrid or full-OTel setups easier if you’re standardizing your telemetry pipelines.
Where Datadog Fits Well
- You prefer a single, unified UI across infra, APM, logs, and RUM
- You rely on prebuilt dashboards and strong integration coverage
- You operate steady workloads without sharp host or metric churn
- You want minimal operational overhead during onboarding
What You Should Plan For
These are practical areas to monitor as your environment evolves:
- Growth in custom metrics tied to label expansion
- Series count changes during deployments or rollouts
- Autoscaling events that momentarily raise host/container count
- How logs flow through ingestion vs indexing paths
- Workloads where per-series billing grows faster than infrastructure
If you’re exploring how pricing models react to rich telemetry, this piece on Datadog’s pricing structure gives useful context!
New Relic
New Relic focuses on a unified data model and simple ingest-based pricing. If you want one platform for metrics, logs, traces, and browser/app performance with clear cost structures, it’s one of the easier systems to plan around. The part that needs some attention is how ingest volume and user licensing interact when your workload or team grows.
Pricing: New Relic uses a combination of user licensing and ingest-based billing. This simplifies cost modelling because you’re not tracking hosts, custom metrics, or container counts. You primarily monitor two variables: who needs full access, and how much data you’re sending.
Key details:
- Full Platform Users are billed per seat
- Basic Users are free (read-only access)
- Ingest includes 100GB/month free
- After that, logs are billed per GB and metrics/traces have separate per-GB rates
- No host fees
- No custom metric charges
This approach works well if only part of your team needs full analytical or querying capability. But if many developers engage in production debugging, full-seat counts can grow quickly and represent a significant part of total spend.
A few real-world patterns:
- Full Platform Users on Pro tier are ~$349/user/month annually
- For teams where only SREs need deep access, seat usage stays low
- For teams where 10–20 engineers participate in on-call, user licensing becomes a substantial share of spend
- Ingest-driven billing can rise sharply if a new integration increases event or trace volume unexpectedly - one team saw costs move from $900 → $8,000/month after a change increased logs per request
These patterns aren’t specific to New Relic - they reflect what happens when you rely heavily on ingest-volume pricing or broad developer access.
Cardinality Handling: New Relic’s NRDB database handles high-cardinality datasets well. Because pricing is by ingest volume rather than the number of time series, you can send detailed metrics with many attributes without worrying about per-series penalties.
Useful properties:
- Complex label sets don’t increase cost directly
- Multi-tenant or high-churn workloads don’t create “metric explosion” bills
- You can keep identifiers like customer, pod, version, or region without trimming labels
OpenTelemetry Compatibility: New Relic supports OTLP across metrics, logs, and traces. You can run a full OTel pipeline and forward everything to Endpoint URLs without rewriting instrumentation.
Notes:
- Auto-instrumentation covers most languages and frameworks
- OTel spans and metrics map cleanly into NRDB
- OTel setup reduces friction if you’re evaluating multiple backends in parallel
Where New Relic Fits Well
- You want predictable per-GB billing
- You need long retention out of the box
- You prefer one query language (NRQL) for all telemetry types
- Your debugging model involves a smaller number of full-access users
- You want to avoid metric-based or host-based pricing entirely
What You Should Plan For
Useful considerations as your environment expands:
- Ingest volume increases during new releases or instrumentation changes
- User-seat cost if many engineers require full query/debugging access
- Tracing or logging bursts during traffic spikes
- Understanding NRQL for deeper analysis
6 Platform Alternatives Built for Different Cost Models
Last9
Last9 is built for teams adopting OpenTelemetry and running workloads where metric richness - not just metric volume - matters. If you want predictable pricing, full OTel compatibility, and a backend designed to store high-cardinality signals without label trimming, Last9 fits well.
Pricing: Last9 uses a usage-based, event-centric model. Cost isn’t tied to hosts, containers, or custom metric counts, so you don’t have to monitor series inflation or budget for tag growth.
You get:
- Event-based pricing
- No host or container fees
- No custom metric penalties
- Deployment via AWS/GCP Marketplace for commit efficiency
- Predictable cost behavior during scale-ups or frequent deployments
If you run Kubernetes or systems with high churn, this helps you avoid cost swings as your pod or container count changes.
Cardinality Handling: This is where Last9 stands out. Our platform uses a time-series database designed to store and query high-cardinality telemetry without forcing you to restrict labels. Instead of maintaining custom indexing rules or trimming metadata, you can keep the full shape of your telemetry.
You can expect:
- A time-series engine optimized for rich labels and dimensional data
- Streaming aggregation to reduce noise while keeping context intact
- No need to preselect which labels to store
- Fast queries even with pod-level or version-level tags
- Stable performance as your systems introduce new attributes or dimensions
If you’ve had to drop pod_name, container_id, or customer_id labels for cost reasons in other tools, Last9 removes that trade-off.
Last9 removed the toil of setting up scalable, high cardinality monitoring-letting us focus on serving our users, not our dashboards.”
- Ashish Garg, CTO, Probo
Storage and Retention: Last9’s storage layer is engineered for telemetry workloads: metrics, traces, logs, and events. It’s optimized for fast reads and efficient retention without requiring you to manage tiering or indexing strategies.
You get:
- A time-series database built for observability signals
- Efficient storage for high-cardinality metrics
- Long-term retention without steep pricing jumps
- Support for multi-cluster and multi-region environments
This works well if you want both fast troubleshooting and durable historical data.
OpenTelemetry Compatibility: Last9 is fully OTel-native. All pipelines - metrics, logs, and traces - flow through OTLP, and the platform is built around OTel semantic conventions.
You can:
- Send OTLP directly from any service
- Run pipelines through the OTel Collector
- Combine auto-instrumented and manually instrumented services
- Maintain portability across vendors without rewriting instrumentation
If your org is standardizing on OTel, the integration is effortless.
Where Last9 Fits Well for You
- You want a predictable cost even when the label cardinality grows
- You rely on OpenTelemetry or are migrating toward it
- You need high-cardinality metrics without tuning or trimming
- You want logs, metrics, and traces in one place without per-feature pricing
- Your workloads are multi-cluster, multi-tenant, or high-churn
- You prefer a backend that adapts to your telemetry rather than the other way around
What You Should Plan For
Moving toward an OTel-first workflow comes with a bit of housekeeping that helps everything stay consistent and easier to query later. A few things worth planning:
- Aligning metric names and conventions across existing dashboards
- Understanding how dynamic or streaming aggregation trims noisy dimensions
- Helping teams shift from vendor-specific agents to an OTel mindset
- Mapping current telemetry fields to OTel semantic conventions
- Planning routing if you want to send data to multiple backends
Grafana Cloud
Grafana Cloud is a good fit if you want the flexibility of Prometheus, Loki, Tempo, and Mimir without running them yourself. You get a managed version of the same OSS components you may already use, and you can always move to self-hosted deployments later if your requirements change. This gives you room to scale without locking yourself into one operational path.
Pricing: Grafana Cloud uses a small platform fee plus usage-based billing. As your environment grows, this model tracks the data you actually generate instead of charging per host or per agent.
Here’s what you get across tiers:
Free tier
- ~50GB combined logs + traces
- 10,000 active metric series
- 14-day retention
- Useful when you’re evaluating or running low-volume workloads
Pro tier (starts at ~$19/month + usage)
- Metrics: $6.50 per 1,000 active series
- Logs & Traces: $0.50/GB ingested
- Higher retention options
- Includes team features and more control
Because billing follows active series, you can estimate cost fairly precisely. If you already know your Prometheus series footprint, you can model Grafana Cloud spend quickly.
Cardinality Handling: Mimir, the metrics backend behind Grafana Cloud, is built for high-cardinality workloads. If you run Kubernetes, multi-cluster, or tenant-heavy systems, you’ll notice that it handles label-rich metrics without the need to trim tags aggressively.
You can expect:
- Stable performance even with pod-level or container-level labels
- Support for large series counts (hundreds of millions in the underlying architecture)
- Adaptive Metrics to help you reduce unnecessary series automatically
- The option to manage relabeling, scrape rules, or metric aggregation when you want tighter control
If you’re familiar with Prometheus or Thanos, the behavior feels familiar but with much less operational oversight.
Storage and Retention: Grafana Cloud uses object-storage-backed systems across signals:
- Metrics: often 13 months in paid tiers
- Logs: configurable retention, with the ability to send older logs to S3/GCS
- Traces: ~30 days by default (varies by plan)
- Storage formats match OSS Mimir, Loki, and Tempo block/chunk layouts
This means you can move data between managed and self-hosted seamlessly, or shift to a hybrid model if your organization requires it.
OpenTelemetry Compatibility: Grafana Cloud works well with OTel. You can:
- Send OTLP directly into Grafana Agent, Tempo, or Loki
- Use the OTel Collector as your primary pipeline and export to Grafana endpoints
- Mix OTel metrics with native Prometheus metrics
- Keep your instrumentation portable if you ever evaluate other backends
If you’re standardizing on OpenTelemetry, you won’t need to change much to adopt Grafana Cloud.
Where Grafana Cloud Fits Well
- You want clear, usage-based pricing tied to active series and ingestion volume
- You run systems where labels matter, and you prefer not to trim them
- You want OSS-native technology but don’t want to maintain Mimir/Loki/Tempo yourself
- You’re planning for future flexibility, including the option to switch between managed and self-hosted
- You rely heavily on PromQL or LogQL for debugging and analysis
What You Should Plan For
- Active series counts can rise quickly with pod-level labels or tenant identifiers
- PromQL or LogQL expertise helps you use the platform effectively
- You may want to configure relabeling or aggregation rules during scale-ups
- Log-heavy workloads can still create meaningful ingestion costs
- Multi-cluster setups require awareness of how scrape intervals and service discovery affect series churn
For a deeper look at setting up a tracing pipeline, we have covered everything in our guide on configuring Grafana Tempo!
Dynatrace
Dynatrace is built for teams that want an observability system that automatically maps services, tracks dependencies across layers, and surfaces issues without much manual tuning. If you prefer a hands-off model where instrumentation, discovery, baselining, and anomaly detection operate with minimal intervention from you, Dynatrace tends to fit that profile.
Pricing: Dynatrace uses DDUs (Davis Data Units) to unify cost across metrics, logs, traces, and events. Instead of paying per host or per custom metric, you pay for usage across several telemetry types. This removes the need for series-count planning or tag-based filtering.
What this means in practice:
- You don’t pay per custom metric, so label-heavy metrics don’t add separate costs
- You don’t track host counts, making cost modelling easier for auto-scaling clusters
- You consume DDUs for metrics, logs, traces, synthetic tests, RUM sessions, and events
- The DDU budget can rise or fall depending on how much telemetry your systems generate
If you operate large Kubernetes or serverless environments, this model often feels simpler than managing metric quotas or per-agent pricing.
Cardinality Handling: Dynatrace handles high-cardinality datasets through Grail, its underlying lakehouse engine. You don’t configure indexing rules manually, and you don’t choose which tags to keep or drop.
You get:
- Automatic handling of large label sets
- No manual index management
- Consistent performance even with pod-level or tenant identifiers
- Built-in baselining that adapts to new dimensions as they appear
If your deployments are frequent and labels change often, Grail absorbs that churn without requiring you to reconfigure anything.
Storage and Retention: Grail acts as a unified storage layer for logs, metrics, traces, events, and dependency data. You don’t manage hot/warm tiers, index templates, or retention layers yourself.
You typically see:
- High-resolution metrics without pre-aggregation rules
- Long-term retention depends on your plan
- Automatic data lifecycle management
- Fast query performance across mixed signals
This setup works well if you don’t want to operate multiple backends or think about storage patterns.
OpenTelemetry Compatibility: Dynatrace supports OTel ingestion, so you can send metrics, logs, and traces using the OTel Collector or OTLP exporters. That said, OneAgent is still the primary path for automated instrumentation and full dependency mapping.
You can:
- Send OTLP data directly to Dynatrace endpoints
- Combine OneAgent instrumentation with OTel-based services
- Use the Collector for controlled routing, batching, or transformations
If you’re standardizing on OTel, Dynatrace works, but you’ll get the most automation when at least part of your stack uses OneAgent.
Where Dynatrace Fits Well for You
- You want automatic service discovery and topology mapping
- You prefer RCA engines that surface issues instead of building queries yourself
- You have large, complex systems where manual configuration is time-consuming
- You don’t want to manage indexing, label rules, or data tiering
- You’re comfortable with an opinionated all-in-one platform
What You Should Plan For
- Dynatrace tends to sit at the premium end of pricing
- You’ll benefit from understanding the OneAgent + Grail + Davis AI model
- Your success depends on how well OneAgent integrates with your stack
- DDUs are simple to track, but you’ll still want dashboards showing where telemetry volume grows
- Large log or trace ingestion bursts can consume DDUs faster than expected
Elastic Observability
Elastic is a natural fit when logs are your dominant signal, and you need strong search, flexible indexing, and the ability to tune storage costs yourself. If you already rely on Elasticsearch for logs or search workloads, Elastic Observability gives you a unified way to bring metrics and traces into the same pipeline.
Pricing: Elastic gives you two clear pricing paths, and your choice depends on how much operational responsibility you want:
Elastic Cloud (managed)
- You pay for ingest GB and storage GB
- No host or per-metric fees
- Upgrades and scaling handled for you
- Good balance if you want managed ops but still need cost control
Self-hosted
- You pay only for the compute, storage, and network you use
- Can be highly cost-efficient for large log or event volumes
- You manage scaling, snapshots, and cluster lifecycle
- Often chosen for compliance or predictable, large-scale log pipelines
If your logs grow faster than metrics or traces, Elastic’s pricing model tends to scale well because you’re paying mainly for volume, not series count.
Cardinality Handling: Elasticsearch can store high-cardinality fields, but your indexing strategy dictates storage footprint and query performance.
You can tune cost and performance using:
- Selective indexing (index only the fields you need fast queries on)
- Index Lifecycle Management (ILM) for automatic movement from hot → warm → cold tiers
- Runtime fields when you need flexible querying without fully indexing new fields
- Data streams to consolidate rolling daily indexes
If your workload has very detailed logs or many custom attributes, Elastic gives you more control over how much of that detail gets indexed.
Storage and Retention: Elastic’s storage architecture is built for long-term log and event retention:
- Hot, warm, and cold tiers backed by cost-appropriate storage
- Cold and frozen tiers backed by S3/Glacier for cost-efficient archiving
- Snapshot-based recovery
- Ability to store logs for months or years without high ongoing cost
If you need long retention windows for audits, compliance, or slow-moving incidents, Elastic is one of the easier platforms to tune.
OpenTelemetry Compatibility: Elastic works smoothly with OTel:
- You can ingest OTLP logs, metrics, and traces
- OTel Collector → Elasticsearch is a common pattern
- Transform and enrich at the Collector layer before indexing
- Good choice if you want to keep OTel as your instrumentation standard and Elasticsearch as your log backend
If you prefer to run everything through OTel pipelines, Elastic integrates cleanly without needing proprietary agents.
Where Elastic Fits Well for You
- Your workloads are log-heavy
- You need a full-text search across large datasets
- You want control over index design and retention
- You already use Elasticsearch operationally and want to expand into metrics/traces
- You want optionality between managed and self-hosted
What You Should Plan For
- Index template design can get complex as your schema grows
- Self-hosted clusters require operational experience (sharding, ILM, snapshot policies)
- Ingest volume can grow faster than expected when logs are verbose
- Query performance varies based on index mapping and shard layout
- You’ll need consistent indexing discipline to avoid fragmentation
For ideas on reducing logging costs without compromising on what matters during debugging or incident mitigation, this post is worth a read!
Chronosphere
Chronosphere is built for environments where metric volume grows quickly, and you want tight control over what gets stored. If your Kubernetes clusters emit a large number of series or you have many teams instrumenting independently, Chronosphere gives you a way to centralize decisions about aggregation, retention, and label behavior without slowing teams down.
Pricing: Chronosphere uses a store-what-you-keep model. Instead of charging for all ingested metrics, you only pay for what you retain after applying aggregation rules.
This has a few practical outcomes:
- If your workloads generate noisy or high-dimensional metrics, you can drop or aggregate early.
- You don’t pay for every time series created during bursts or deployments - only the series that pass your storage policies.
- Cost becomes more predictable because it depends on what your organization decides to keep, not what the system emits in real time.
This model works well if you want a central telemetry control plane without changing application instrumentation.
Cardinality Handling: Chronosphere uses M3DB, a metrics backend designed to handle extremely large series footprints - tens of billions of active series in some deployments.
You get:
- Room for high-cardinality labels like pod, container, version, or tenant
- A control layer where you create rules to aggregate, relabel, or drop series
- The ability to enforce consistency across teams so your metrics stay stable
- A workflow where developers can instrument freely, and the platform team shapes the final stored dataset
If you’ve struggled with metric explosion in fast-moving environments, the control-plane model is one of Chronosphere’s core strengths.
Storage and Retention: Chronosphere focuses heavily on metrics, and the backend is engineered for large-scale production workloads:
- High-throughput writes using M3DB
- Optimized storage for long-lived metrics
- Support for distributed tracing via a Tempo-like backend
- Logs aren’t stored natively - you’ll integrate a separate log solution if logs are a primary signal for you
The product is intentionally metric-first, so if logs or events are your main signals, you’ll likely use Chronosphere alongside a dedicated log backend.
OpenTelemetry Compatibility: Chronosphere works cleanly with OTel pipelines. You can:
- Use the OTel Collector to route metrics, traces, and metadata
- Apply processors before exporting to Chronosphere
- Combine native Prometheus instrumentation with OTel-based workloads
- Centralize all aggregation logic in the control plane instead of relying on per-service scraping tweaks
If your goal is to standardize on OTel while keeping strong control over metrics, Chronosphere fits that pattern.
Where Chronosphere Fits Well for You
- You want enterprise-grade control over which metrics are kept or aggregated
- You manage large, noisy, or fast-changing metric workloads
- You prefer a strong control plane instead of per-team Prometheus tuning
- You want a way to limit cost without asking engineers to change instrumentation
- You’re operating multi-cluster or multi-tenant systems where the series count can rise quickly
What You Should Plan For
- Chronosphere is metrics-first, so you’ll use another tool for logs
- You’ll spend time learning the aggregation and control-plane model
- Tracing support is solid, but logs require a separate backend
- Aggregation strategy benefits from alignment between platform and application teams
- You’ll want dashboards that show what’s being kept vs dropped so teams understand the rules
Lightstep
Lightstep focuses on distributed tracing at scale with a strong emphasis on correlation, service health, and workflow-centric debugging. If you rely heavily on traces and want a platform that helps you understand cross-service behavior without manually stitching context together, Lightstep is built around that workflow. It’s particularly useful when your incidents often require you to follow requests across many services or when you need clarity on latency contributors.
Pricing: Lightstep uses a usage-based model, where you pay for spans ingested along with additional features based on tier. This aligns cost with tracing volume rather than hosts or metrics. If your services emit detailed spans or you use tail-based sampling, span volume will be your main sizing factor.
What this typically means for you:
- Pricing is tied to spans ingested, not custom metrics or host count
- You often use sampling controls to manage spend
- Volume grows with deeper instrumentation or high-traffic workloads
- Cost transparency is good because volume patterns are straightforward to track
Lightstep tends to fit well if traces are your primary data source and you want to budget based on span throughput.
Cardinality Handling: Lightstep handles high-cardinality trace attributes reliably. Since spans contain attributes by design, the platform expects high dimensionality and doesn’t require you to trim or prefilter attributes to control cost.
You can expect:
- Smooth handling of attribute-rich spans
- Good support for a large number of services and dependencies
- Strong correlation features across attributes, services, and deployments
- No need to maintain index rules for labels or fields
If you rely on traces to debug latency paths, Lightstep is comfortable with detailed span attributes.
Storage and Retention: Lightstep is primarily a tracing-first platform, but it supports metrics and logs (via integrations) to give you context during investigations.
- You get service-level insights built on trace data
- Retention depends on the plan and span volume
- You can use tail-based sampling to control what gets stored
- Longer retention is available with tiered pricing
- Metrics are stored in a lightweight, high-resolution format tied to service behavior
If tracing is central to your debugging, Lightstep gives you strong retention and query tools specifically tuned for spans.
OpenTelemetry Compatibility: Lightstep has been one of the earliest adopters of OpenTelemetry. It works cleanly with OTel Collector pipelines and expects OTLP as the primary interface.
You can:
- Send OTLP spans, metrics, and logs
- Use OTel Collector for routing and sampling
- Combine auto-instrumentation + custom instrumentation easily
- Apply tail-based sampling rules in the Collector or Lightstep pipeline
If you’re standardizing on OTel, Lightstep is one of the easiest platforms to integrate with.
Where Lightstep Fits Well for You
- You rely heavily on distributed tracing for debugging
- Your incidents often involve cross-service latency or unknown dependency paths
- You want tools that highlight which service or attribute is contributing to slowdowns
- You prefer deep correlation over general-purpose dashboards
- You’re already instrumented with OpenTelemetry
What You Should Plan For
- Span ingestion volume directly affects spend
- You may want to use Collector-based tail sampling to tune cost
- Metrics/logs are supported, but tracing is the strongest pillar
- If logs are a key signal for you, you might still want a dedicated log backend
- Retention varies by plan, so longer-term trace history may require configuration
If you work with Ruby, check out our comparison of Ruby APM tools here!
The Role of Opentelemetry in Reducing Switching Costs
OpenTelemetry is the second most active CNCF project after Kubernetes, with 10,000 contributors from 1,200 companies. 48.5% of IT organizations have adopted OTel, with another 25% planning implementation.
The strategic value is straightforward: instrument once with OpenTelemetry SDKs, route telemetry through the OTel Collector, then export to any compatible backend.
Migrating from Datadog to Grafana Cloud, Honeycomb, or Last9 becomes a configuration change rather than re-instrumenting every service. For organizations that reduced observability costs with OpenTelemetry, 84% report at least a 10% decrease in costs.
The Collector’s preprocessing capabilities matter for cost control. Tail-based sampling, attribute filtering, and metric aggregation happen before data reaches expensive storage. A properly configured Collector can reduce trace volume by 80-90% while capturing 100% of errors and high-latency requests:
processors:  tail_sampling:    decision_wait: 10s    policies:      - name: errors-policy        type: status_code        status_code: ERROR
      - name: latency-policy        type: latency        latency:          threshold_ms: 500
      - name: probability-sampler        type: probabilistic        sampling_percentage: 10
For teams evaluating platforms, OTel compatibility is now table stakes. Any observability vendor that can’t accept native OTel ingestion is building lock-in instead of helping teams manage cost.
If you’re building an observability stack with OpenTelemetry, our full OTel guide is a great starting point.
What Helps You Control Cost While Keeping Telemetry Useful
You don’t need to remove detail or avoid rich labels. The goal is simply to make sure the signals you collect match the questions you need to answer. These patterns help you keep visibility strong while avoiding unnecessary volume.
Keep labels that carry real debugging meaning
Some labels consistently give you faster answers during incidents. Keeping them ensures you don’t lose context:
- version
- customer_id (hashed/obfuscated)
- pod/namespace
- service, team, owner
These aren’t about “reducing cardinality”; they’re about making sure the labels you send map to real investigation steps.
Use OTel pipelines to shape data intentionally
The OTel Collector lets you define how your telemetry flows without changing your application code:
- Pre-aggregate metrics that don’t require per-instance detail
- Use tail-based sampling to keep important traces (errors, slow paths)
- Route verbose logs to lower-cost storage
- Drop fields that provide no signal during debugging
This keeps your pipelines efficient while preserving the context you rely on.
Align retention with how you investigate issues
Different signals serve different time windows. Matching retention to how your team works keeps costs predictable:
- Keep fresh data hot for fast querying
- Move older metrics/logs to object storage
- Store raw traces for error windows, deploy windows, or specific services
- Use separate retention profiles for non-critical workflows
You’re not reducing data; you’re placing it where it makes the most sense.
Observe how your telemetry shape evolves
It’s useful to understand how new labels or services change what you send. This isn’t about avoiding high-cardinality data - it’s about making sure the detail is intentional:
- Mirror production traffic through a staging or sandbox Collector
- Track which services introduce new attributes during deploys
- Surface metric families or labels that grow faster than expected
- Build a small dashboard showing changes in telemetry shape
This gives you awareness before cost or performance surprises appear downstream.
To ensure your observability stays effective during traffic spikes - without runaway costs - this guide on handling cardinality surges is useful.
How Last9 Gives You Full Detail Without the Cost Anxiety
We built Last9 specifically for teams hitting cardinality walls with traditional observability platforms. If you’re running Kubernetes at scale and constantly pruning labels to stay within metric limits, you know the pain-you’re choosing between observability and cost control.
Our platform handles the cardinality patterns that break conventional time-series databases: hundreds of millions of active series with container churn, dynamic labels, and the ephemeral nature of cloud-native workloads. We designed the architecture from the ground up for this reality.
How our pricing model differs
We use event-based billing with no per-host fees, no per-user charges, and no separate custom metrics surcharges. There are no high-cardinality penalties-the pricing model doesn’t punish you for instrumenting properly.
Our free tier includes 100M events monthly with 7-day retention. For teams currently spending $50K+/month on Datadog, where custom metrics drive most of the bill, our model typically reduces costs while actually increasing what you can instrument.
 Nishant Modak
Never drop metrics
Instead of dropping high-cardinality metrics or returning errors, we use graceful handling with a default quota of 20M active time series per metric per day. Metrics are never silently dropped-they remain available and visible through our Cardinality Explorer.
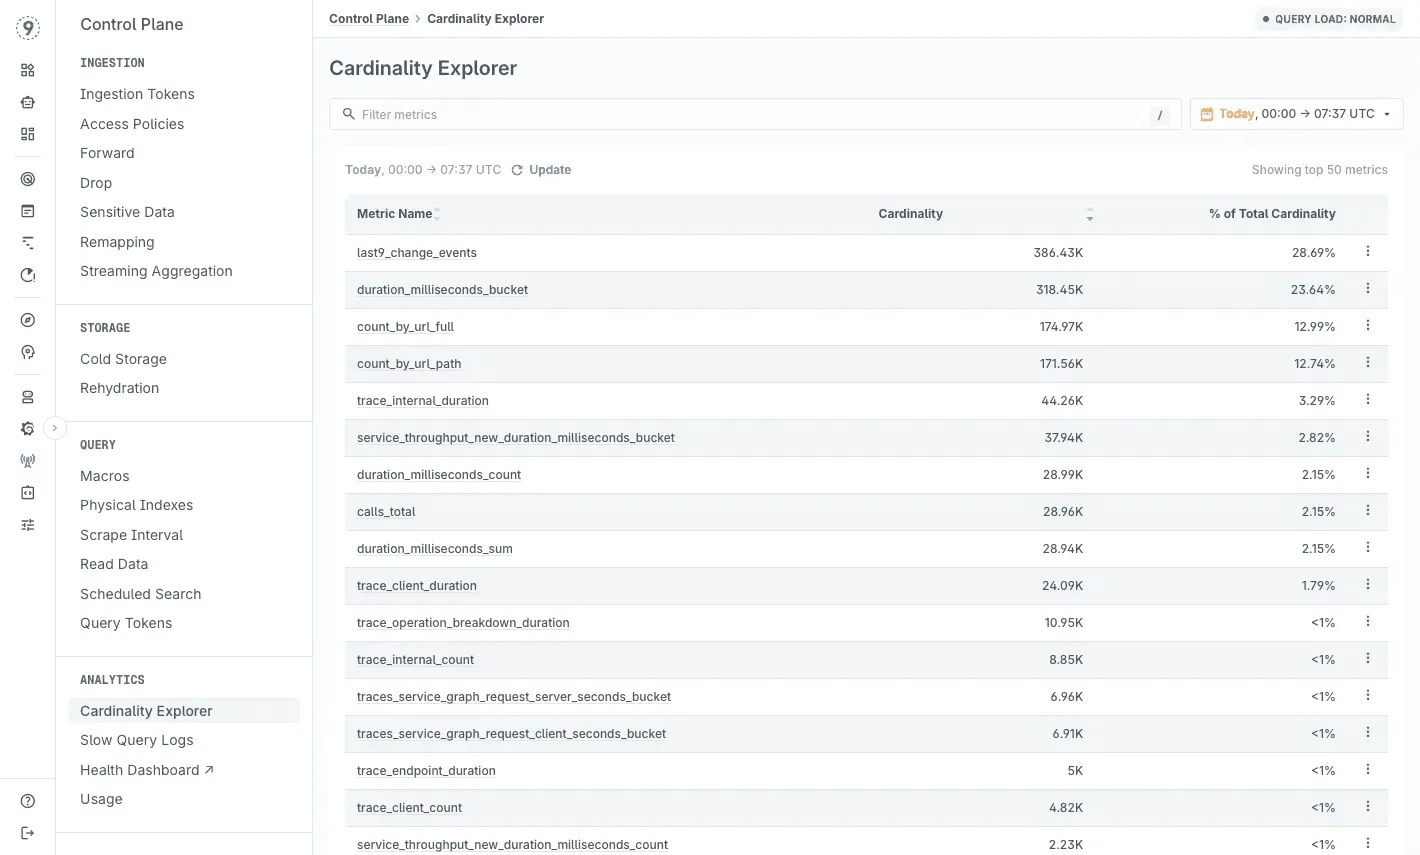
This matters during incidents. When something breaks at 3 AM, you need all your labels available for debugging. The metrics you dropped last month to save costs might be exactly what you need to diagnose today’s outage.
If you’re constantly having conversations about which labels to drop, which services to stop monitoring, or why your dashboards are missing critical dimensions-that’s the problem we solve.
Try Last9 for free today or if you’d like to discuss your usecase, book a time with our experts!
FAQs
Can I migrate from Datadog to another platform without re-instrumenting my applications?
Yes, if you’re using OpenTelemetry for instrumentation. The OTel Collector can be reconfigured to send data to a different backend without touching application code. If you’re using Datadog’s proprietary agents, you’ll need to replace them-this is the switching cost that OTel eliminates. Most modern platforms (Grafana Cloud, Honeycomb, Last9, SigNoz, Chronosphere) are OpenTelemetry-native, making migrations straightforward.
How do I estimate costs on event-based pricing models versus traditional host-based pricing?
Calculate your daily trace count (requests/sec × 86400), daily log volume in GB, and active metric series count. Most platforms provide calculators, but the estimates are only accurate if you measure your actual telemetry generation first. Run a 24-hour audit with your current platform’s metrics before switching. Event-based pricing (Honeycomb, Last9) typically costs less for high-traffic microservices with many short-lived containers, while host-based (Datadog, Splunk) can be more predictable for stable VM-based deployments.
What’s the real difference between user-based and data-based pricing?
User-based (New Relic) favors teams with concentrated debugging responsibility-if 5 SREs handle all production issues, you pay for 5 seats regardless of data volume. Data-based (Datadog, Grafana Cloud, Elastic) favors teams where many engineers need query access-unlimited users, but you pay per GB or metric. Neither is universally better; it depends on your org structure. Event-based (Honeycomb, Last9) tries to split the difference with unlimited users and predictable per-event costs.
Will self-hosting actually save money compared to managed platforms?
It depends on your scale and engineering capacity. Below 500GB/day ingestion, managed platforms usually win because infrastructure costs + engineering time exceed SaaS pricing. Above 2TB/day with dedicated platform engineers, self-hosting (SigNoz, Grafana stack) typically saves 60-80%. Between those ranges, do the math carefully-include on-call burden, upgrade cycles, and disaster recovery planning. AWS CloudWatch is effectively “self-hosted” with minimal ops overhead if you’re AWS-exclusive.
Which platform is best for Kubernetes-native workloads with high pod churn?
Platforms built for high cardinality handle this best: Last9, Chronosphere, and Honeycomb are architecturally designed for Kubernetes’ label explosion. Traditional platforms (Datadog, New Relic, Splunk) work but may require aggressive label pruning or sampling to control costs. Grafana Cloud with Mimir handles cardinality reasonably well at mid-market scale.
Can I use multiple observability platforms together?
You can mix vendors, and many teams do-CloudWatch for infra, Honeycomb for traces, Grafana for metrics, Elastic for logs. OTel makes that routing possible.
But the operational load rises fast. Each extra platform adds a new query language, dashboard, auth system, and billing cycle. During incidents, context is scattered, and MTTR climbs because the team is switching tools instead of correlating signals.
Two platforms are manageable. Three introduces overhead. Five turns into fragmented ownership and unclear visibility. This is why unified platforms like Last9 or Dynatrace matter: one place for metrics, logs, and traces with clean, correlated views.

