

You can use an observability platform that automatically discovers your services and provides ready-to-use dashboards with minimal setup.
If you’re running a system where microservices come and go, containers shift around, or serverless functions scale up quickly, this kind of experience saves you a lot of time. You gain visibility as soon as something goes live, without requiring any additional steps on your part.
In this blog, we talk about the top seven platforms that offer these capabilities.
7 Cost-Efficeint Observability Solutions That Auto-Discover Services
1.Last9
Modern systems shift constantly - rolling deployments, pod restarts, short-lived workers, and queued jobs that appear for only a few seconds. Last9 is built to capture those changes the moment they occur.
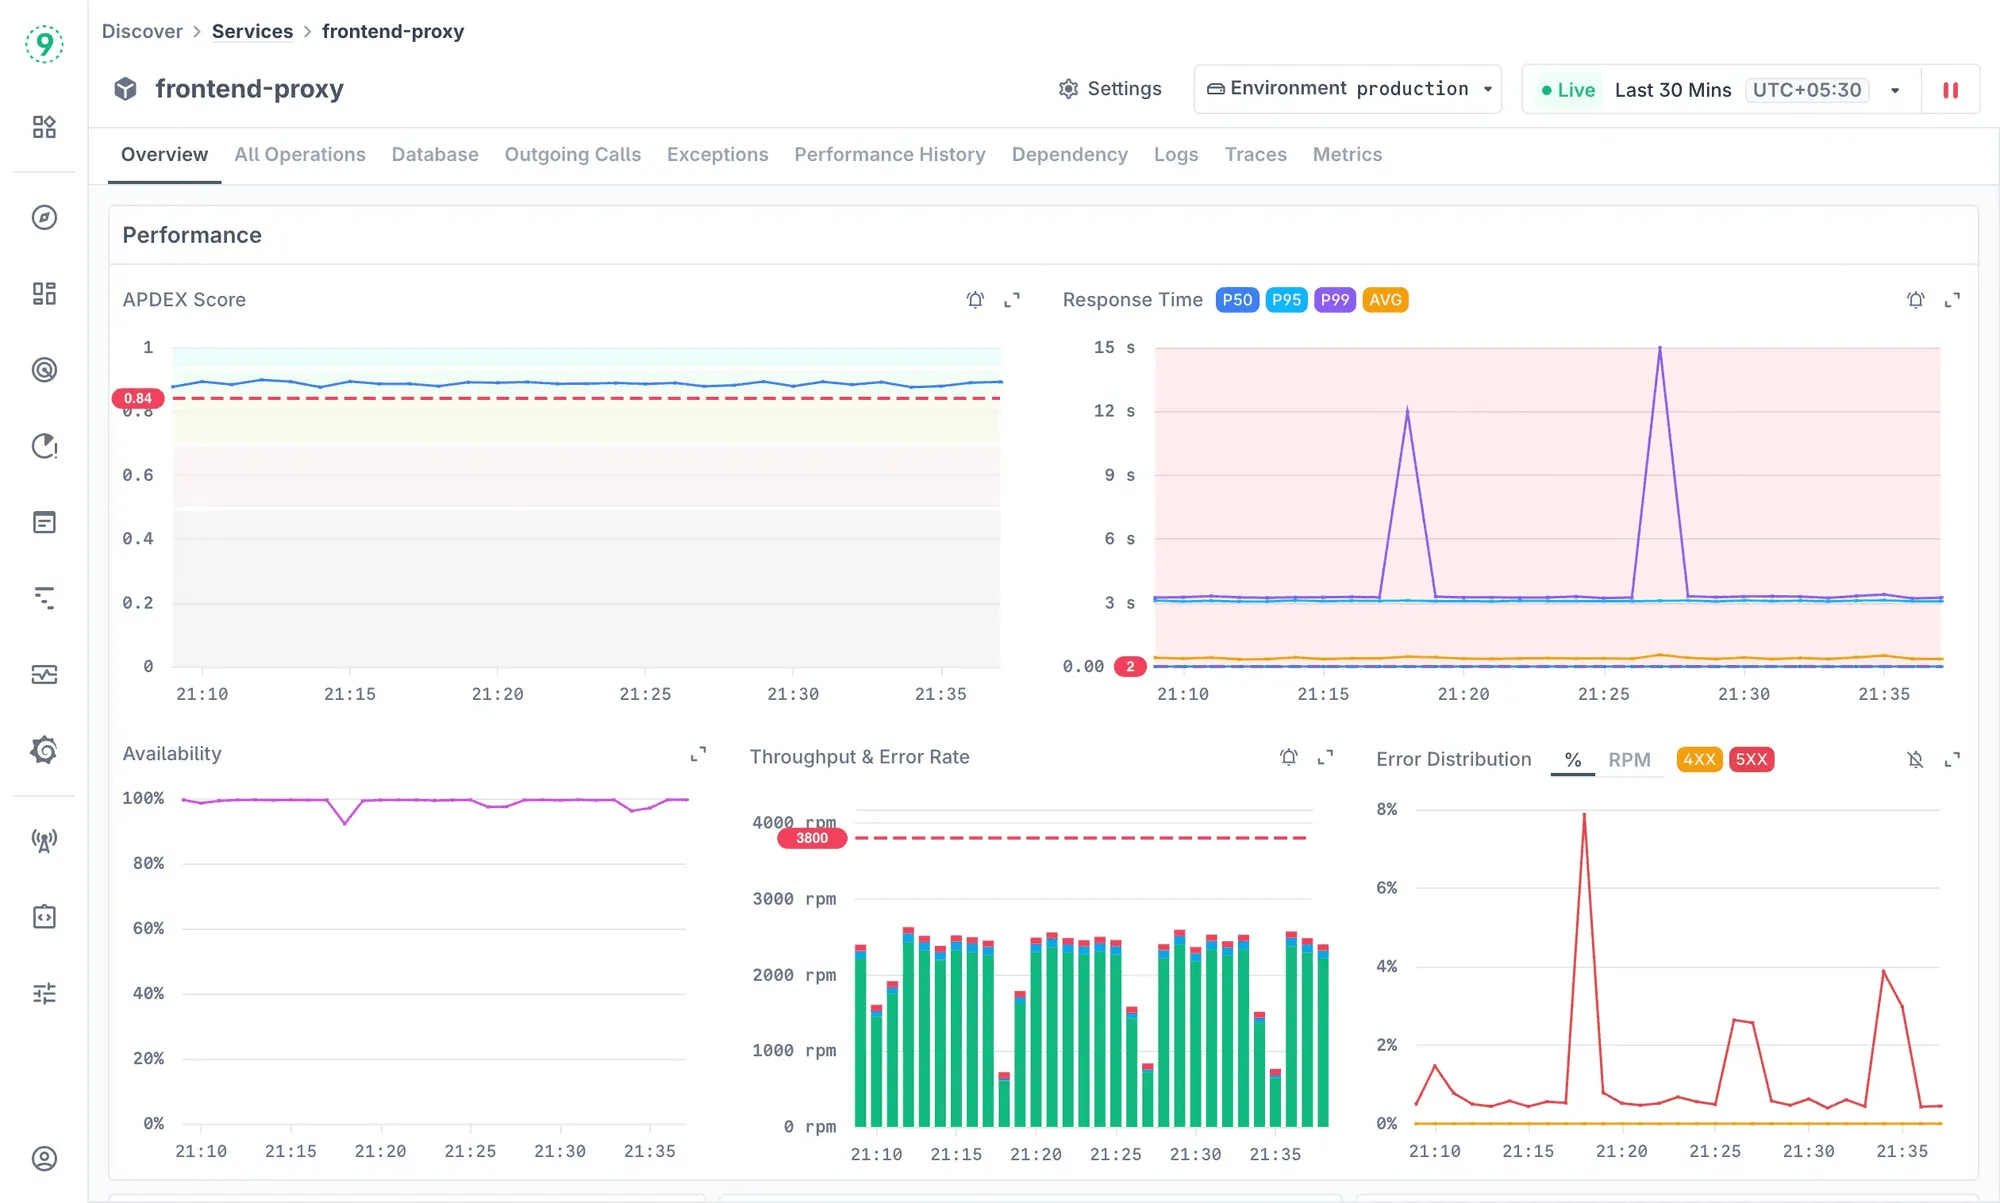
When a service or worker comes online, the platform reads the OpenTelemetry signals and runtime metadata you already send, places the workload in the correct part of your architecture, and gives you a ready-to-use dashboard immediately. There’s no template wiring, no custom agent model, and no waiting for the system to “learn” traffic patterns.
You get the essential operational signals right away: latency, errors, throughput, version information, and environment context. Traces and logs are connected directly to these views, and the dependency map updates with every rollout. Short-lived tasks-cron jobs, batch workers, ephemeral services-are picked up without extra configuration.
Here’s what appears right away:
- Latency, error rate, and throughput
- Breakdowns by version, pod, region, or environment
- Direct trace and log access for quick validation
For developers, this reduces the time between shipping code and understanding behaviour in production. You can validate a release within minutes, compare versions without building dashboards, and follow a spike in latency down to the exact trace behind it. Everything stays aligned with the OpenTelemetry model, so you keep your existing instrumentation instead of adopting a vendor-specific agent.
As your visibility needs expand, you can add focused layers on top of the baseline Last9 provides:
- Business KPIs tied to product flows
- Views for internal queues, workers, or pipelines
- Trend and capacity panels for planning
These extensions evolve with your application rather than being limited by platform constraints, giving you the depth you need without adding operational overhead.
You can also cut log volume safely by applying smarter filtering and routing - we cover those patterns in detail here!
2.Datadog
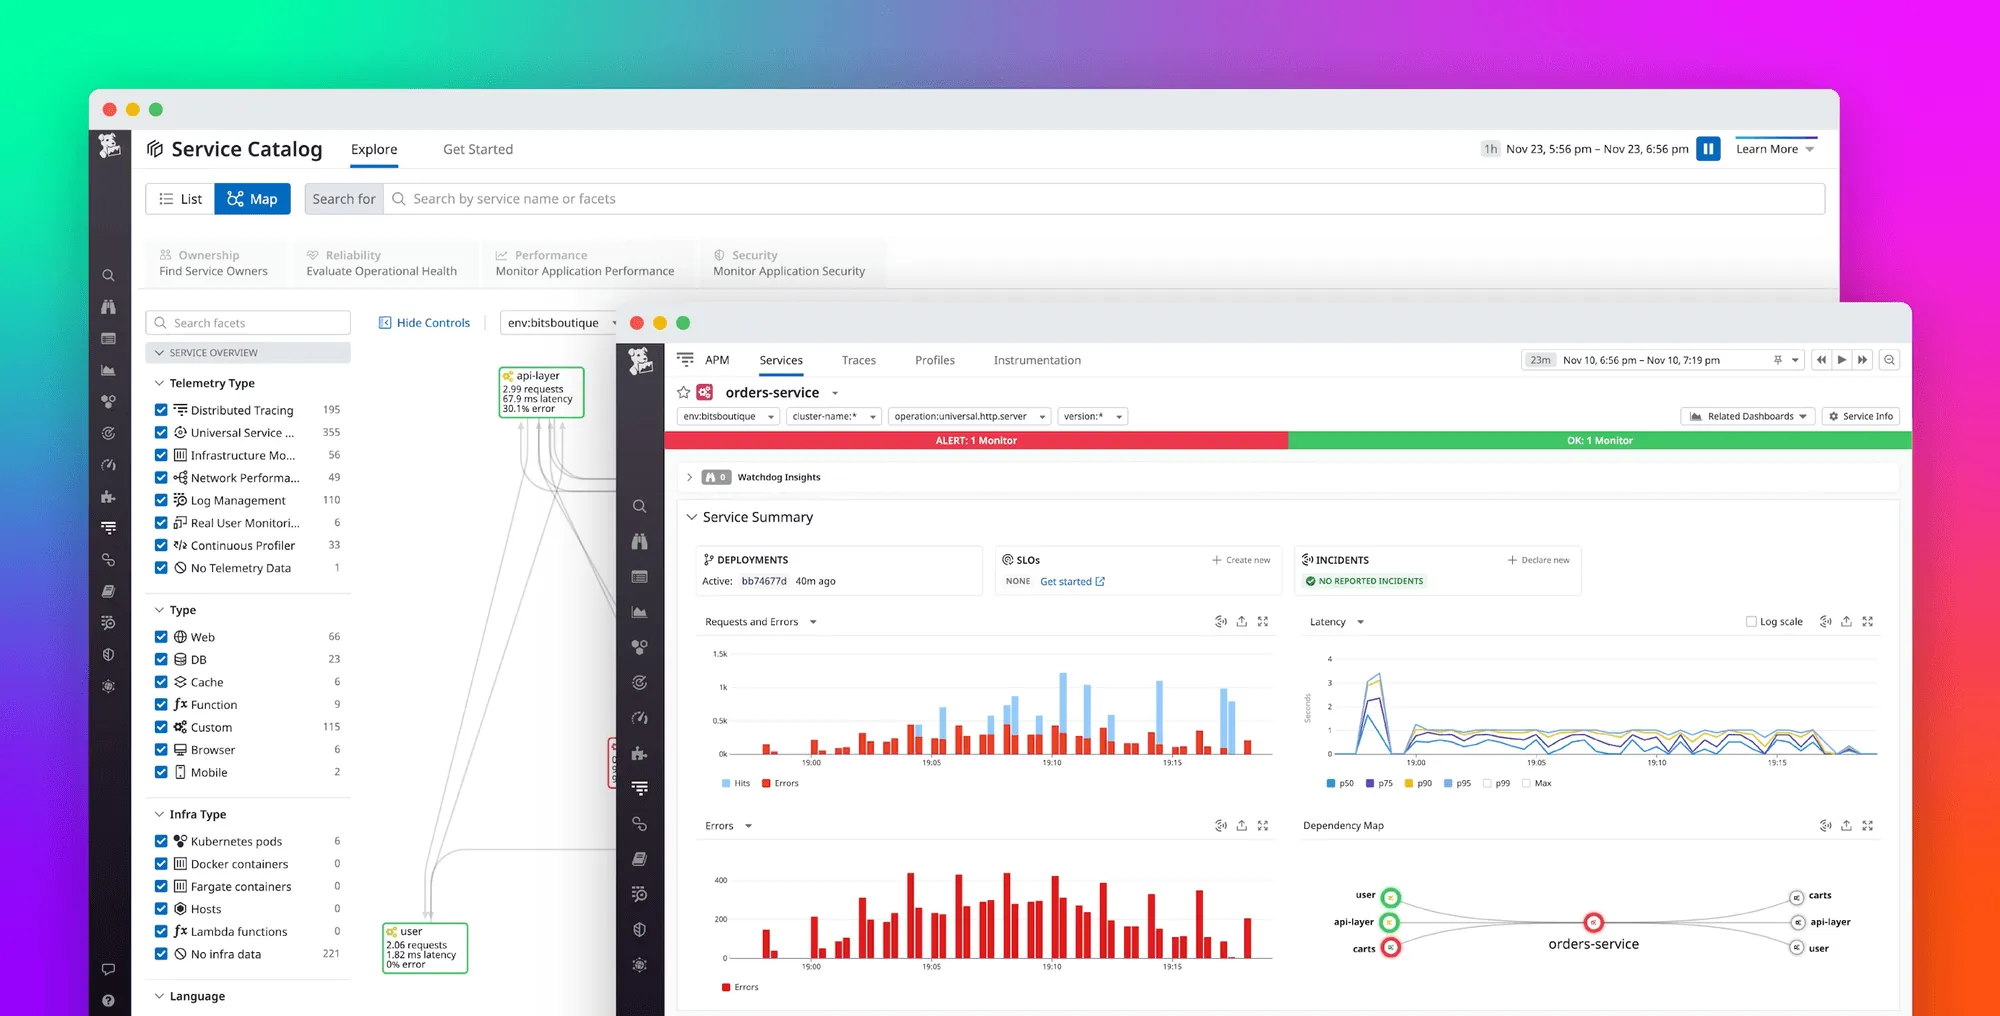
Datadog relies on host agents, containerized agents, and integration-specific collectors to discover services and generate dashboards. If you’re running Kubernetes, ECS, serverless workloads, or mixed environments, the Datadog agent pulls metadata from the orchestrator (pod annotations, labels, task metadata) and correlates it with traces and metrics. This gives you automatic service entries, topology, and dashboards tied to the technology you’re using.
What you’ll get
When Datadog detects a new workload, you’ll see a set of autogenerated views tied to the integration and runtime:
- Dashboards tied to the underlying integration (for example, PostgreSQL, Redis, NGINX, Kafka, Docker, or Kubernetes)
- RED/USE-style panels for latency, error rates, and request throughput
- Automatic linking between metrics, traces, and logs
- A service map built from Datadog APM tracing instrumentation
- Auto-detected runtime metrics for languages like Python, Node.js, Java, Go, and Ruby
- Infrastructure views sourced from node agents, cAdvisor, and container runtime metadata
You get a baseline view as soon as telemetry starts flowing through the agent or OTLP endpoint.
Why this helps you as a developer
You can ship code and check behaviour quickly because Datadog gives you a complete view across runtimes and infrastructure. Developers get tracing instrumentation for HTTP, gRPC, SQL clients, message queues, and background workers, along with integration-driven dashboards that surface runtime metrics automatically. You also get endpoint-level visibility without manual panel creation and direct jumps from a metric anomaly to the associated traces or logs.
- Tracing instrumentation across common protocols and libraries
- Integration-driven dashboards that surface runtime metrics automatically
- Endpoint-level visibility without manual panel creation
- Direct jumps from metric anomalies to related traces or logs
- Consistent instrumentation across containers, VMs, and serverless through either the agent or OTLP
This makes it easier to see how your service is performing across each layer - runtime, infrastructure, and dependencies - without setting up dashboards for every new component.
Ways you can extend visibility
If you want deeper or more tailored visibility, Datadog supports a wide set of extensibility features. Many teams add deployment markers, workflow-specific dashboards, or reliability-focused monitors that align with their SLOs.
- Custom metrics via DogStatsD or OTLP (for example, queue depth, job throughput, domain-specific counters)
- Deployment markers tied to CI/CD events
- Service-level dashboards for key workflows (checkout, ingestion pipelines, background jobs)
- Filters for version, commit SHA, region, or environment
- Monitors tuned to your SLO thresholds or reliability targets
These let you shape Datadog around the behaviour of your system rather than staying limited to integration defaults.
For a closer look at how Kubernetes surfaces new workloads, we’ve explained the discovery flow here!
3.Dynatrace
Dynatrace uses its OneAgent and the Smartscape engine to discover applications, processes, services, and infrastructure components across your environment. The agent instruments runtimes at the bytecode or VM level, which gives Dynatrace enough context to build a full dependency model - request flows, database calls, queue operations, container relationships, and cross-service traffic.
In multi-cloud or hybrid setups, Dynatrace also pulls metadata from Kubernetes, cloud APIs, and host-level signals to keep the topology accurate.
What you’ll get
When Dynatrace observes a new workload, you’ll see:
- Automatic detection of services, processes, pods, containers, and hosts
- A real-time topology map (Smartscape) showing service → process → host relationships
- Auto-instrumented tracing for common protocols: HTTP, gRPC, SQL, messaging systems
- Dashboards for service performance, resource utilisation, response times, and request hotspots
- Automatic baselining for anomalies using Dynatrace Davis AI
- Infrastructure correlation across Kubernetes clusters, cloud accounts, and VM fleets
You get a unified model that connects application behaviour to the underlying infrastructure without manual mapping.
Why this helps you as a developer
You get deep visibility without modifying application code. Dynatrace captures distributed traces automatically, follows each request across multiple services and dependencies, and surfaces performance differences across deployments or environments. Slow queries, external calls, and runtime behaviour across JVM, .NET CLR, Node.js, Go, and other runtimes appear with minimal setup.
Developers can:
- Inspect distributed traces captured through automatic bytecode instrumentation
- Follow a request across services, databases, and external dependencies
- See performance changes across deployments or environments
- Debug slow queries or external calls quickly
- Understand how behaviour shifts as infrastructure scales or moves
- Use runtime metrics surfaced automatically across supported runtimes
This is particularly useful when working in environments with many moving parts and needing a consistent end-to-end view.
Ways you can extend visibility
If you want deeper or more specific visibility, Dynatrace lets you layer additional insights on top of its automated model:
- Custom events or business metrics through the Dynatrace API
- Dashboards for workflow-specific paths or application domains
- Deployment metadata or version markers from CI/CD
- Log enrichment to tie runtime data to the application context
- Additional tracing through OpenTelemetry for finer control
These additions help you shape Dynatrace around your application’s behaviour while still benefiting from its automated instrumentation.
4.Grafana Cloud
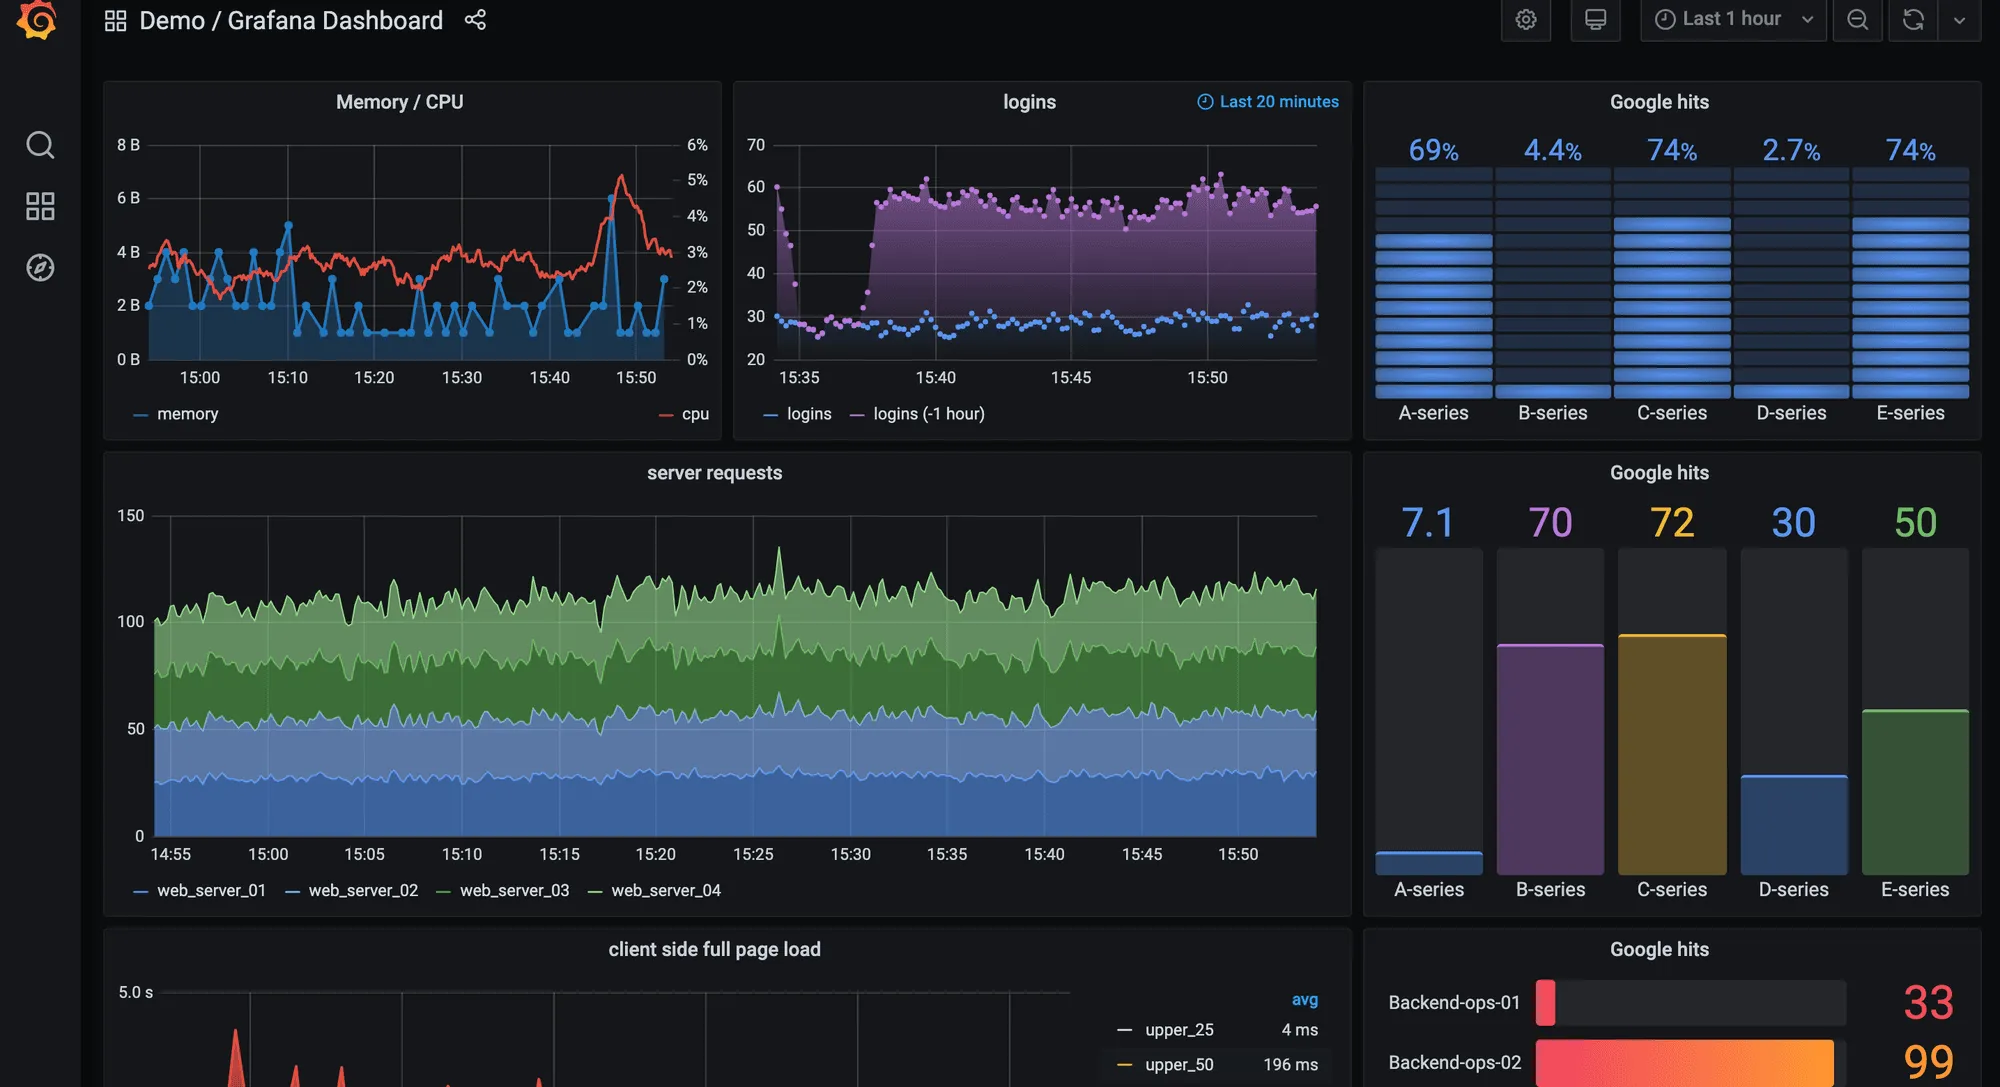
Grafana Cloud builds on Prometheus-style service discovery and OpenTelemetry pipelines to detect workloads across Kubernetes, EC2, on-prem, and hybrid environments.
It pulls metadata from Kubernetes labels, annotations, cloud APIs, exporters, and OTel resource attributes, then correlates that data into service views, dashboards, and topology maps.
Once metrics, logs, or traces start flowing, Grafana Cloud aligns them using labels to show how each workload behaves and where it fits in your system.
What you’ll get
When Grafana Cloud picks up a new workload, you’ll see:
- Targets auto-discovered through Prometheus SD (Kubernetes, EC2, Consul, DNS, etc.)
- Prebuilt dashboards for Kubernetes, NGINX, Redis, MySQL, PostgreSQL, JVM, Node.js, and other integrations
- RED-style panels based on PromQL or OpenTelemetry semantic conventions
- Automatic linking between metrics, logs, and traces inside Grafana
- A service graph populated through OpenTelemetry tracing pipelines
- Infrastructure views from node exporters, cAdvisor, and container/runtime metadata
You get a baseline view as soon as telemetry reaches your Grafana Cloud instance.
Why this helps you as a developer
Grafana Cloud gives you consistent visibility using PromQL, Loki logs, and OTel traces without changing your instrumentation. You can validate deployments, compare versions through labels, and jump from a metric spike to related logs or trace samples. Since everything is label-driven, pod-level, namespace-level, and region-level insights appear automatically.
Developers can:
- Query metrics immediately using PromQL or OTel-based metrics
- Correlate logs, metrics, and traces with shared labels
- Compare performance across versions, environments, or regions
- Debug slow endpoints or database calls using TraceQL and OTel traces
- Inspect pod behaviour, replica changes, and cluster health through built-in dashboards
This makes it easier to understand performance across microservices without manually building dashboards for every workload.
Ways you can extend visibility
Grafana Cloud lets you go deeper by adding:
- Custom PromQL dashboards for service-level performance
- Business KPIs through labels, recording rules, or derived metrics
- Synthetic monitoring and alerting for external endpoints
- Additional OTel Collector or Alloy pipeline stages for enrichment and routing
- Log enrichment with version, region, or build metadata
- SLO-driven alerts based on PromQL conditions
These additions help you shape Grafana Cloud around your application while still keeping the pipeline open and flexible.
If you’re working with scheduled or asynchronous jobs, our blog covers the details with practical visibility tips here!
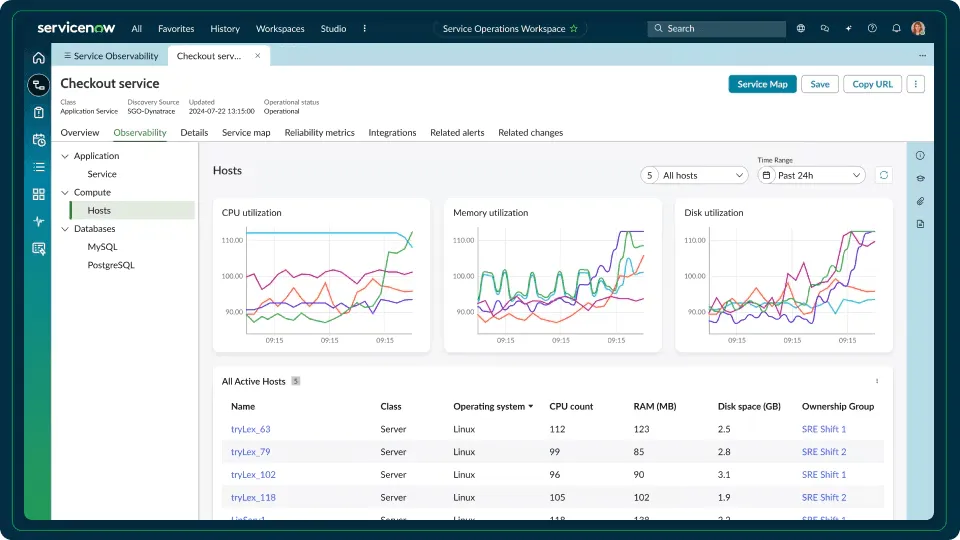
5.ServiceNow Service Observability
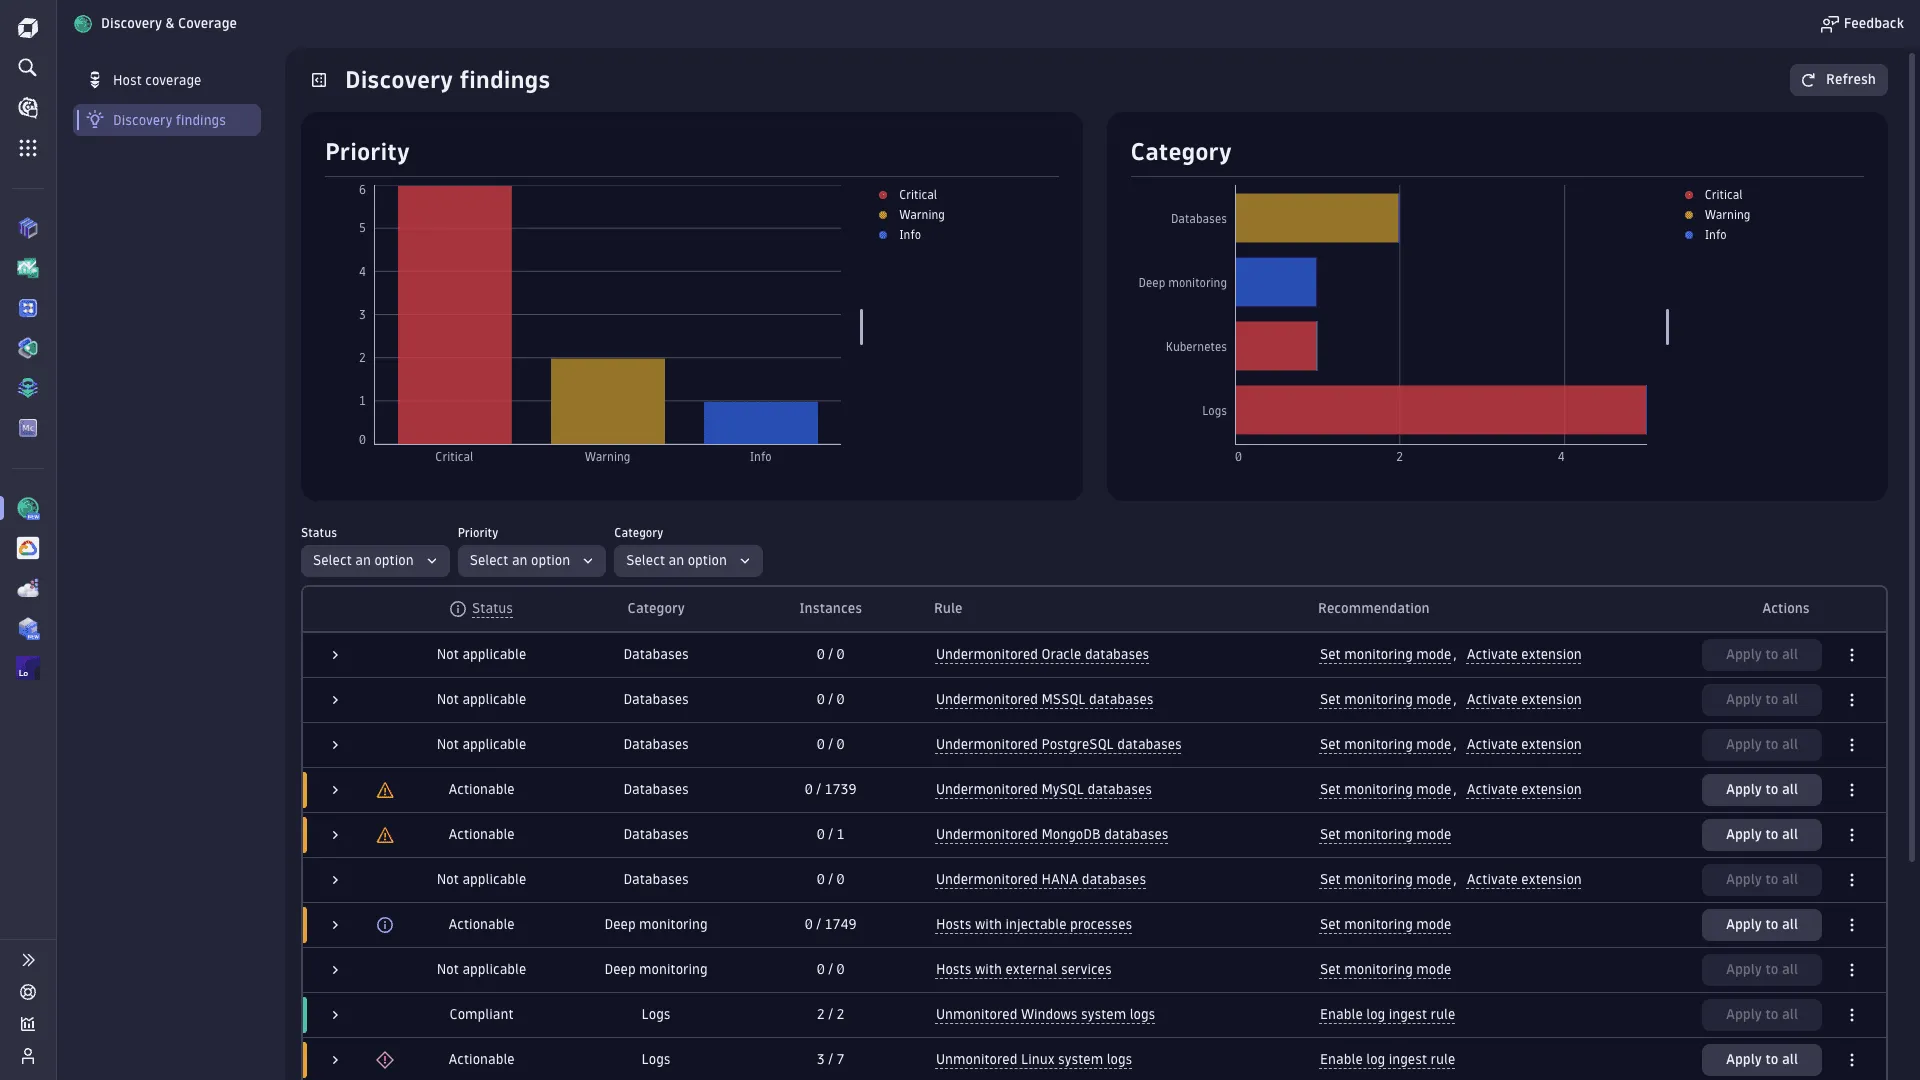
ServiceNow Service Observability is built around a service-oriented model where applications, dependencies, and infrastructure components are represented within a unified service map. It ties directly into the ServiceNow ecosystem - CMDB, incidents, change management, and operations workflows - so teams using ServiceNow as their operational backbone get observability data automatically aligned with their existing processes.
The platform ingests signals from agents, cloud APIs, logs, third-party monitoring tools, and integration endpoints, then reconciles them with CMDB entries to show how systems relate and how changes impact services.
What you’ll get
When ServiceNow detects or ingests a new component, you’ll see:
- A service map that connects applications, databases, hosts, load balancers, and external dependencies
- Health and status indicators built from infrastructure metrics, logs, and event data
- Context tied directly to CMDB entries, incidents, alerts, and change requests
- Dashboards showing availability, resource utilisation, and component-level performance
- Integrations with AWS, Azure, GCP, and the monitoring tools already in your stack
- Real-time updates to service relationships as components scale, move, or change
This gives you a unified view that fits naturally into ITSM-driven environments.
Why this helps you as a developer
You get visibility that connects application behaviour to the operational workflows your organisation already depends on. ServiceNow shows performance signals in the same place where incidents, changes, and CI/CD-driven updates are tracked, giving development teams shared context with SRE and operations.
Developers can:
- Trace an issue through the service map to identify which component is affected
- See how a deployment or infrastructure change ties back to an incident
- View performance data alongside change records and CI/CD markers
- Collaborate with ops teams through a shared, CMDB-driven model
- Identify upstream or downstream impact during debugging or investigations
If your organisation uses ServiceNow as its source of truth, this keeps application telemetry aligned with the same operational model.
Ways you can extend visibility
You can add more context and depth by integrating:
- Telemetry from Prometheus, OpenTelemetry, or existing monitoring systems
- Custom CMDB attributes for more accurate dependency mapping
- Logs and events from internal applications or on-prem systems
- Dashboards for domain-specific workflows (authentication, data pipelines, scheduled jobs)
- Change annotations or deployment metadata to correlate performance shifts
These additions help you bridge development data with IT operations in a structured, service-oriented way.
6.Checkmk
Checkmk is built around host and service monitoring, and it works well when your environment spans physical servers, VMs, network devices, databases, and traditional application services. Its discovery process scans hosts and identifies the services running on them, collecting metrics through agents, SNMP, or plug-ins. If your stack crosses on-prem, cloud, and older systems, Checkmk provides a single place to track them without needing a different tool for each layer.
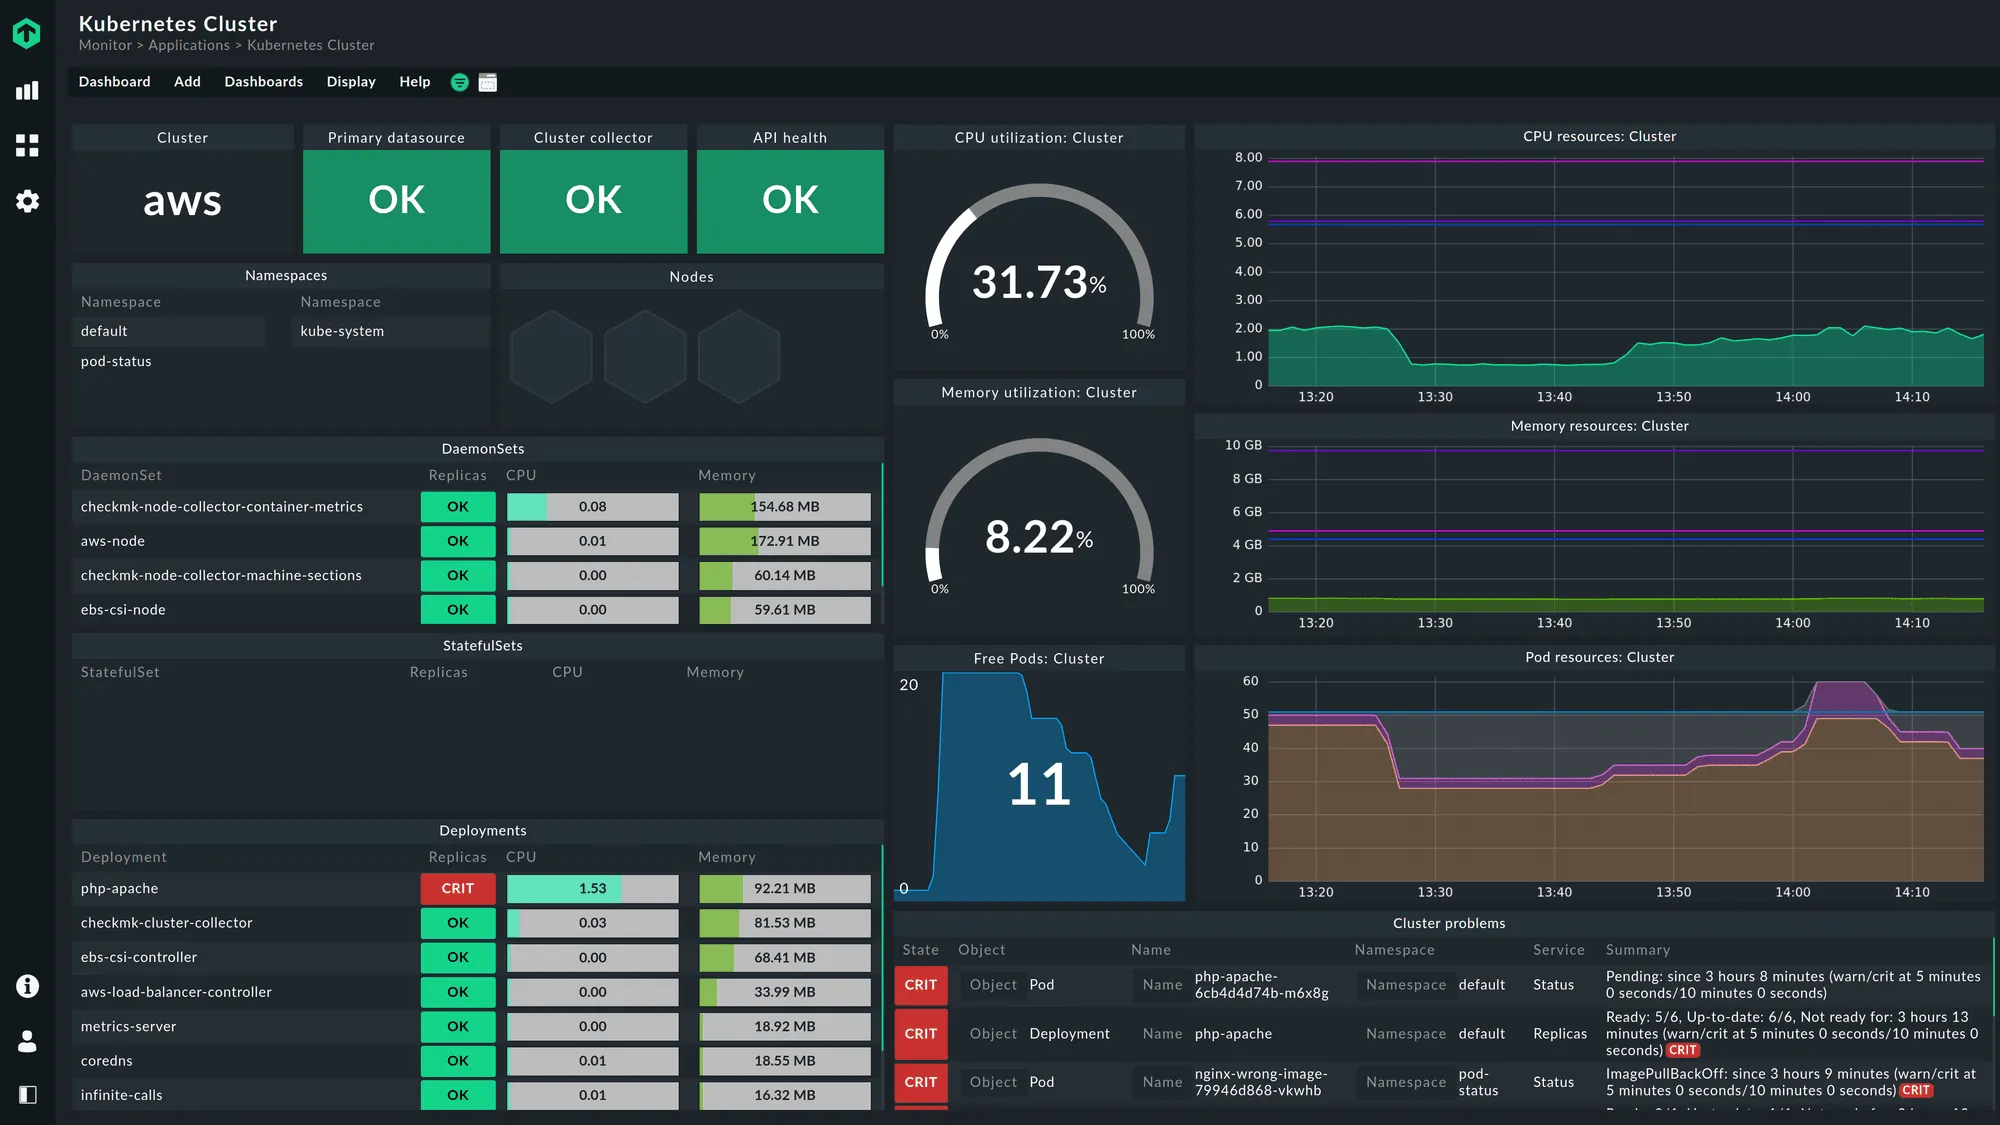
When Checkmk detects a new host or service, you get immediate host-level signals-CPU, memory, disk I/O, and network throughput-along with checks for databases, web servers, message queues, and background processes. Dashboards group these by host, service type, site, or environment, and you can monitor network devices using SNMP or use agents for Linux, Windows, and Unix. Additional plug-ins bring in Kubernetes, container, or cloud data when needed.
What appears early on includes:
- Core host metrics for resource behaviour
- Service checks for common backend components
- Environment- or site-level dashboards
This makes Checkmk useful when you need structured visibility across mixed infrastructure.
For developers, it gives a consistent view of application components that don’t always live inside Kubernetes or managed cloud services. You can monitor traditional hosts next to cloud-native workloads, inspect checks for databases or caches, and understand resource pressure when debugging latency or throughput issues. Because everything shows up in the same UI, you can combine infrastructure and application signals without juggling tools.
As your needs grow, Checkmk’s plug-in model lets you extend visibility in practical ways:
- Custom plug-ins for internal services or workers
- Labels for grouping hosts by environment or region
- Dashboards for specific workflows or product areas
- Cloud or container integrations for dynamic workloads
- Parameters tuned to your SLOs or operational thresholds
These extensions help Checkmk adapt to environments where modern and legacy systems run side by side, without forcing you to standardise everything before you get value.
7.Zabbix
Zabbix focuses on host and service monitoring across mixed environments-physical servers, network devices, VMs, older application stacks, and cloud nodes. It combines agents, SNMP checks, and discovery rules to detect hosts and the services running on them. If your setup spans older on-prem systems and newer workloads, Zabbix gives you a central place to collect system behaviour without requiring major changes to your infrastructure.
When Zabbix discovers a new resource, you immediately get core operational views: CPU, memory, disk, and network usage at the host level, along with service checks based on templates for Linux, Windows, databases, hypervisors, or network appliances. Dashboards group these by host, template, or environment, and Zabbix triggers alert conditions based on thresholds or unusual patterns. For network-heavy setups, SNMP-based data fills in the gaps for routers, switches, firewalls, and appliances.
You’ll typically see three things right away:
- Host-level metrics for baseline health
- Service checks tied to templates
- Alerts based on preset thresholds
For developers, Zabbix helps when your application interacts with components that don’t emit modern telemetry formats. You can track resource pressure when debugging performance issues, monitor backend databases or caches through built-in checks, and view infrastructure signals in the same UI where application checks appear. And because Zabbix accepts custom commands, you can add lightweight scripts to observe internal endpoints or workflows without deploying a full instrumentation layer.
You can also tune and extend Zabbix in practical ways. Many teams add custom templates for internal services, organise hosts by region or environment using tags, or deploy Zabbix proxies to monitor remote clusters.
Add event-correlation rules or custom scripts to stitch together infrastructure and application behaviour. These extensions make Zabbix adaptable in environments where both legacy and cloud-native components need to be monitored side by side.
To understand how your service catalog fits into visibility workflows, check out: What Is Service Catalog Observability?
What You Should Evaluate When a Tool Claims “Auto-Discovery + Ready Dashboards”
When a platform says it can discover your services automatically, you should treat it like an engineering problem: what does it detect, how does it detect it, and what does the platform do with that information?
Here are the technical questions you should ask yourself while comparing tools:
Service Discovery & Topology Mapping
1. How does the platform detect a new service?
- Does it read metadata from the Kubernetes API, container labels, ECS task definitions, or OpenTelemetry
service.name? - Does it rely on agents running on every host, sidecars, or direct instrumentation?
- Does it require you to register each service manually, or does it pick it up automatically the moment a pod starts?
2. Does the platform generate a dependency graph you can trust?
- Can it map outbound calls using instrumentation hooks (HTTP, gRPC, SQL clients), or does it infer from logs?
- Does it detect async paths (queues, background jobs) or only synchronous requests?
- Can you filter the topology by environment, version, or deployment?
3. Can it keep up with fast-moving infrastructure?
- How often does it rescan Kubernetes?
- Does it map new pods or versions during a rolling update, or only after the rollout completes?
- Does it show stale services, and how quickly does it clean them up?
Dashboard Generation & Instrumentation Setup
4. What exactly gets auto-generated when a service appears?
- A latency/error/throughput dashboard?
- A service-level view with RED/USE metrics?
- A trace-aware panel that links out to request paths?
- Panels broken down by version, region, or build ID?
5. How much instrumentation do you need to write?
- Does it rely purely on language auto-instrumentation?
- Does it need manual spans for databases, queues, or background jobs?
- Does it require environment variables or configuration files per service?
6. Does it give you developer-focused workflows?
- Can you jump from a dashboard panel to the trace of that exact request?
- Can you filter dashboards by deployment tag (for example
commit=abc123)? - Can you compare version N vs version N-1 without building separate panels?
Open Standards & Telemetry Flexibility
7. Does it accept raw OpenTelemetry data without vendor-specific wrappers?
- Does it support OTLP/HTTP and OTLP/gRPC?
- Can it ingest OTel Metrics, Logs, and Traces directly?
- Does it preserve attribute names or rewrite them into a proprietary schema?
8. Does it support your runtime stack?
- Does it have first-class support for Node.js, Python, Java, Go, Ruby, and PHP?
- Does it rely on agents that don’t support serverless?
- Does it require root access or custom images to deploy?
Scalability, High-Cardinality & Dynamic Environments
9. Can it handle complex label sets without slowing down?
- Can dashboards filter by
tenant_id,build_id,k8s.pod.name,region,endpoint? - Does it downsample automatically or drop cardinality without telling you?
10. How does it behave in a container-heavy environment?
- Does each pod show up as a separate entity, or does it roll them up cleanly?
- Does it detect ephemeral jobs (for example, migrations, batch workers) or ignore them?
11. What happens when your service count doubles?
- Do dashboards become slower?
- Do queries start timing out?
- Do alerts fire late because ingestion lags?
Production-Readiness & Customization
12. Can you tailor the dashboards without hacking around defaults?
- Can you add business KPIs (orders per minute, jobs processed, queue depth)?
- Can you overlay deployments on charts (for example,
kubectl rolloutmarkers)? - Can you pin traces or search by custom attributes?
13. How does the platform manage service lifecycle?
- Does it hide retired services automatically?
- Can you archive dashboards tied to deprecated versions?
14. How predictable are the operational costs?
Technical things to check:
- Does every new pod or service generate a new billing entity?
- Does it charge by time-series count or cardinality?
- Does auto-discovery increase costs without limits?
Production Notes & Best Practices
- Make sure your instrumentation (OpenTelemetry or any equivalent library) includes clear metadata such as service name, version, and environment. Auto-discovery relies on consistent identifiers to map services correctly.
- Use the auto-generated dashboards as your baseline. From there, add the business metrics you care about, like checkout latency by region or error rate by user tier.
- Validate onboarding with a simple test. Deploy a small service such as
test-svc-v2and confirm that it appears in the UI, gets a dashboard, and shows its upstream and downstream relationships. - Review your dashboards from time to time. When services are replaced or retired, it helps to clean up old views so everything stays relevant.
- Keep an eye on cost behavior. Auto-discovery can surface many services and labels, so it’s good to understand how your platform handles cardinality and scale.
- Archive dashboards you no longer use. Automatic visibility is helpful, but clearing out stale dashboards keeps your workspace easier to navigate.
To align your cluster metrics with observability goals, this piece covers the main ideas: Kubernetes Monitoring & Metrics
How Last9 Works Better for Developer-Centric Observability
Last9 is built around a simple idea: developers should get telemetry that works out of the box, without changing their instrumentation or maintaining extra config. The platform picks up new services as they appear, builds the essential views automatically, and keeps high-cardinality data usable instead of forcing you to strip context.
Key capabilities:
- Auto-discovery for services, jobs, and hosts using the metadata you already emit
- Pre-built dashboards that surface core signals like latency, error rate, throughput, and version changes
- High-cardinality support designed for detailed telemetry-no hidden limits or dropped labels
- Native compatibility with OpenTelemetry, so existing instrumentation continues to work as-is
- A dev-first workflow that reduces setup work and shortens the path from deployment to reliable visibility
- Clear correlation across services, helping you validate performance changes quickly
This approach keeps the focus on fast, accurate system understanding rather than setup steps, and makes it easier for engineering teams to get consistent observability across environments.
Last9 helps solve the challenge of maintaining system reliability at scale by providing clear visibility into service health, dependencies, and performance through SLOs and error budgets. Instead of getting lost in endless metrics, it allows me to focus on what truly impacts user experience.
- Dileep, Software Engineer, Tazapay
Start for free today or book sometime with us to know how it fits into your stack!
FAQs
How automatic is auto-discovery across observability platforms?
Most platforms support auto-discovery once their agent, sidecar, or collector is in place. Datadog, New Relic, Dynatrace, Elastic, and Last9 detect new services and containers through emitted metadata and standard instrumentation. Prometheus-based setups (including Grafana Cloud) rely on Kubernetes, EC2, or Consul service discovery. The setup differs, but the common pattern is: configure once, and new workloads appear as they start.
Can I customise dashboards after they’re auto-generated?
Yes. Tools like Last9, Datadog, New Relic, Dynatrace, Elastic, and Grafana Cloud generate initial dashboards-latency, errors, throughput, resource signals-and all of them allow extending, editing, or rebuilding these views to fit your application or environment.
Does auto-discovery remove the need to think about instrumentation or metadata?
No. All major platforms, including Last9, depend on consistent metadata like service name, environment, and version. Auto-discovery helps surface what’s running, but clear instrumentation and clean tags determine how well those services are mapped and correlated.

