

It’s 3 AM. API latency just spiked from 200ms to 2s. Alerts are firing, and users are frustrated. You SSH into the first server: top, free -h, iostat - nothing unusual. On to the next host. And the next.
That’s how most of us learned to debug. The tools worked, and we got good at using them. But as infrastructure became distributed and dynamic, this approach started to break down.
Modern monitoring needs more than SSH and top. It needs unified telemetry.
How Infrastructure Monitoring Evolved
Most monitoring stacks didn’t start with a grand design - they grew organically. You added Prometheus and node_exporter to a handful of servers. Maybe later, a vendor agent for extra visibility. Each tool solved a problem, but eventually cracks appeared.
Typical pain points:
- Multiple dashboards: CPU in one tool, traces in another, network metrics somewhere else.
- Dynamic infrastructure: Auto-scaling, containers, and ephemeral pods mean what’s running now may not exist in an hour.
- Slow correlation: During an incident, matching timestamps across systems eats valuable minutes.
None of this was “wrong.” These tools were built for more static environments. It’s our infrastructure that’s changed.
For a deeper look at the application-side signals that pair with host metrics, check out the key APM metrics you should track.
Unified Telemetry with OpenTelemetry
What’s different now is that host metrics don’t need their own silo. With OpenTelemetry (OTel), infrastructure data can flow through the same pipeline as application traces and metrics.
This has real advantages:
- Shared context: Host metrics carry the same attributes (
service,deployment,environment) as your application telemetry. - Consistent labeling: No more mismatched tags between apps and infrastructure.
- Backend flexibility: Since everything speaks OTLP, you choose where data lands - without being locked into proprietary formats.
The practical outcome: if a slow database query aligns with high disk I/O, you see both signals side by side.
Collect Host Metrics with OpenTelemetry
OpenTelemetry makes host monitoring part of the same pipeline you already use for application telemetry. Instead of running a separate agent for servers, the Host Metrics receiver in the OTel Collector captures infrastructure data at regular intervals.
Here’s the basic configuration:
receivers: hostmetrics: collection_interval: 30s scrapers: cpu: {} memory: {} disk: {} network: {} load: {} filesystem: {}This setup scrapes CPU, memory, disk, network, load, and filesystem stats every 30 seconds. That interval is a common default: frequent enough to catch spikes without overwhelming your pipeline. You can tune it per environment - for example, shorter intervals in staging when debugging performance issues, longer intervals in production to balance cost and fidelity.
In Kubernetes environments, the OTel Operator simplifies discovery. New nodes are automatically picked up and labeled with attributes like k8s.node.name and k8s.cluster.name. This ensures metrics stay consistent across the fleet, even as nodes scale up and down.
Because the Host Metrics receiver is part of the same Collector you use for application data, you don’t need a separate monitoring stack. Infrastructure metrics, traces, and logs all flow through a single pipeline. This uniformity makes correlation straightforward: the same attributes that identify an application service also tag the underlying host.
If you’re migrating from Prometheus node_exporter, this approach offers two big improvements:
- Standardization: Host metrics share the same schema and attribute model as other OTel signals.
- Flexibility: Data can be routed to any backend that accepts OTLP, whether that’s Prometheus-compatible storage or an OTel-native platform like Last9.
Service-to-service communication only works if discovery is reliable - see how Kubernetes service discovery ensures that hosts and applications stay connected.
What to Monitor (and Why)
A handful of signals consistently explain performance issues before they escalate:
- CPU utilization and context switches: High CPU is obvious, but thousands of context switches per second often point to contention even when the CPU looks “fine.”
- Memory pressure: Free memory is just the headline. Page faults, swap usage, and allocation latency show early signs of trouble.
- Disk I/O: Percent utilization hides the real story. Queue depths, wait times, and per-operation latencies explain slow queries better.
- Network connections: Socket states (
established,time_wait,close_wait) reveal whether connections are piling up or being dropped. - System load per core: Total load averages can mislead; per-core utilization shows if workloads are balanced.
How Host Metrics Help During Incidents
Host metrics are most effective when they provide context during an outage or performance issue. The value isn’t in the raw numbers alone, but in how quickly they help narrow down the problem.
- Unified views: A dashboard that shows CPU, memory, disk, and network health side by side makes it easier to understand the system state. In Last9, hosts are color-coded by status so you can spot stressed machines without clicking through each one.
- Historical context: Point-in-time checks don’t always reveal long-term issues. Weeks of host data can highlight memory leaks, noisy neighbors, or slowly growing I/O pressure that would otherwise go unnoticed.
- Flexible filtering: During incidents, being able to sort by CPU usage, group by service, or filter by environment helps isolate which part of the fleet is affected. This reduces noise and keeps you focused on what matters.
- Application correlation: Since host metrics and application telemetry share attributes like
service.nameordeployment.environment, you can line up infrastructure pressure with application impact. For instance, a spike in API latency can be correlated with increased disk queue depth on a database node.
This combination of breadth, history, and correlation makes host metrics directly actionable during incidents.
Scale Infrastructure Monitoring at Production Scale
As infrastructure expands, the way you monitor it needs to scale without creating new bottlenecks. Two factors matter most: how data is collected and where it is stored.
- Collection frequency: A 30-second scrape interval works well for most environments - detailed enough for alerting without overwhelming the pipeline. During an incident, you can temporarily lower the interval for higher granularity.
- Cardinality control: Tags like
env,region, andserviceare critical, but avoid high-churn attributes such as pod names or container IDs in host metrics. Those are better suited for traces or logs. - Pipeline efficiency: The OpenTelemetry Collector can perform aggregation before data leaves the host. This reduces backend load while preserving patterns useful for analysis.
- Backend design: Where metrics end up has a major impact on performance and fidelity.
- OTel-native platforms (like Last9) keep attributes intact. Labels such as
service.versionorregionremain queryable with no schema translation or silent dropping. - OTel-compatible platforms can ingest OTLP but often reshape data into proprietary models. This can work for a few use cases, but it’s worth validating that the attributes you rely on remain accessible.
- OTel-native platforms (like Last9) keep attributes intact. Labels such as
A good practice is to test with your own telemetry. Push real metrics through the pipeline and confirm that queries still return the labels and correlations you need.

Host Monitoring in Practice: Last9’s Approach
When we designed Discover Hosts, we didn’t just want to collect host metrics - we wanted to make them meaningful, usable, and integrated with your existing observability workflows.
Here’s how that works:
Automatic Discovery & Configuration
- With the Kubernetes Operator, host monitoring is bootstrapped automatically. New nodes are detected, labeled, and monitored without manual setup.
- For non-Kubernetes environments, you set up the OpenTelemetry host metrics integration (CPU, memory, disk, network) and configure it through your existing collector pipeline.
- You choose the integrations you need - whether just Host Metrics, Kubernetes Operator, or Kubernetes Cluster Monitoring - depending on your environment.
Unified Dashboard with Context
- The Hosts dashboard (Discover → Hosts) gives you a bird’s-eye view of all monitored infrastructure. You see key metrics like CPU, memory usage, root disk usage, and host uptime, side by side with host metadata (IP, Host ID, Job, etc.).
- You can sort, filter, and search hosts by metrics or identifiers (IP, Host ID) to narrow the surface area during incidents.
Deep Host Inspection
Clicking into a specific host takes you to that host’s detail view with multiple tabs:
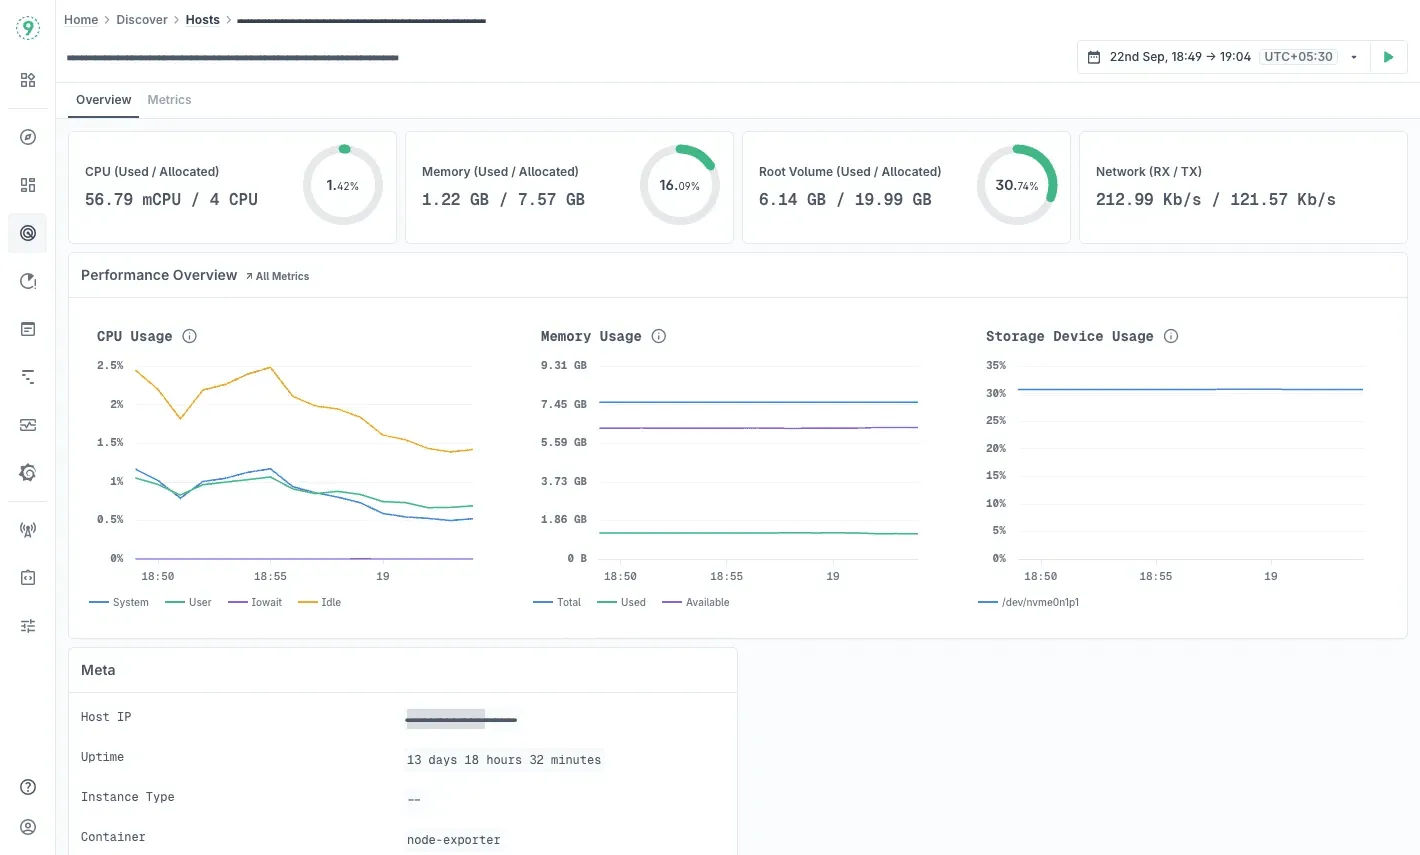
- Overview tab: High-level summary - CPU, memory, root volume, network throughput, plus metadata like architecture, uptime, node name, etc.
- Metrics tab: Detailed time-series analysis:
- CPU usage broken down over time
- Memory consumption trends
- Disk I/O operations, latencies, queue depths
- Network throughput (sent/received)
- Disk metrics like IOPS, time spent on I/O, and read/write latency
- Low-level system stats like socket states, open file descriptors, and context switches
Best Practices Built In
Last9 embeds practices you’d expect in mature infrastructure monitoring:
- Baseline trends: the dashboard supports visualizing weeks or months of host-level metrics, enabling you to detect slow-developing issues before they become critical.
- Alerts & thresholds: Hosts that drift into warning or critical states are surfaced visually. You don’t have to comb through every host to see where trouble lurks.
- Enriched metadata: Every host record includes labels like cluster name, node name, and job. This metadata ensures context is always present for correlation with application telemetry.
Access the Hosts dashboard at Discover > Hosts in Last9 today!

