

Monitoring ephemeral storage metrics in Kubernetes is essential to ensure stable operations as containers dynamically use storage that can quickly fill up. Keeping an eye on these metrics helps prevent potential issues such as storage shortages, performance slowdowns, or even pod evictions.
In this blog, we’ll explore how to effectively track ephemeral storage usage in your Kubernetes environment, helping you maintain optimal resource management, minimize bottlenecks, and avoid disruptions in your applications.
What is Ephemeral Storage in Kubernetes?
Ephemeral storage in Kubernetes refers to the temporary storage allocated to pods for managing their internal processes. Unlike persistent storage, which remains across pod restarts and is used for long-term data, ephemeral storage is transient.
It’s typically used for caching, logs, and temporary files generated by applications running in pods.
Also, check out our complete guide on kube-state-metrics for more insights on simplifying Kubernetes observability.
Challenges with monitoring Ephemeral Storage respective to running pods
The challenge with ephemeral storage arises from its temporary nature. When a pod is terminated, the data in ephemeral storage is lost. Moreover, unmonitored ephemeral storage can lead to node-level issues like resource exhaustion, impacting not just one pod but potentially the entire cluster.
This makes monitoring ephemeral storage critical for avoiding disruptions and ensuring optimal performance.
However, Kubernetes’ default monitoring tool i.e. kube-state-metrics provides limited visibility into ephemeral storage usage. This gap in monitoring can lead to unforeseen issues, including pod eviction and application downtime due to storage overconsumption.
Understanding how your pods consume ephemeral storage is key to preemptively managing these risks and maintaining a healthy Kubernetes environment.
This has been an open issue for quite a while : https://github.com/kubernetes/kubernetes/issues/69507
K8s Ephemeral Storage Metrics
A new project was created to address the aforementioned issue which is a prometheus ephemeral storage metric exporter for pods, containers, nodes, and volumes.
This does not monitor CSI backed ephemeral storage ex. Generic ephemeral volumes
It functions by collecting and exposing metrics related to the ephemeral storage used by each pod, allowing for a granular understanding of storage utilization patterns therefore ensuring that ephemeral storage usage is not a blind spot in your Kubernetes cluster management.
Installation & Setup
Before proceeding, ensure your Kubernetes cluster is running a compatible version since the exporter is designed for recent Kubernetes releases.
Prometheus and Grafana must also be set up beforehand, as the k8s-ephemeral-storage-metrics integrate with Prometheus.
The exporter is available as a Helm chart, and you can follow the installation instructions in the repository to set it up within your Kubernetes cluster.
To install the k8s-ephemeral-storage-metrics Helm chart, follow these steps:
- Add the Helm repository:
helm repo add k8s-ephemeral-storage-metrics https://jmcgrath207.github.io/k8s-ephemeral-storage-metrics/chart- Update the Helm repositories:
helm repo update- Install or upgrade the chart in your Kubernetes cluster:
helm upgrade --install my-deployment k8s-ephemeral-storage-metrics/k8s-ephemeral-storage-metricsThis will deploy the exporter for ephemeral storage metrics in your Kubernetes environment.
Verification Checklist
After installation, confirm the following to ensure successful deployment:
- Kubernetes Service: Run the command below to verify the Kubernetes service:
kubectl get svc k8s-ephemeral-storage-metrics -n default --kubeconfig=$KUBECONFIG- Expected output:
NAME TYPE CLUSTER-IP EXTERNAL-IP PORT(S) AGEk8s-ephemeral-storage-metrics ClusterIP 172.20.128.15 <none> 9100/TCP 30sThis confirms that the service is running and ready to collect metrics.
K8s Deployment
To verify the deployment of the ephemeral storage metrics, run the following command:
kubectl get deployment k8s-ephemeral-storage-metrics -n default --kubeconfig=$KUBECONFIGYou should see output similar to this:
NAME READY UP-TO-DATE AVAILABLE AGEk8s-ephemeral-storage-metrics 1/1 1 1 30sK8s Pods
To verify the pods running for the ephemeral storage metrics, use the following command:
kubectl get pods -n default --kubeconfig=$KUBECONFIG -l app.kubernetes.io/instance=k8s-ephemeral-storage-metricsYou should see output like this:
NAME READY STATUS RESTARTS AGEk8s-ephemeral-storage-metrics-fbf74b85d-9f6bp 1/1 Running 0 30sOnce verification is complete, the k8s-ephemeral-storage-metrics service will be exposing metrics on port 9100, which will need to be scraped.
Custom ServiceMonitor Configuration & Installation
The Prometheus Operator has become the go-to method for managing Prometheus in Kubernetes.
To effectively monitor ephemeral storage metrics, you’ll need to create a specific ServiceMonitor resource that points to the k8s-ephemeral-storage-metrics service and its endpoints. This configuration allows Prometheus to scrape the necessary metrics.
- To get started, copy the
k8s-ephemeral-storage-metrics-service-monitor.yamlinto a local file with the same name.
Ensure that the metadata → labels of the ServiceMonitor matches the selector configuration in your prometheus.yaml. Else this service monitor will not work.
apiVersion: monitoring.coreos.com/v1kind: ServiceMonitormetadata: name: k8s-ephemeral-storage-metrics labels: app.kubernetes.io/name: k8s-ephemeral-storage-metricsspec: namespaceSelector: any: false matchNames: [ "default" ] # Change this to the namespace where you installed k8s-ephemeral-storage-metrics selector: matchLabels: app.kubernetes.io/instance: k8s-ephemeral-storage-metrics app.kubernetes.io/managed-by: Helm app.kubernetes.io/name: k8s-ephemeral-storage-metrics endpoints: - interval: 30s port: metrics metricRelabelings: - sourceLabels: [ __name__, exported_container ] regex: ".*;(.+)" targetLabel: container - sourceLabels: [ __name__, exported_namespace ] regex: ".*;(.+)" targetLabel: namespace - sourceLabels: [ __name__, exported_pod ] regex: ".*;(.+)" targetLabel: pod- Apply the above config in your desired namespace
kubectl apply -f k8s-ephemeral-storage-metrics-service-monitor.yaml -n default --kubeconfig=$KUBECONFIG- Verify as below
kubectl get ServiceMonitor k8s-ephemeral-storage-metrics -n defaultNAME AGEk8s-ephemeral-storage-metrics 10sWiring it all up
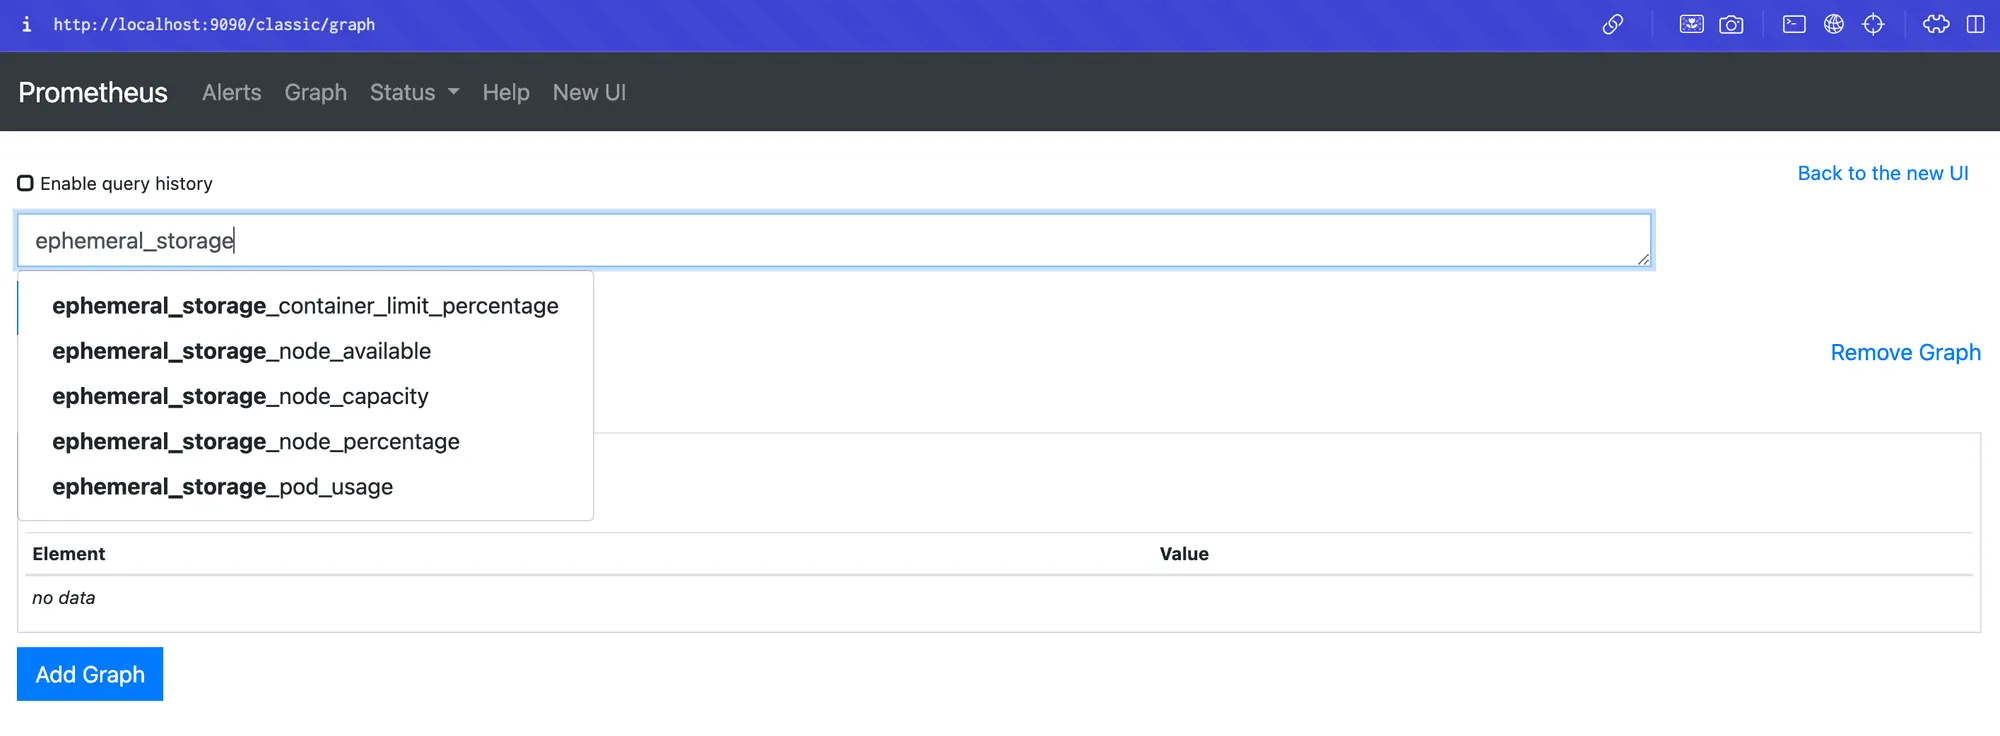
You can access the Prometheus UI to view the metrics prefixed with ephemeral_storage. This will help you monitor the ephemeral storage metrics collected by the k8s-ephemeral-storage-metrics exporter.
Important Considerations:
- The setup relies on the flawless operation of Prometheus’ service discovery.
- Accurate label matching is crucial; labels in the ServiceMonitor’s selector must match the metadata on the targeted services exactly.
- Any discrepancies in these labels can disrupt the service discovery process. Such disruptions can impact the effectiveness of monitoring.
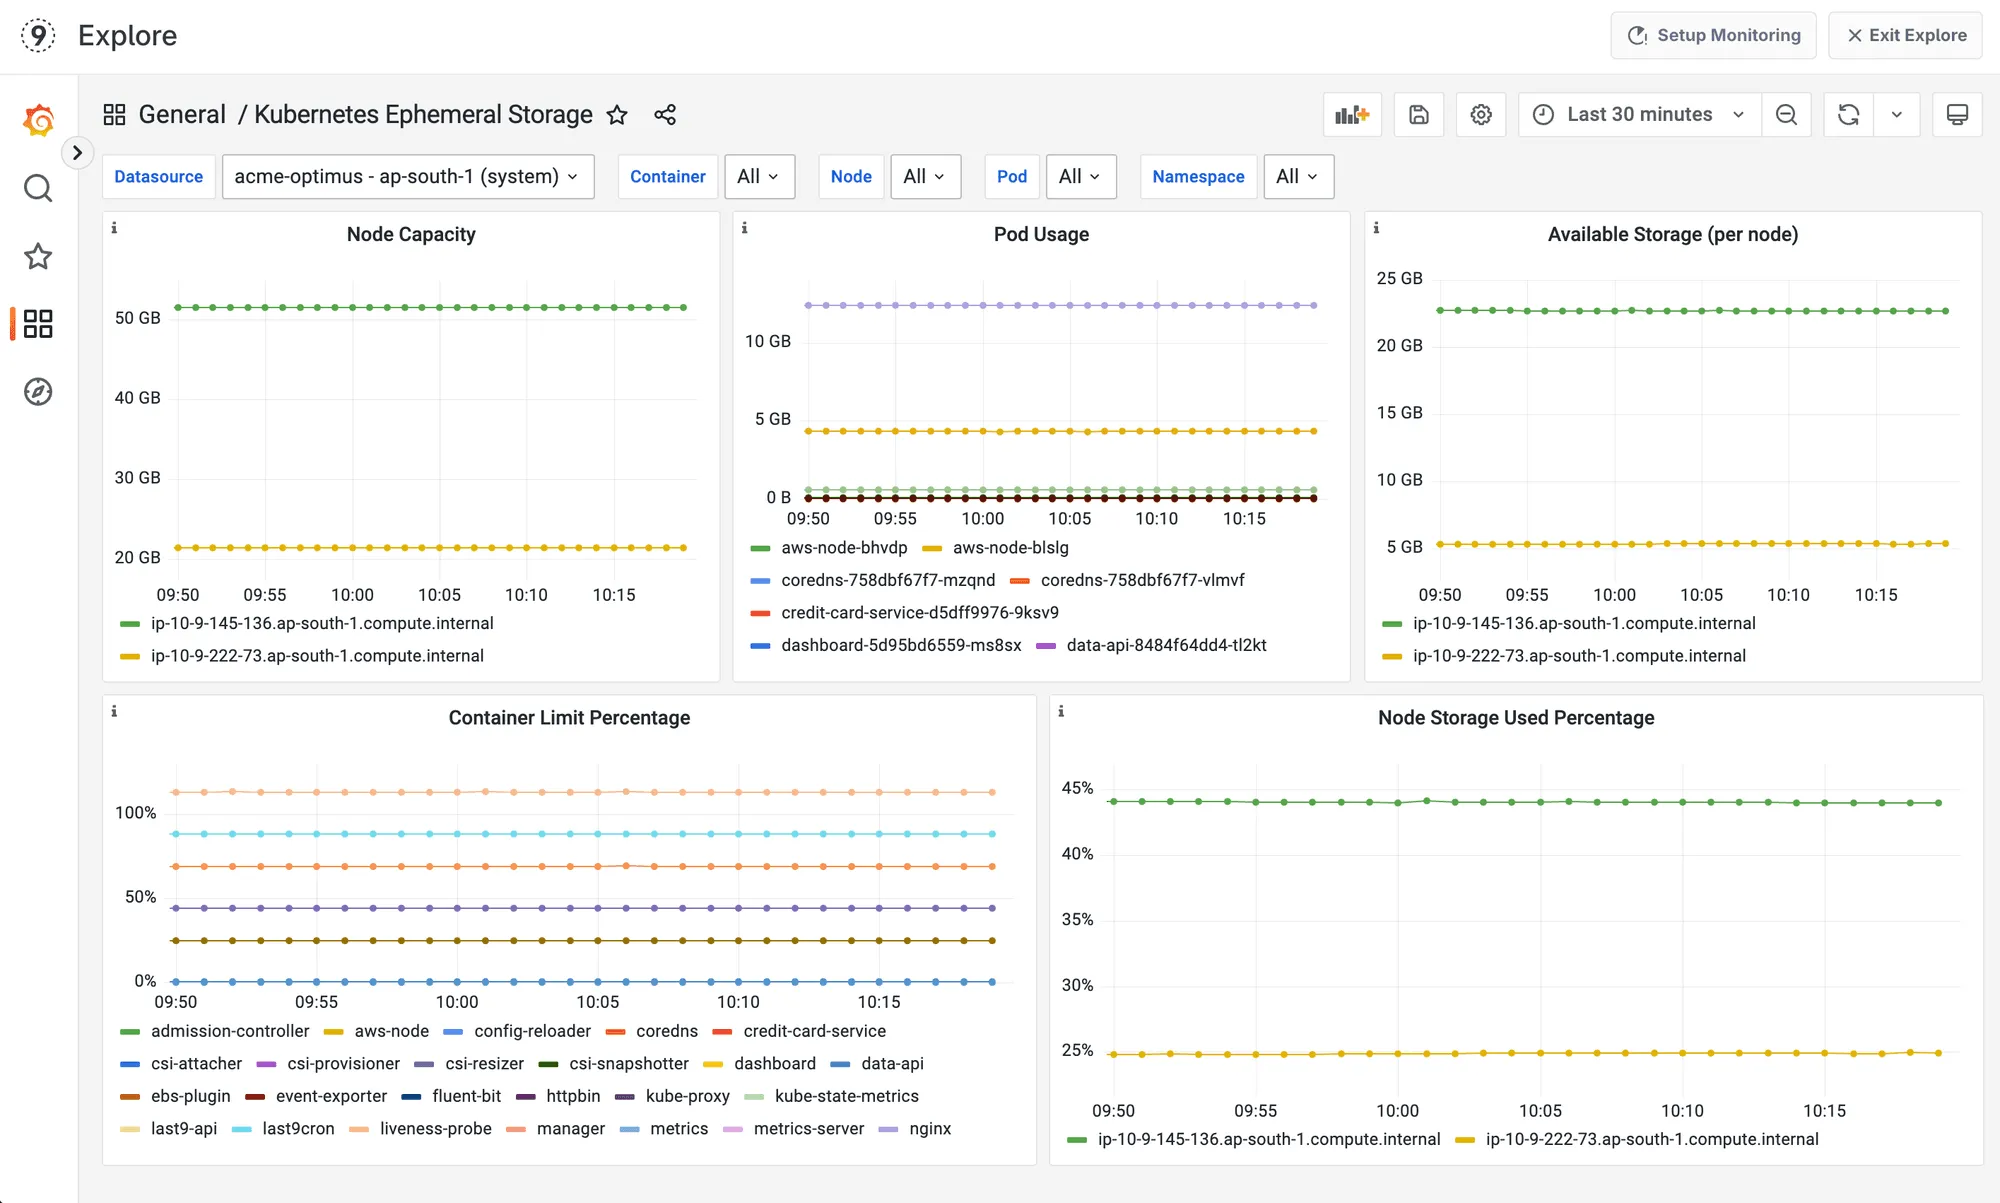
Dashboards
Conclusion
Monitoring ephemeral storage in Kubernetes is essential for ensuring application performance and stability. The k8s-ephemeral-storage-metrics tool provides valuable insights into ephemeral storage usage at the pod level.
Integrating this tool into your Kubernetes strategy allows for proactive resource management, disruption prevention, and improved cluster health. The k8s-ephemeral-storage-metrics tool helps you effectively navigate the complexities of ephemeral storage, ensuring that your Kubernetes environments run efficiently and resiliently.
We’d love to hear your SRE experiences related to reliability, observability, or monitoring. Join the SRE Discord community to engage with peers!

