

When building robust monitoring solutions, you'll eventually face the Loki vs Prometheus question. Both are powerful open-source tools that serve different yet complementary purposes in the observability landscape.
This guide breaks down their strengths, differences, and how to choose between them (or use them together) for your specific needs.
What Are Loki and Prometheus?
Prometheus: The Metrics Powerhouse
Prometheus is an open-source monitoring and alerting system built specifically for reliability. Created in 2012 at SoundCloud, it's now a standalone project maintained by the Cloud Native Computing Foundation (CNCF).
At its core, Prometheus collects and stores numerical time-series data (metrics) such as CPU usage, memory consumption, request counts, and error rates. It uses a pull-based model where it scrapes metrics from instrumented applications and services at regular intervals.
Loki: The Log Aggregator
Loki, created by Grafana Labs in 2018, is a horizontally scalable, cost-effective log aggregation system. Inspired by Prometheus, Loki indexes metadata about your logs rather than the full text, making it significantly more resource-efficient than traditional logging systems.
Loki uses a push-based model where agents (typically Promtail) collect logs and send them to the Loki server. It's designed to work seamlessly with Grafana for visualization.
Key Differences Between Loki and Prometheus
Data Types and Collection Methods
Prometheus:
- Collects numerical metrics data
- Uses a pull-based model (scrapes targets)
- Focuses on structured time-series metrics
- Strong in real-time monitoring of system performance
Loki:
- Collects log data (text)
- Uses a push-based model (agents send logs)
- Specialized for unstructured log text
- Excels at debugging and forensic investigation
Storage Approach and Efficiency
Prometheus:
- Stores full metrics data
- Compressed time-series database
- Efficient for numerical data
- Built-in data retention policies
Loki:
- Only indexes metadata, not full log content
- Uses object storage for logs (S3, GCS, etc.)
- Extremely storage-efficient
- Pay mostly for what you search, not what you store
Query Languages
Prometheus:
- Uses PromQL (Prometheus Query Language)
- Designed for time-series data analysis
- Strong mathematical and statistical functions
Examples:
rate(http_requests_total{status="500"}[5m])sum by (instance) (node_cpu_seconds_total{mode="idle"})Loki:
- Uses LogQL (inspired by PromQL)
- Specialized for log filtering and searching
- Can extract metrics from logs
Examples:
{app="frontend"} |= "error"sum by (pod) (rate({app="nginx"}[5m] |= "GET"))When to Use Prometheus vs Loki
Choose Prometheus When You Need:
- Real-time monitoring and alerting on system performance
- Custom instrumentation of your applications
- Mathematical operations on time-series data
- Alerting based on metric thresholds
- Historical trends analysis of numerical data
Choose Loki When You Need:
- Cost-effective log storage at scale
- Text-based debugging information
- Forensic investigation after incidents
- Lightweight log aggregation
- Integration with existing Grafana dashboards
Better Together: The Complementary Approach
In reality, you shouldn't have to choose between Loki and Prometheus. They solve different problems and work extremely well together as part of a comprehensive observability stack.
A common architecture looks like this:
| Component | Purpose | Integration Points |
|---|---|---|
| Prometheus | Metrics collection and alerting | Sends alerts to Alertmanager, visualized in Grafana |
| Loki | Log aggregation | Receives logs via Promtail, visualized in Grafana |
| Grafana | Visualization | Unifies metrics from Prometheus and logs from Loki |
| Alertmanager | Alert routing and management | Receives alerts from Prometheus, handles notifications |
This setup gives you the best of both worlds: powerful metric-based monitoring and cost-effective log storage.
Setting Up Prometheus: Quick Start Guide
Getting Prometheus up and running involves a few key steps:
- Access the UI: Open http://localhost:9090 in your browser
Start Prometheus:
./prometheus --config.file=prometheus.ymlConfigure Your Targets (prometheus.yml):
global:
  scrape_interval: 15s

scrape_configs:
  - job_name: 'prometheus'
    static_configs:
      - targets: ['localhost:9090']

  - job_name: 'application'
    static_configs:
      - targets: ['application:8080']
Download and Install Prometheus:
wget https://github.com/prometheus/prometheus/releases/download/v2.37.0/prometheus-2.37.0.linux-amd64.tar.gz
tar xvfz prometheus-2.37.0.linux-amd64.tar.gz
cd prometheus-2.37.0.linux-amd64/
Setting Up Loki: Quick Start Guide
Setting up Loki involves similar steps:
Start Promtail:
./promtail-linux-amd64 -config.file=promtail-config.yamlConfigure Promtail (promtail-config.yaml):
server:
  http_listen_port: 9080
  grpc_listen_port: 0

positions:
  filename: /tmp/positions.yaml

clients:
  - url: http://localhost:3100/loki/api/v1/push

scrape_configs:
  - job_name: system
    static_configs:
      - targets:
          - localhost
        labels:
          job: varlogs
          __path__: /var/log/*log
Install and Configure Promtail (the agent that sends logs to Loki):
wget https://github.com/grafana/loki/releases/download/v2.7.0/promtail-linux-amd64.zip
unzip promtail-linux-amd64.zip
chmod a+x promtail-linux-amd64
Start Loki:
./loki-linux-amd64 -config.file=loki-config.yamlConfigure Loki (loki-config.yaml):
auth_enabled: false

server:
  http_listen_port: 3100

ingester:
  lifecycler:
    ring:
      kvstore:
        store: inmemory
    final_sleep: 0s
  chunk_idle_period: 5m
  chunk_retain_period: 30s

schema_config:
  configs:
    - from: 2020-05-15
      store: boltdb-shipper
      object_store: filesystem
      schema: v11
      index:
        prefix: index_
        period: 24h

storage_config:
  boltdb_shipper:
    active_index_directory: /tmp/loki/boltdb-shipper-active
    cache_location: /tmp/loki/boltdb-shipper-cache
    cache_ttl: 24h
    shared_store: filesystem
  filesystem:
    directory: /tmp/loki/chunks

limits_config:
  enforce_metric_name: false
  reject_old_samples: true
  reject_old_samples_max_age: 168h
Download and Install Loki:
wget https://github.com/grafana/loki/releases/download/v2.7.0/loki-linux-amd64.zip
unzip loki-linux-amd64.zip
chmod a+x loki-linux-amd64Making the Most of Prometheus and Loki Together
Integrating with Grafana
The real magic happens when you bring Prometheus and Loki together in Grafana dashboards:
- Install Grafana
- Add Prometheus and Loki as data sources
- Create dashboards with panels from both sources
- Use dashboard variables to filter both metrics and logs by the same parameters
Correlating Metrics and Logs
When troubleshooting, you often want to see both metrics and logs for the same event:
- Notice a spike in error rates in Prometheus metrics
- Use the same time range to filter logs in Loki
- Look for error messages that coincide with the metric spike
- Find the root cause by correlating the numerical evidence with the textual context
Extracting Metrics from Logs
Loki can actually bridge the gap by extracting metrics from logs:
sum by (status_code) (count_over_time({app="nginx"}[5m] |= "GET" | regexp `(?P<status_code>\d{3})`))This gives you the power to generate metrics from your logs when direct instrumentation isn't possible.
Performance Impact Considerations
Prometheus Resource Footprint
Prometheus is relatively lightweight but does require consideration:
- Memory Usage: Scales with the number of time series (cardinality)
- CPU Usage: Increases with query complexity and frequency
- Disk I/O: Tied to ingestion rate and retention period
- Network: Minimal impact from scraping targets
To minimize impact:
- Use appropriate scrape intervals (15-30s is common)
- Apply relabeling to reduce cardinality
- Set reasonable retention periods
Loki's Resource Efficiency
Loki was designed specifically to minimize resource usage:
- Memory Usage: Lower than traditional logging systems due to its indexing approach
- Storage Impact: Significantly reduced compared to full-text indexing systems
- Network: Primarily affected by log volume being sent from clients
Best practices for optimization:
- Configure appropriate retention and chunk sizes
- Use structured logging to make searches more efficient
- Apply label matchers to reduce the scope of queries
Monitoring Your Monitoring
A key practice is to monitor your monitoring systems themselves:
- Set up Prometheus to monitor itself (meta-monitoring)
- Track Loki's resource usage with Prometheus
- Create alerts for monitoring system health
Security Considerations
Securing Prometheus
Prometheus wasn't designed with built-in authentication, so you'll need to:
- Place it behind a reverse proxy for TLS/authentication
- Use network segmentation to control access
- Configure firewall rules to limit scrape target access
- Consider tools like oauth2-proxy for authentication
Securing Loki
Loki has more security features built in:
- Supports multi-tenancy out of the box
- Can be configured with TLS for encrypted communications
- Offers token-based authentication options
Overall Security Best Practices
For both systems:
- Run services with least-privilege accounts
- Regularly update to the latest versions
- Audit access to the query interfaces
- Consider the sensitivity of data being collected
Top Observability Solutions for Modern Infrastructure
The observability landscape extends beyond just metrics and logs. A complete observability stack typically combines multiple specialized tools to give you full visibility into your systems. Here's a curated selection of complementary solutions that work well alongside Prometheus and Loki:
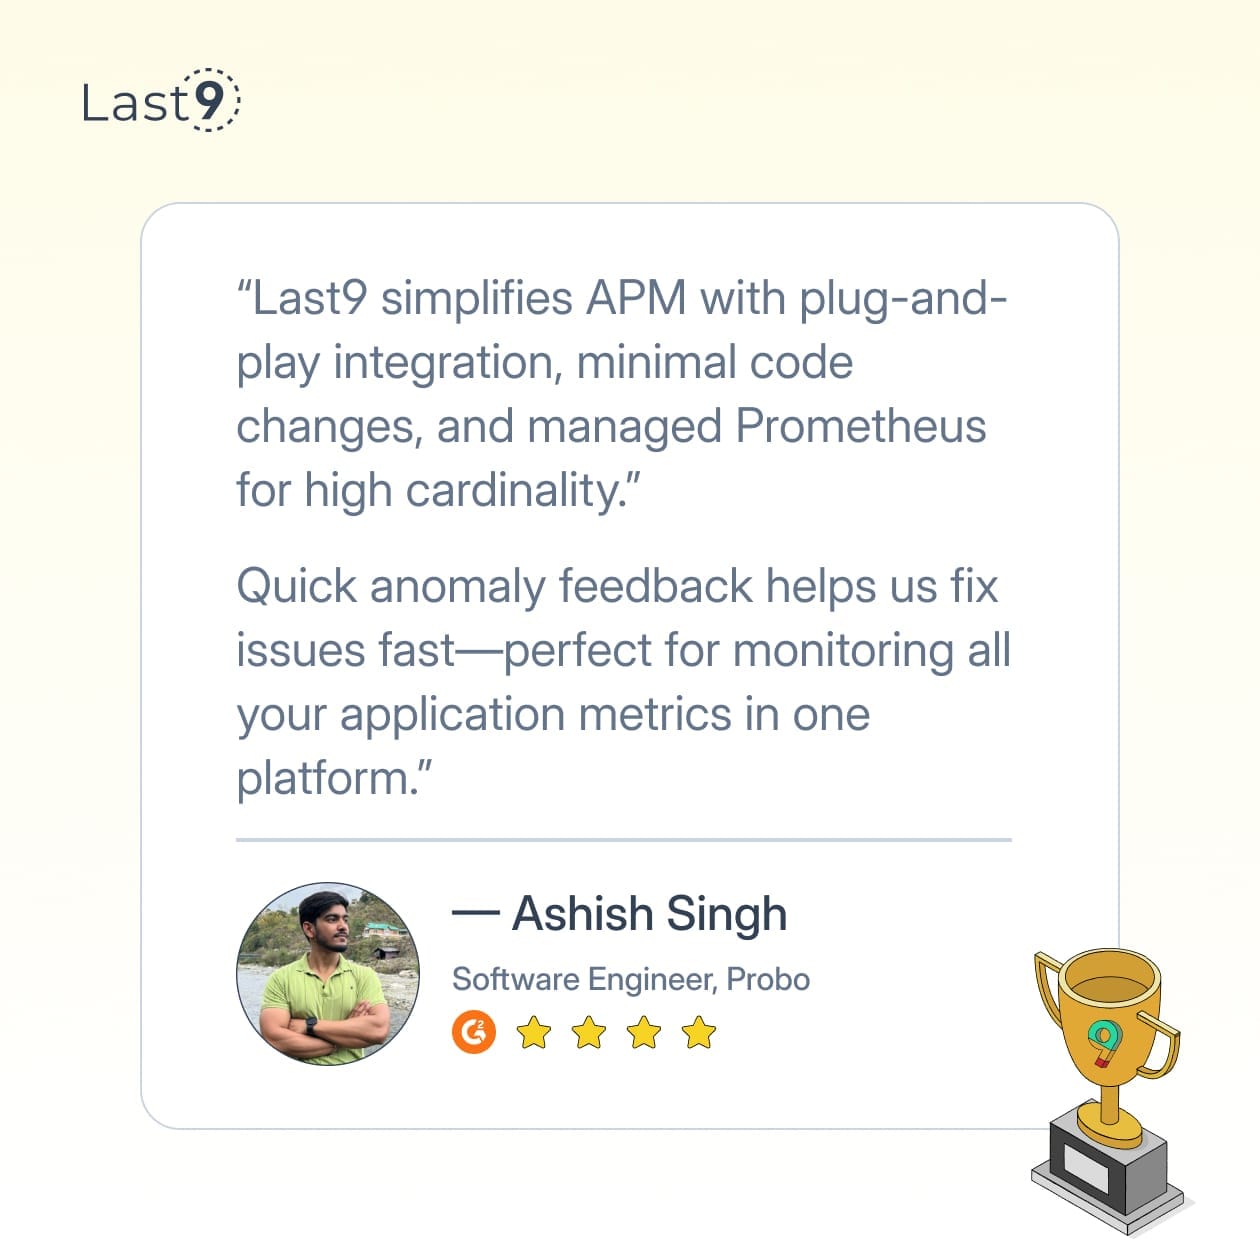
A managed observability platform that brings predictable pricing through its event-based model. Last9 excels at unifying telemetry data from various sources, including OpenTelemetry and Prometheus, making it particularly valuable for teams wanting consolidated observability without complexity.
Our platform has proven its reliability at scale, successfully monitoring many of the largest live-streaming events in history and serving companies like Probo, CleverTap, and Replit with high-cardinality observability solutions.
An end-to-end distributed tracing system that helps track request flows through complex microservice architectures. Jaeger provides visualization for service dependencies, performance bottlenecks, and latency issues, making it a powerful companion to metrics and logs when troubleshooting complex systems.
A high-scale, minimal-dependency distributed tracing backend designed to work seamlessly with Grafana, Prometheus, and Loki. Tempo allows cost-effective storage of distributed traces by leveraging object storage and only requiring an index based on trace ID, making it ideal for organizations with high trace volumes.
The industry standard for instrumentation and telemetry collection. This vendor-neutral framework provides consistent APIs, libraries, and collectors for gathering metrics, logs, and traces from your applications. OpenTelemetry serves as the foundation for many observability strategies, feeding data to specialized backends like Prometheus and Loki.
The alert routing and management component of the Prometheus ecosystem. Alertmanager handles grouping, silencing, and routing of alerts to the right notification channels, whether that's email, Slack, PagerDuty, or custom webhooks. It's essential for building a reliable alerting pipeline on top of your monitoring data.
A set of components that extend Prometheus with long-term storage capabilities, high availability, and global query view across multiple Prometheus instances. Thanos enables organizations to scale their Prometheus deployments without sacrificing reliability or query performance.
A highly scalable, multi-tenant Prometheus-compatible metrics solution developed by Grafana Labs. Mimir can handle massive metric volumes while maintaining query performance, making it suitable for large enterprises and SaaS providers looking to offer metrics-as-a-service.
Each of these tools fills a specific role in the observability ecosystem, and the right combination depends on your specific infrastructure, team expertise, and organizational needs.
Cloud-Native Integration
Kubernetes Compatibility
Both Prometheus and Loki shine in Kubernetes environments:
Prometheus with Kubernetes:
- Native service discovery for pods and services
- Works seamlessly with kube-state-metrics
- Prometheus Operator simplifies deployment and management
- Auto-configures scrape targets via annotations
Loki with Kubernetes:
- Promtail can run as a DaemonSet to collect container logs
- Automatic Kubernetes metadata labeling
- Works with the logging driver architecture
- Supports label propagation from Kubernetes objects
Integration with Service Mesh
Observability becomes even more powerful when combined with a service mesh:
- Prometheus can scrape Istio/Linkerd metrics endpoints
- Loki can collect sidecar proxy logs
- Combined with tracing, this creates complete service visibility
Serverless Environments
Even in serverless:
- Prometheus Pushgateway can handle ephemeral workloads
- Loki integrates with AWS CloudWatch, Google Cloud Logging, and Azure Monitor
Moving from Traditional Monitoring to Prometheus
When migrating from legacy monitoring systems:
- Parallel Implementation: Run both systems side by side initially
- Start Small: Begin with non-critical services
- Instrumentation Mapping: Map existing checks to Prometheus metrics
- Alert Testing: Validate alert configurations in a sandbox
- Gradual Rollout: Phase out the old system as confidence grows
Transitioning to Loki from Other Logging Solutions
When switching from ELK Stack or other logging systems:
- Storage Planning: Prepare object storage buckets
- Agent Deployment: Deploy Promtail alongside existing log shippers
- Query Adaptation: Translate existing queries to LogQL
- Dashboard Migration: Rebuild critical dashboards in Grafana
- Historical Data: Consider strategies for historical log access
Cost Comparison and Operational Overhead
Prometheus Scaling Challenges and Solutions
Prometheus works well for single-instance monitoring but faces challenges at scale:
- Challenge: Long-term storage of metrics.
Solution: Thanos or Cortex for distributed storage
- Challenge: High-availability
Solution: Prometheus federation or the Thanos sidecar approach
- Challenge: Multi-tenancy
Solution: Mimir for tenant isolation
Loki Scaling Strategies
Loki was designed for scale from day one, but still needs careful planning:
- Challenge: High-volume log ingestion
Solution: Scale Promtail horizontally and use a load balancer
- Challenge: Query performance on large datasets
Solution: Tune retention policies and use appropriate index periods
- Challenge: Storage growth
Solution: Implement log rotation and compression
Conclusion
Loki and Prometheus aren't competing solutions but complementary tools that solve different aspects of the observability challenge. Prometheus gives you numerical insights into system performance, while Loki provides the contextual information needed to understand what's happening behind those numbers.
FAQs
What's the main difference between Loki and Prometheus?
Prometheus collects numerical metrics while Loki collects text logs. Prometheus uses a pull model to scrape data, while Loki receives pushed logs. They serve different but complementary purposes in your observability stack.
Can Loki replace Prometheus?
No, they serve different purposes. Loki handles logs while Prometheus handles metrics. For complete observability, you typically need both.
Is Loki cheaper to run than other logging solutions?
Yes, Loki is designed to be cost-effective by indexing metadata rather than full log content, which significantly reduces storage requirements.
How do Prometheus alerts work with Loki?
While Prometheus handles alerting on metrics, you can use Loki's LogQL in Grafana to set up alerts based on log patterns. For a unified alerting system, Grafana can manage alerts from both sources.
Can I use Prometheus and Loki without Grafana?
Yes, both have their own basic UIs, but Grafana provides a much richer experience and allows correlation between metrics and logs, which is incredibly valuable for troubleshooting.
How do I decide which metrics to collect in Prometheus?
Start with the USE method (Utilization, Saturation, Errors) for infrastructure and the RED method (Rate, Errors, Duration) for services/applications. These provide solid baselines for monitoring.
What impact will Prometheus have on my production systems?
When properly configured, Prometheus has minimal impact. A typical scrape operation uses little bandwidth and CPU. The main consideration is the number of metrics being collected (cardinality), which affects Prometheus itself more than your monitored systems.
How do I handle high availability with these tools?
For Prometheus, use federation, Thanos, or Mimir for high availability. Loki can be deployed in microservices mode with component redundancy or as a monolith behind a load balancer.
Can I monitor serverless or ephemeral workloads?
Yes. For Prometheus, use the Pushgateway for ephemeral workloads. For Loki, configure your serverless functions to ship logs to your Loki instance or use cloud provider integrations.
How do I manage data retention costs over time?
Implement tiered storage strategies where recent data stays in fast storage, while older data moves to cheaper, slower storage. Use downsampling for Prometheus and compaction for Loki to reduce long-term storage costs.
Are these tools suitable for regulated industries?
Yes, but additional considerations apply. You may need to implement encryption, access controls, and audit logging. Both tools can be configured to comply with regulatory requirements like GDPR, HIPAA, or PCI-DSS when properly implemented.

