

Ever found yourself buried in endless log files, trying to piece together what went wrong?
For DevOps engineers, log analysis isn’t just about debugging—it’s a crucial skill for maintaining reliable systems and catching issues before they escalate.
In this guide, we’ll cover everything you need to know about log file analysis, from the fundamentals to the best tools available today.
What Is Log File Analysis?
Log file analysis is the process of examining the records your systems generate to understand what’s happening under the hood. Consider logs as your system’s diary—they record everything that happens, from routine operations to those mysterious crashes that wake you up at 3 AM.
Unlike raw monitoring data, logs tell stories. They capture sequences of events with context, timestamps, and often the exact error messages you need to solve problems fast.
Learn how to make the most of your logs in our guide: Logfiles: What They Reveal and How to Use Them.
Why DevOps Engineers Should Care About Logs
As a DevOps engineer, you’re the bridge between development and operations. Here’s why log analysis matters for your day-to-day:
- Faster troubleshooting: Find the root cause of issues in minutes instead of hours
- Proactive problem-solving: Catch warning signs before they become downtime
- Security monitoring: Spot suspicious access patterns or potential breaches
- Performance optimization: Identify bottlenecks and slow components
- Compliance requirements: Maintain audit trails for regulatory purposes
A DevOps team without solid log analysis is like a detective with no clues—you’re just guessing.
The Anatomy of a Log File
Before jumping into analysis techniques, let’s break down what you’re looking at. Most log entries contain:
- Timestamp: When the event happened
- Severity level: How serious the event is (INFO, WARNING, ERROR, etc.)
- Source: Which component or service generated the log
- Message: The actual description of what happened
Here’s a sample log entry from a web server:
2023-11-10T15:42:18.345Z INFO [nginx] 192.168.1.101 - - [10/Nov/2023:15:42:18 +0000] "GET /api/v1/users HTTP/1.1" 200 1024 "-" "Mozilla/5.0"This tells you:
- When the request happened
- The severity (just informational)
- The source (nginx)
- The client IP
- The HTTP request details
- The response code (200 - success)
- The response size (1024 bytes)
- The user agent (browser info)
Different systems format logs differently, but once you understand the pattern, you can extract the meaningful bits quickly.
If you’re looking to make log data more useful, our guide on log parsing can help you with the right tools and techniques.
Log Analysis Techniques Every DevOps Engineer Should Know
1. Filtering and Searching
The most basic technique is simply finding the relevant logs. Using tools like grep, sed, and awk will save you tons of time:
# Find all ERROR level logsgrep "ERROR" application.log
# Find errors during a specific time windowgrep "2023-11-10T15:4" application.log | grep "ERROR"
# Count occurrences of specific eventsgrep "connection refused" application.log | wc -l
2. Log Correlation
The real power comes when you connect logs across different services. For example, tracing a user request from your load balancer through your API service to your database.
This is where logging IDs like request IDs or trace IDs become crucial. With a unique ID that follows the request through your entire system, you can reconstruct the full journey.
3. Pattern Recognition
As you gain experience, you’ll start noticing patterns in your logs:
- Spikes in error rates during deploys
- Slow database queries at specific times
- Authentication failures from particular IP ranges
These patterns are gold—they help you predict issues before they happen.
4. Visualization
Humans are visual creatures. Converting log data into charts and graphs makes trends jump out:
- Error rates over time
- Response time distributions
- Geographic sources of traffic
A good dashboard can show you in seconds what would take hours to spot in raw logs.
Our guide on real-time error log monitoring helps you stay ahead of your issues.
Essential Log Analysis Tools for DevOps
Let’s talk about the tools that will make your life easier. These range from simple command-line utilities to enterprise-grade platforms.
Command-Line Basic Tools
Every DevOps engineer should be comfortable with these fundamental tools:
- grep/awk/sed: The Swiss Army knife for text processing
- tail -f: For watching logs in real-time
- jq: For parsing and manipulating JSON logs
These basics will get you far, but for production systems, you’ll want more horsepower.
Log Collection and Aggregation
When you’re dealing with distributed systems, centralized logging becomes essential:
- Elasticsearch, Logstash, Kibana (ELK Stack): The open-source powerhouse
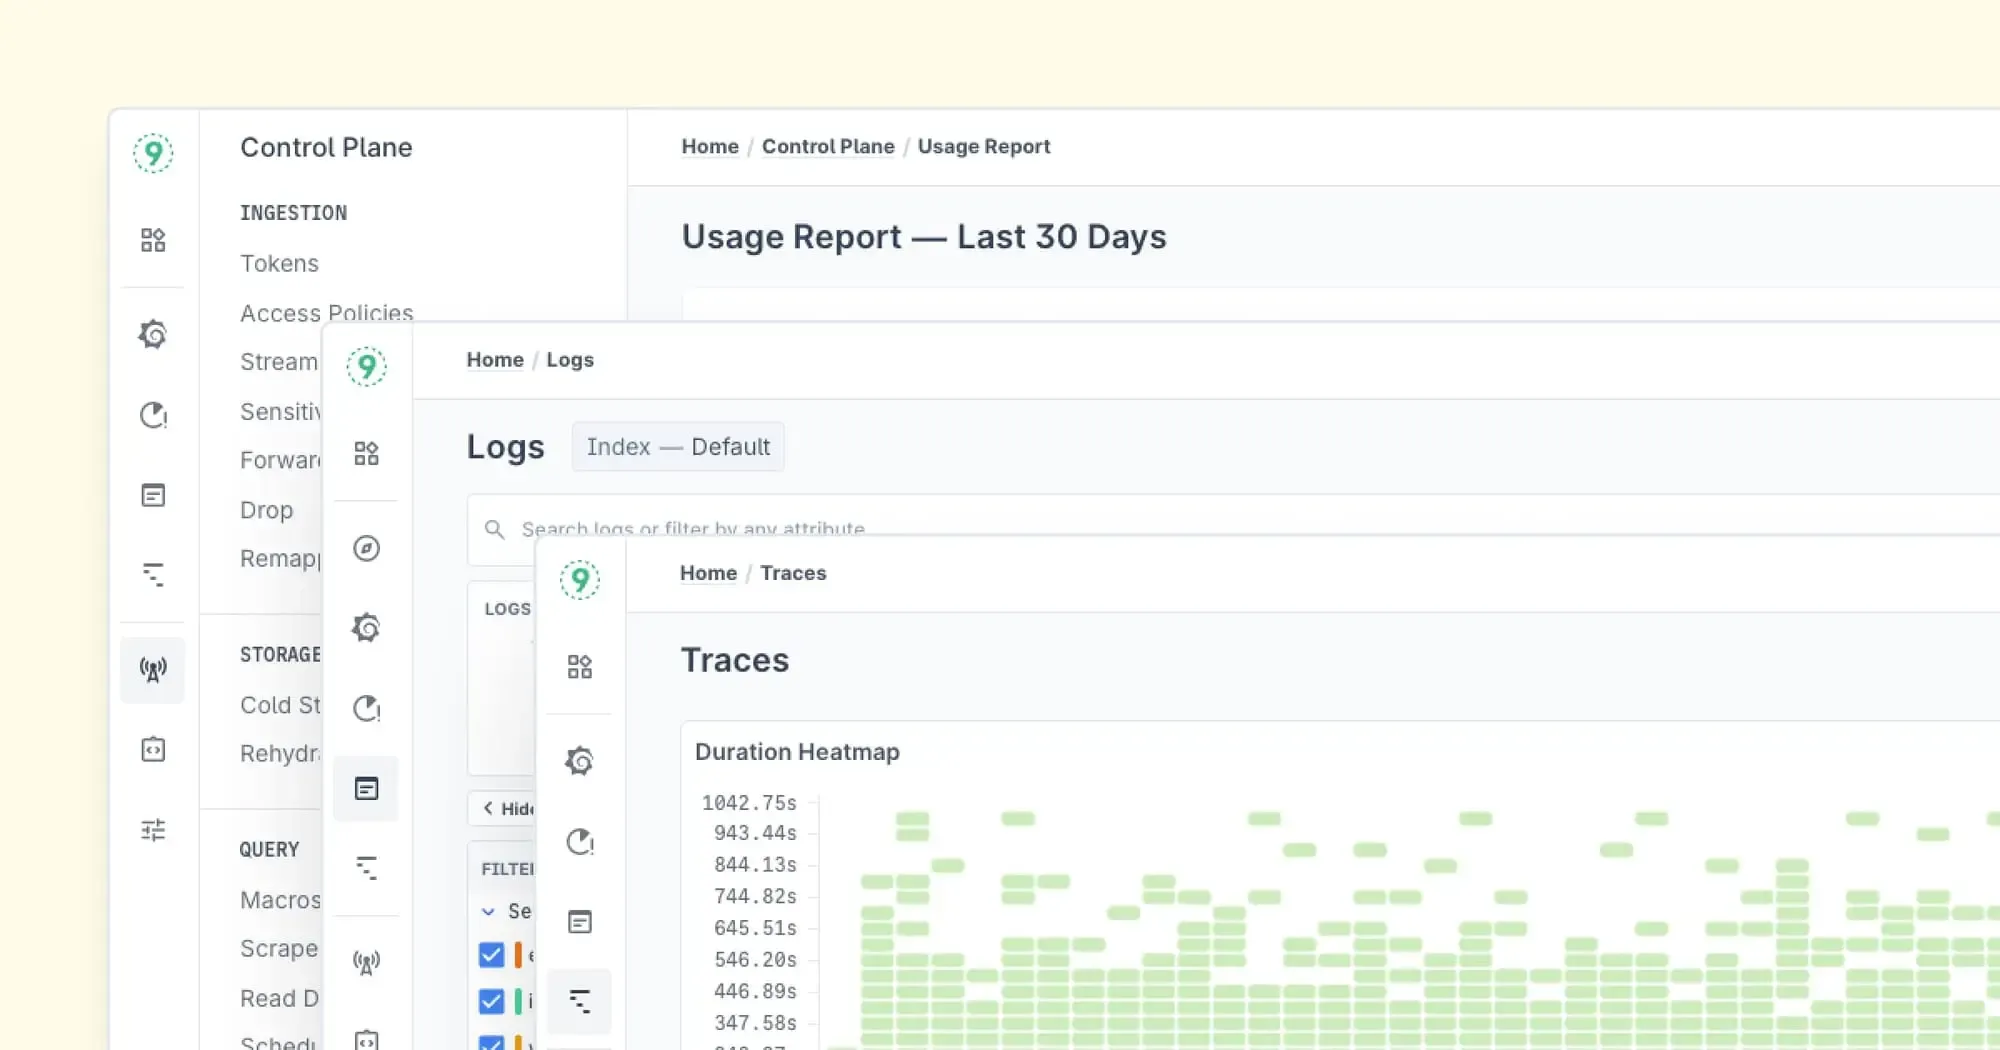
- Last9: Designed for reliability and scale, bringing deep observability insights with minimal overhead
- Graylog: Great for medium-sized deployments
- Fluentd/Fluent Bit: Lightweight log collectors
- Loki: Prometheus-inspired logging
Full-Stack Observability Platforms
For serious production environments, you need tools that connect logs with metrics and traces:
- Last9: The rising star offering exceptional context-aware log analysis
- New Relic: Application-focused monitoring with log integration
- Splunk: The enterprise standard with advanced analysis capabilities
Log Analysis Best Practices for DevOps Teams
Getting the most from your logs isn’t just about tools—it’s about the process. Here are some best practices to follow:
1. Structured Logging
Ditch messy free-text logs in favor of structured formats like JSON. Structured logs are easier to parse, search, and analyze programmatically.
{ "timestamp": "2023-11-10T15:42:18.345Z", "level": "ERROR", "service": "payment-api", "message": "Transaction failed", "error_code": "INSUFFICIENT_FUNDS", "user_id": "usr_123456", "request_id": "req_789abc"}2. Consistent Log Levels
Establish clear guidelines for when to use each log level:
- TRACE: Fine-grained debug information
- DEBUG: Developer-focused troubleshooting info
- INFO: Normal system operations
- WARNING: Potential issues that don’t affect functionality
- ERROR: Failed operations that impact users
- FATAL/CRITICAL: System-wide failures requiring immediate attention
3. Smart Sampling
Not all logs are created equal. For high-volume systems, consider:
- Logging all errors and warnings
- Sampling routine operations (e.g., log 1% of successful API calls)
- Full logging during incident response
4. Retention Policies
Define how long you keep logs based on:
- Compliance requirements
- Troubleshooting needs
- Storage costs
A common approach is tiered retention:
- 7-14 days of full logs for active troubleshooting
- 30-90 days of filtered logs for trend analysis
- 1+ years of security and audit logs for compliance
For better log management and easier debugging, check out our guide on structured logging.
Common Log Analysis Challenges (And How to Solve Them)
1. Volume Overload
Problem: Too many logs to process effectively
Solution:
- Implement smart filtering at collection time
- Use log levels appropriately
- Set up aggregation to detect patterns instead of individual events
2. Missing Context
Problem: Logs don’t contain enough information to understand the issue
Solution:
- Add contextual data to logs (user IDs, request IDs, session info)
- Correlate logs with metrics and traces
- Enrich logs with system state data
3. Inconsistent Formats
Problem: Different systems log in different formats, making correlation difficult
Solution:
- Standardize logging formats across services
- Use log shippers that can normalize different formats
- Implement a service mesh for uniform telemetry
Practical Log Analysis Scenarios
Let’s walk through a practical example of how log analysis helps solve real problems.
Scenario: Users report intermittent timeouts on your checkout page.
Step 1: Check web server logs for error patterns
grep "checkout" web-server.log | grep -i "error\|timeout\|failed"You notice several 504 Gateway Timeout errors.
Step 2: Look at the API service logs around those timestamps
grep "2023-11-10T15:4" api-service.log | grep "ERROR"The API logs show slow response times but no errors.
Step 3: Check database logs for the same period
grep "2023-11-10T15:4" database.logHere you find the smoking gun: “Connection pool exhausted” errors.
Diagnosis: During peak traffic, the API service keeps database connections open too long, exhausting the connection pool and causing timeouts.
Solution: Increase the database connection pool size and optimize API endpoints to release connections more quickly.
This entire troubleshooting flow might take 10-15 minutes with good log analysis practices, versus hours of guesswork without them.
Understanding patterns in your logs can help you troubleshoot faster and optimize system performance. Check out our guide on log analytics to learn how to make the most of your log data.
How to Setup Your First Log Analysis Pipeline
Here’s a starter setup for small to medium teams:
- Generate better logs: Implement structured logging in your applications
- Collect and ship: Set up Filebeat or Fluent Bit on your servers
- Aggregate and store: Send logs to Elasticsearch or Loki
- Visualize and analyze: Connect Kibana or Grafana for visualization
- Alert on patterns: Configure alerts for important error patterns
For teams ready for more advanced solutions, Last9 offers a simplified setup experience that can have you analyzing logs effectively in under a day.
How Last9 Improves Log Analysis for Modern Systems
Here’s what sets us apart:
- Context-Rich Analysis: Last9 automatically connects logs to your infrastructure metadata, giving you the full picture of what was happening when issues occurred
- Signal vs. Noise: Their intelligent filtering helps focus on actionable insights rather than drowning in log volume
- Cost Efficiency: Smart indexing and storage optimization keep your logging budget in check
- Integration Ecosystem: Plays well with your existing DevOps toolchain
- Developer-Centric UX: Built by engineers who understand the DevOps workflow
For teams wanting to move beyond basic log analysis to truly actionable insights, Last9 offers a compelling solution that balances power with usability.
Wrapping Up
Log file analysis might seem overwhelming at first, but it’s a skill that pays daily dividends in your DevOps career. Start small, pick the right tools, and build your expertise step by step.
Remember the mantra: “Good logs tell stories. Great logs solve mysteries.”
What logging challenges is your team facing? Share with us in our Discord community where you can chat about this with other developers!
FAQs
1. What is log file analysis?
Log file analysis involves examining system logs to identify errors, performance issues, and security threats. It helps engineers troubleshoot problems and gain insights into system behavior.
2. Why is log analysis important?
It provides visibility into system health, helps in debugging, detects security incidents, and optimizes performance by identifying inefficiencies.
3. What are the different types of logs?
- System logs: Capture OS-level events.
- Application logs: Record software-specific events.
- Security logs: Track authentication and access events.
- Network logs: Monitor traffic and connections.
4. What are some common challenges in log file analysis?
- High log volume, making storage and processing difficult.
- Unstructured or inconsistent log formats.
- Lack of correlation between logs, metrics, and traces.
- Finding relevant information quickly in large datasets.
5. Which tools are commonly used for log analysis?
- ELK Stack (Elasticsearch, Logstash, Kibana) – A powerful open-source solution.
- Graylog – A great choice for medium-sized deployments.
- Fluentd/Fluent Bit – Lightweight and efficient log collectors.
- Loki – A Prometheus-inspired log aggregation tool.
- Last9 – Enabling high-cardinality log analysis and observability at scale.
6. How do you collect and aggregate logs?
Logs are collected using agents like Filebeat, Logstash, Fluentd, and Last9, which gather log data from servers, applications, and cloud services. These logs are then aggregated and centralized in storage solutions like Elasticsearch, Loki, or Last9’s observability platform for indexing, searching, and analysis.
7. What is structured logging, and why is it useful?
Structured logging formats log into key-value pairs (e.g., JSON), making it easier to query, filter, and analyze them systematically.
8. How can I monitor logs in real-time?
Use tools like Last9, Fluentd, or Logstash to stream logs in real time, set up alerts, and detect anomalies as they occur.
9. What’s the difference between logging, monitoring, and tracing?
- Logging records discrete events and errors.
- Monitoring tracks system health and performance over time.
- Tracing follows requests across services to diagnose latency and failures.
10. How do I improve log analysis efficiency?
- Use structured logging for consistency.
- Apply filters to focus on relevant logs.
- Automate alerting for critical issues.
- Regularly review log retention policies to manage storage efficiently.

