
You're collecting logs. Probably a lot of them. Terabytes per day if you're running anything at reasonable scale. They flow into some storage backend, they sit there, and every now and then someone runs a query during an incident, finds what they need (or doesn't), and goes back to not thinking about logs until the next fire.
This is log storage, not log analytics. And the difference matters more than the naming suggests.
Log analytics is what happens when you stop treating logs as an insurance policy you hope to never use and start treating them as a continuous signal about your system's behavior. It's the difference between "we have the data somewhere" and "we're actually learning from it."
Most teams are firmly in the first camp. Here's what it takes to get to the second.
What is log analytics? Log analytics is the practice of querying, analyzing, and extracting patterns from log data — not just searching for a specific error, but understanding system behavior over time. It sits on top of log management (the collection/storage pipeline) and includes full-text search, pattern detection and clustering, anomaly identification, and logs-to-metrics conversion. The key tools are Elasticsearch/OpenSearch (best full-text search), Grafana Loki (cheapest storage, label-indexed), Splunk (most powerful query language via SPL), and Last9 (cost visibility with trace correlation). Structured JSON logging with trace IDs is the prerequisite that makes everything else work.
What Is Log Analytics?
Log analytics is the practice of querying, analyzing, and extracting patterns from log data — not just searching for a specific error, but understanding the shape of your system's behavior over time.
This is distinct from log management (the pipeline of collecting, processing, storing, and retaining logs) and log monitoring (alerting when specific log patterns appear). Log analytics sits on top of both. You need decent log management to do analytics, and analytics informs what you should be monitoring, but they're different activities.
At the simplest level, log analytics is a glorified grep. You search for an error message, you find it, you look at what happened around it. At its most sophisticated, it's automated pattern detection, anomaly identification, and statistical analysis across billions of log lines.
Here's the thing: grep actually scales surprisingly well for simple searches on small-to-medium log volumes. If you're running five services and can SSH into the boxes, grep and jq will serve you fine. The moment you can't, because you have too many services, too many logs, or the logs aren't on boxes you can access you need purpose-built tooling.
Core Capabilities of Log Analytics Tools
Full-Text Search and Structured Queries
The foundation. You need to find things in your logs, and how the tool handles search determines whether you get answers in seconds or minutes (or not at all).
The single biggest thing you can do to improve log analytics is structured logging.
JSON beats free-text, every time. A log line like {"timestamp":"2026-02-12T14:32:07Z","service":"payment","level":"error","user_id":"4829","error":"stripe_declined","status":402} is queryable across every field.
A log line like 2026-02-12 14:32:07 ERROR payment service: Stripe declined payment for user 4829 (status 402) requires parsing, regex, and prayer.
The query language matters too. LogQL (Loki), SPL (Splunk), KQL (Azure/Elastic), and Lucene (Elasticsearch) all have different strengths. LogQL is PromQL-like, which is familiar to Prometheus users. SPL is the most powerful but has a steep learning curve. KQL is approachable. Lucene is everywhere but showing its age for analytical queries.
If you're choosing a log analytics tool, spend thirty minutes writing real queries in each candidate. The syntax differences feel minor on slide decks and significant at 3 AM.
Pattern Detection and Clustering
This is where analytics moves beyond search. Instead of looking for a specific error, the tool automatically groups similar log lines and shows you patterns.
After a deployment, pattern detection answers: "What new error patterns appeared that weren't there before?" This matters because it catches the problems you didn't know to look for. Your deployment introduced a new timeout in a service you didn't think you changed? Pattern detection surfaces that as "new pattern: 47 occurrences of timeout in service-xyz in the last 30 minutes, first seen at 14:15."
Not every log analytics tool does this well. Some require you to define patterns manually. The good ones learn patterns automatically and flag anomalies.
Anomaly Detection
Related to pattern detection but focused on volume and frequency.
Volume anomalies: your error logs normally average 200 lines per minute, and suddenly they're at 2,000. Something changed. The tool should flag this without you having to set a manual threshold, because "normal" changes as your system evolves.
Pattern anomalies: a new error type appears that you've never seen before. This is particularly useful post-deployment — it tells you "something new is happening," not just "the same errors are happening more often."
The quality of anomaly detection varies wildly between tools. Some use simple statistical thresholds. Others use ML models that learn your system's baseline behavior. Neither is universally better — statistical thresholds are more predictable but require tuning, ML models adapt automatically but can produce confusing false positives.
Dashboards and Alerting
Logs-to-metrics conversion is an underappreciated capability. Extracting a numeric metric from log data (count of errors by service, P99 of a duration field logged in your application) lets you build dashboards and alerts on top of log data without instrumenting separate metrics.
This bridges the gap between "I can search for errors" and "I can see error trends over the last 30 days." Alert on log patterns, not just keywords — "alert me when the rate of 5xx log lines from the payment service exceeds 1% of total requests" is more useful than "alert me when a 500 error appears."
Log Analytics Tools Compared
Elasticsearch / OpenSearch
The workhorse. Elasticsearch has been the default log analytics backend for over a decade, and OpenSearch (the AWS-maintained fork) carries the same architecture forward.
Strengths: Full-text search is best-in-class — Elasticsearch was built for search, and it shows. The ecosystem is enormous (Kibana/OpenSearch Dashboards for visualization, Logstash/Filebeat for collection, thousands of community plugins). If you can describe a log analytics use case, someone has built it on Elasticsearch.
Considerations: Resource-intensive. Running an Elasticsearch cluster at scale requires significant CPU, memory, and storage. Cluster management (shards, replicas, index lifecycle, mapping explosions) is a skill in itself. Many teams that start with Elasticsearch end up spending more time managing Elasticsearch than analyzing logs. See the ELK stack deep dive for a fuller picture of the trade-offs, and OpenSearch vs Elasticsearch if you're deciding between the two forks.
Grafana Loki
The "grep for logs" philosophy. Loki indexes only metadata (labels), not the log content itself, which makes it dramatically cheaper to run than Elasticsearch.
Strengths: If you're already running Grafana for metrics, adding Loki for logs keeps everything in one UI. The LogQL query language feels natural to PromQL users. Storage costs are a fraction of Elasticsearch because you're storing compressed log chunks in object storage (S3/GCS) rather than maintaining inverted indices.
Considerations: The trade-off for cheap storage is slower full-text search. Loki is fast when you filter by labels first (show me logs from service=payment, level=error) but slow when you need to search across all logs for a specific string. This is fine for most operational use cases but limiting for security/forensic analysis where you need to search everything.
Last9 Logs
Strengths: The logs pipeline handles structured and semi-structured logs with schema-on-read flexibility. Built with the same control plane philosophy as the metrics pipeline — you can see and transform inflight logs into a structure, extract attributes or filter and drop them as needed before they hit storage. OpenTelemetry-native, which means your logs are automatically correlated with traces via trace IDs.
Where Last9 stands out for log analytics is the natural language query interface. Instead of writing query syntax from scratch, you type a plain-English question — something like "which customer ID has the highest error rate in the last hour" or "show me the top 5 endpoints by p99 latency" — and the system translates it into an aggregate query that runs directly on your log data. The result comes back as a table or chart, not a wall of raw log lines.
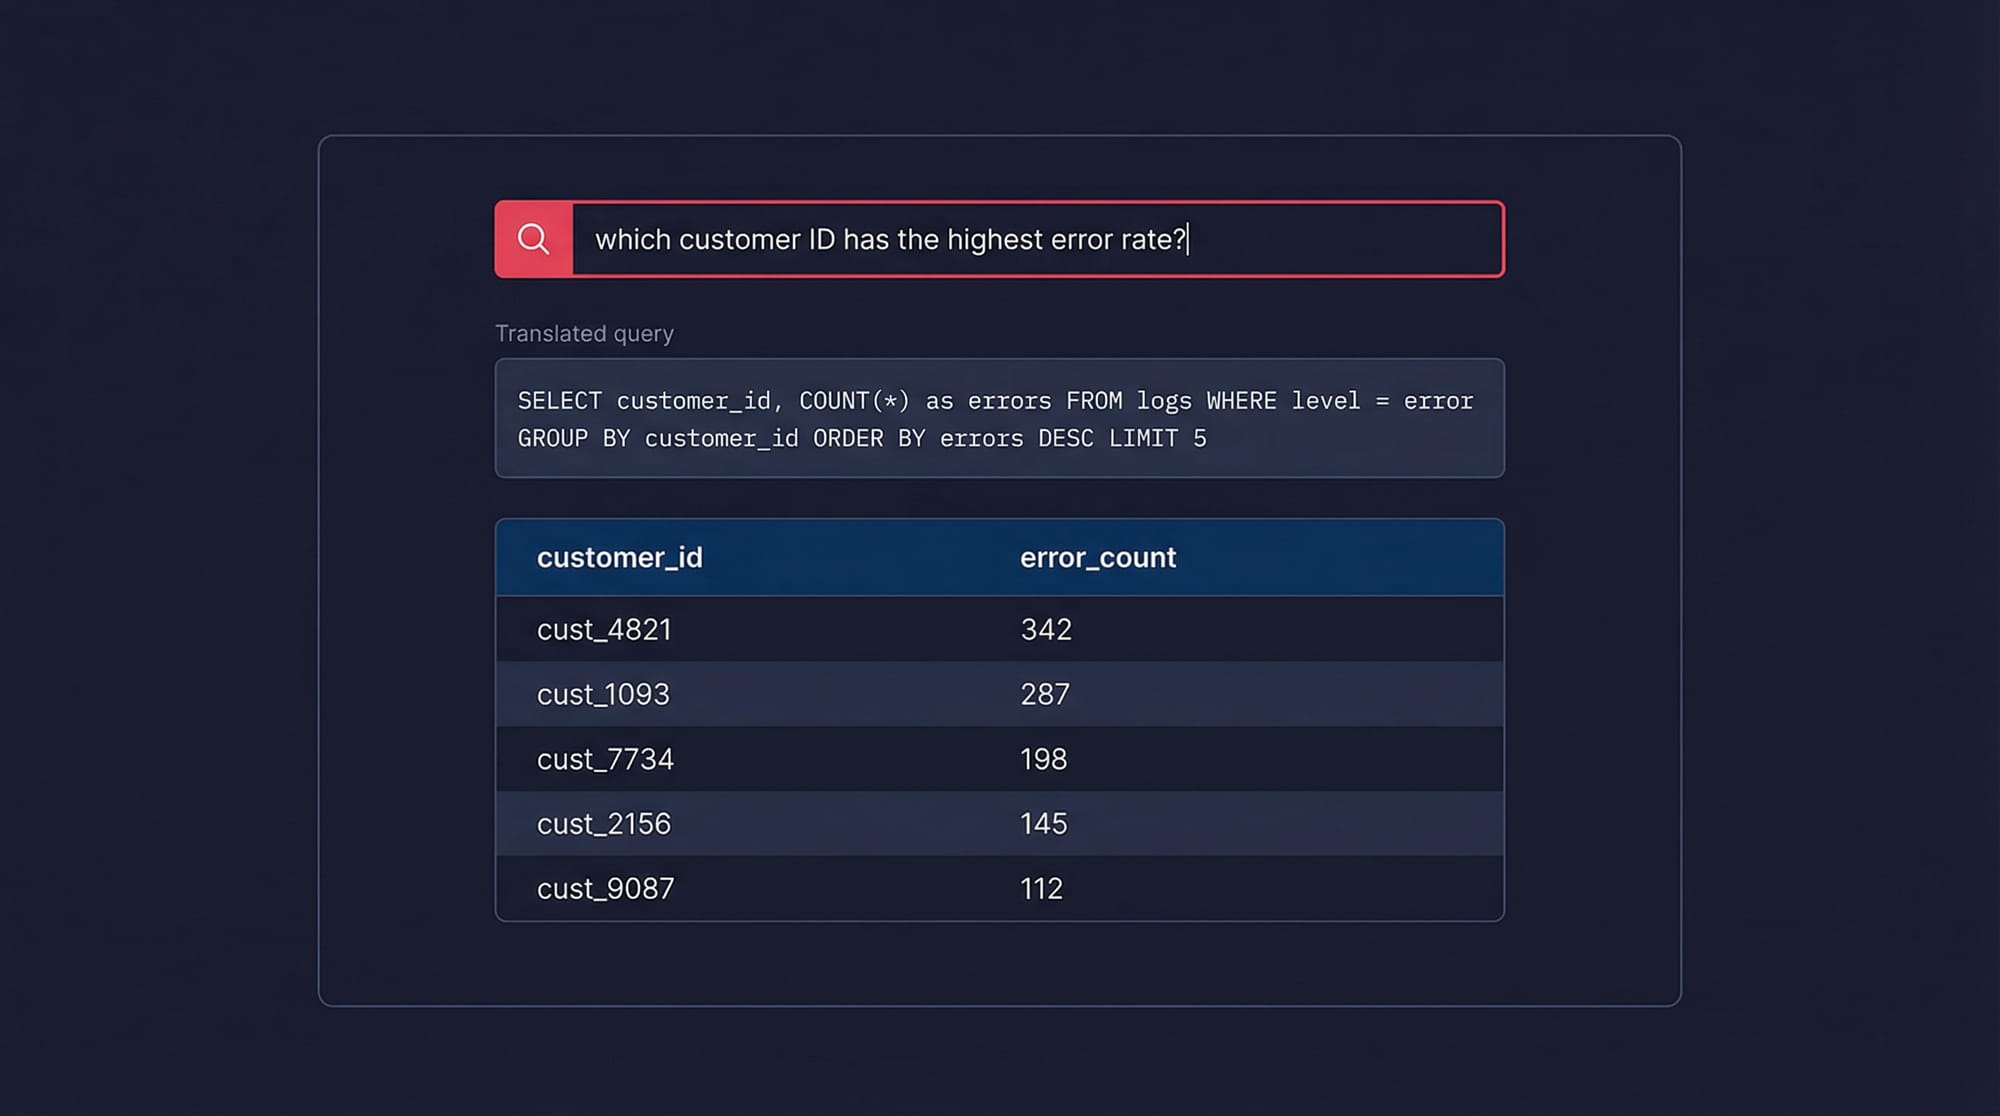
This matters because the gap between knowing what you want to find and knowing how to express it in a query language is where most debugging time goes. An on-call engineer shouldn't need to remember group-by syntax at 3 AM. The NLP layer sits on top of the same structured log store, so you're not losing precision — it's generating the same queries you'd write by hand, just faster.
Considerations: Worth evaluating if cost predictability, trace correlation, and faster time-to-insight during incidents are priorities.
Splunk
The enterprise incumbent. Splunk's Search Processing Language (SPL) is arguably the most powerful log query language available, and the platform handles analytical workloads that would choke other tools.
Strengths: SPL can do things that other query languages can't — statistical analysis, time-series operations, lookups, transactions — all within the query language. For security and compliance use cases, Splunk's maturity is hard to beat.
Considerations: Cost. Splunk's per-GB pricing is among the highest in the market, and log volumes at scale make this painful. Teams regularly describe "Splunk sticker shock" when they see their first invoice at production volume.
Datadog Logs
Strengths: Tight integration with Datadog's metrics and traces. Click from a log line to the related trace, from the trace to the infrastructure metrics. For teams already on Datadog, adding log analytics is low-friction.
Considerations: Datadog's log pricing (per-ingested-GB plus per-indexed-GB) means you're paying twice — once to ingest and once to make logs searchable. Many teams use Datadog's log pipeline features to exclude or archive lower-value logs to manage costs.
Log Analytics Use Cases
Incident Response and Root Cause Analysis
This is the obvious one, and it's where most teams start. Something is broken, you search your logs, you find the error. But the difference between "log search" and "log analytics" during an incident is the difference between finding an error and understanding the error.
Effective log analytics during an incident means: correlating error logs with the distributed trace that produced them (via trace_id), identifying when the error pattern started (to pinpoint the triggering deployment or change), and understanding whether this is a new error or an existing one that spiked. Without analytics, you're grepping. With it, you're investigating.
Security and Compliance
SIEM logs and audit trails are a log analytics problem. Who accessed what, when, from where? Did any access patterns change after a credential rotation? Are there brute-force login attempts that your application-level monitoring doesn't capture?
The requirements here are different from operational debugging — you need longer retention (often 1-7 years), tamper-evident storage, and the ability to search across historical data efficiently. Many teams keep a separate log analytics pipeline for security, with different retention and access controls. See the GDPR log management guide if compliance is a driver.
Performance Debugging
Structured logs with duration fields become a powerful performance analysis tool. If your application logs request processing time, database query duration, and external API call latency as structured fields, you can use log analytics to identify slow operations without instrumenting separate metrics.
This is particularly useful for ad-hoc analysis — the kind of performance question that doesn't justify creating a permanent metric but does justify a 10-minute investigation. "Which endpoints are consistently slow for users in the EU region?" is a log analytics question if your logs contain region and duration fields.
Deployment Validation
After every deployment, log analytics answers: "Did anything change?" New error patterns, changed log volumes, different response time distributions — these are the leading indicators that something went wrong before your metrics dashboards catch up. Teams that integrate log analytics into their deployment pipeline catch regressions faster than teams that wait for metric-based alerts. Pattern clustering is particularly valuable here — it surfaces the new errors automatically, without you having to know what to look for.
Best Practices for Effective Log Analytics
Structure everything. JSON with consistent field names across services. Follow logging best practices and agree on a schema: timestamp, level, service, trace_id, span_id, message, error.type, error.message. This one decision multiplies the value of every other investment you make in log analytics.
Correlate with trace IDs and request IDs. Every log line should include a trace ID. When you find an interesting log, you should be able to click through to the distributed trace that produced it. Without this correlation, you're doing archaeology. With it, you're doing investigation.
Don't index everything. Not all fields need to be searchable. Debug-level noise, health check logs, and high-cardinality fields (full request bodies, for instance) add cost without proportional value. Be selective about what's queryable versus what's just archived for compliance.
Set retention tiers. Not all logs deserve the same storage treatment. Errors and warnings: hot storage, 30-90 days, fully indexed. Info-level logs: warm storage, 14-30 days, partially indexed. Debug logs: maybe don't even ship them to your analytics platform in production. This tiered approach can cut log storage costs by 60-80% without meaningfully impacting your ability to debug issues.
Log Analytics FAQ
What's the difference between log analytics and log management?
Log management is the pipeline: how logs get collected, processed, shipped, stored, and eventually deleted. Log analytics is what you do with the data once it's there: querying, pattern recognition, anomaly detection, and extracting insights. You need decent log management before you can do analytics (garbage in, garbage out), but managing logs well doesn't automatically mean you're getting value from them. Many teams have excellent log pipelines that dump data into a storage backend that nobody queries except during incidents.
How much should I budget for log storage?
Rough math: a typical microservice generates 1-10 GB of logs per day. A modest deployment (20 services) produces 20-200 GB/day. At $0.50/GB/month for hot storage with 30-day retention, that's $300-$3,000/month. But this is highly variable — chatty services with debug logging enabled can produce 10-50x more. The most effective cost lever is filtering at the pipeline level: drop debug logs, sample health checks, and only send error/warning logs to your expensive indexed storage. Route the rest to cheap object storage for compliance retention.
Should I use the same tool for log analytics and metrics?
It depends on your scale and requirements. Unified tools (Datadog, Grafana Cloud, Last9) reduce context-switching and enable correlation features that are hard to replicate across separate tools. Specialized tools (Splunk for logs, Prometheus for metrics) tend to be better at their specific job but create silos. Under 50 engineers, a unified tool is usually the right call — the operational simplicity outweighs the marginal query performance difference. Above that, evaluate whether your log analytics needs have outgrown what a general-purpose platform offers. Understanding the broader logs vs metrics distinction helps clarify when each signal type is most useful.
What's the difference between log analytics and SIEM?
SIEM (Security Information and Event Management) is log analytics applied specifically to security use cases — threat detection, incident response, compliance reporting, and forensic analysis. A SIEM ingests logs from firewalls, authentication systems, network devices, and applications, then applies correlation rules and threat intelligence to detect malicious activity. General-purpose log analytics tools can do some SIEM functions, but purpose-built SIEMs (Splunk Enterprise Security, Microsoft Sentinel, Elastic Security) add security-specific detections, threat intelligence feeds, and compliance reporting that generic tools lack. If security is your primary log analytics use case, evaluate SIEMs specifically. If security is one of many use cases, a general-purpose tool with security add-ons may be sufficient.
How do I get started with log analytics if I'm currently just storing logs?
Start by answering one question you wish you could answer faster during incidents. Maybe it's "show me all errors for this user in the last hour" or "what changed in the payment service after yesterday's deploy?" Write that query against your existing logs. If it takes more than 30 seconds to get a result, you have a tooling gap. From there: ensure your logs are structured (JSON with consistent fields), add trace IDs to every log line, set up a basic dashboard showing error rates by service, and create one alert based on a log pattern. You don't need a sophisticated log analytics platform on day one — you need one query that works when you need it.