

Last updated: November 4, 2026.
A Hacker News thread asked what context an AI model needs to analyze a cluster-wide incident, beyond the observability data such systems already collect. A skeptic in a related thread doubted that smarter reasoning can fill in context that doesn’t exist in your systems without guessing.
Both are right to ask. For AI incident response, the model needs telemetry from the same window as the symptom, plus the changes that landed near it, plus the code on the failing path. Without those, it guesses.
This post covers how the Last9 MCP server gives an agent the first two, with the exact tool calls, and how to keep the agent from inventing the rest.
What the Last9 MCP server does
Model Context Protocol (MCP) is an open protocol for connecting AI applications to tools and data sources. The Last9 MCP server exposes logs, traces, metrics, alerts and dashboards as tools. Your client chooses which tools to call, and Last9 returns telemetry.
Last9 does not do the reasoning. The model behind your client does. What Last9 controls is the quality of the evidence it hands back, which is the part this post is about. If you build MCP servers yourself, see our guide to MCP server monitoring instead.
What context does an AI incident response agent need?
Five kinds of context turn an alert into an explanation. Four come from Last9 MCP. The fifth does not.
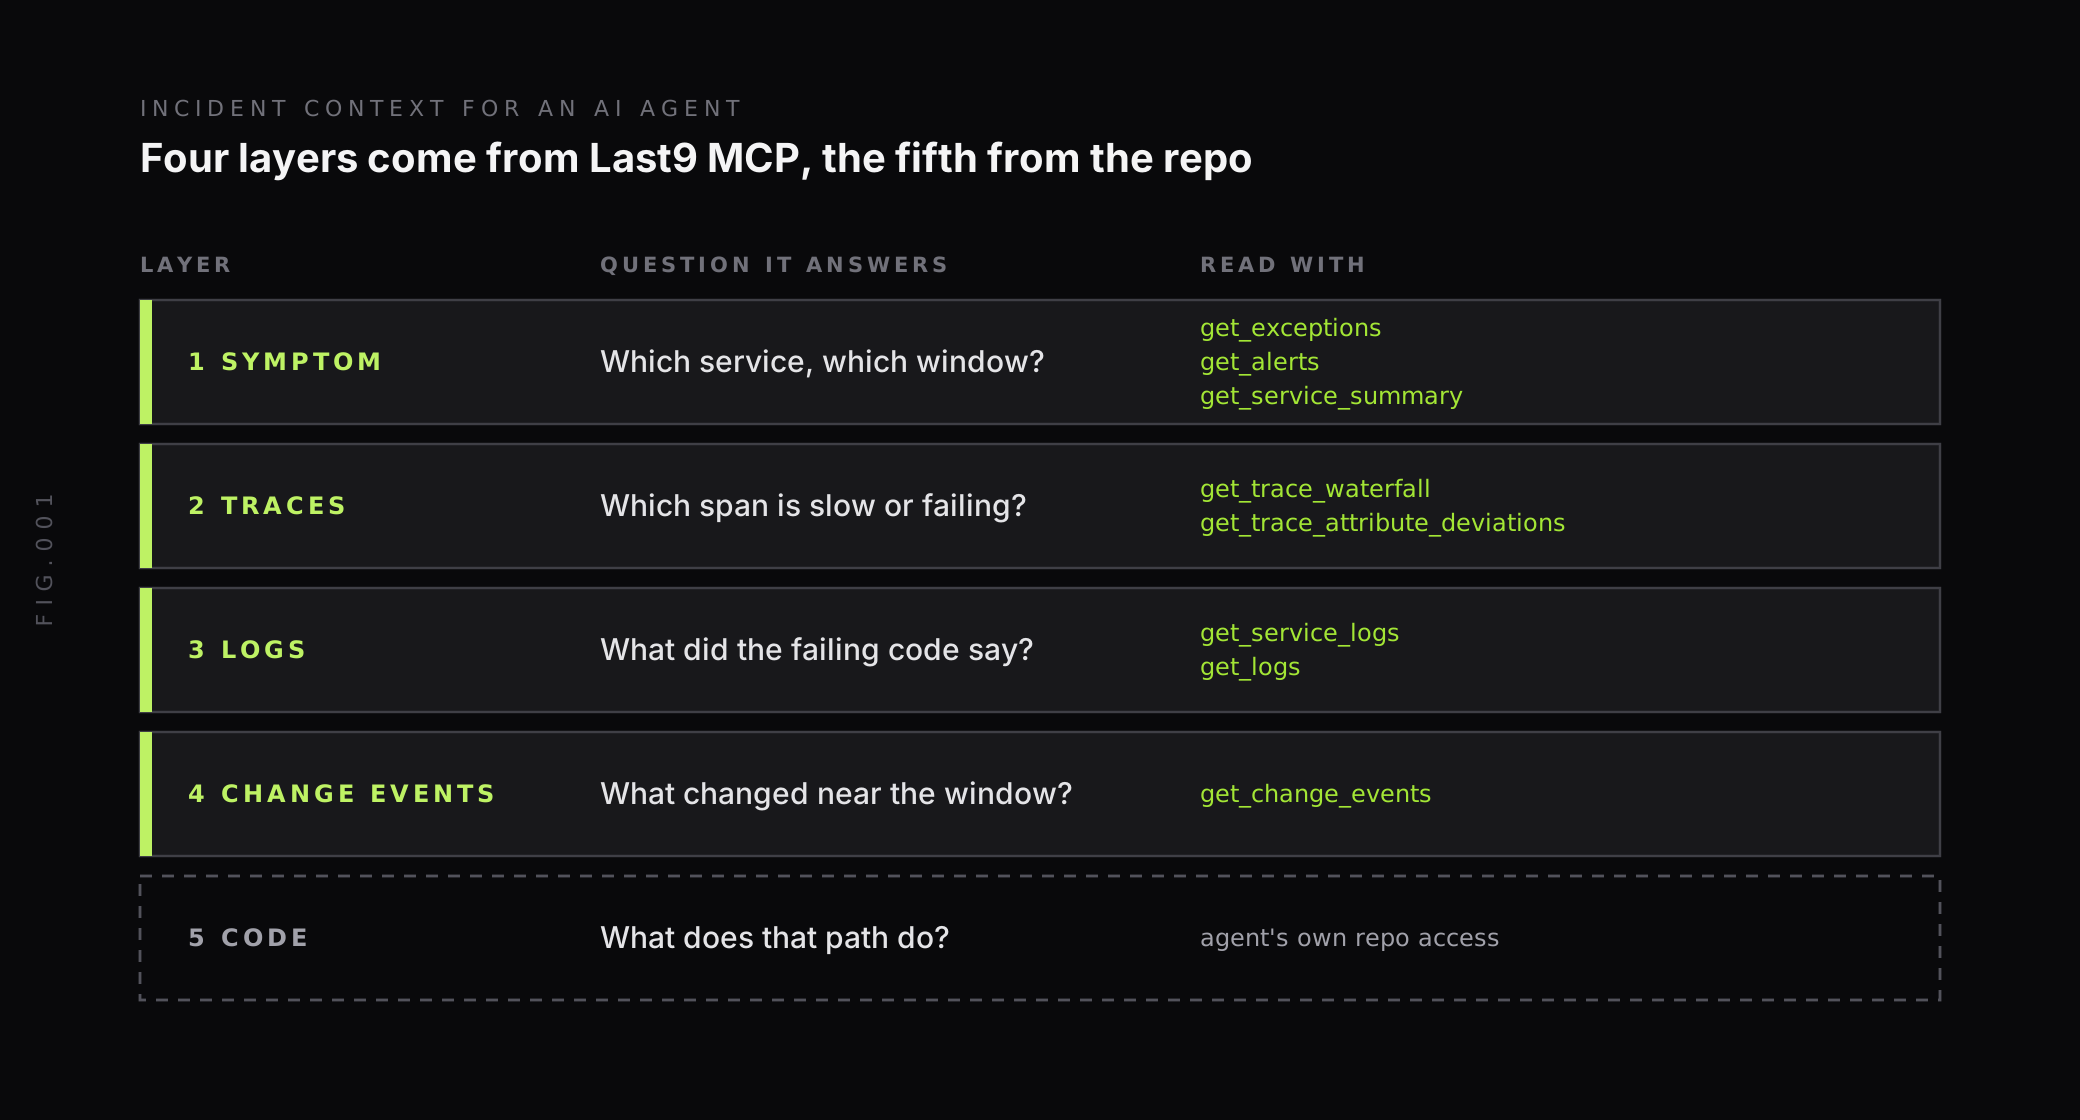
- Symptom. Which service, which environment, which absolute time window.
get_exceptions,get_alertsandget_service_summaryestablish what is failing and how often. - Traces.
get_trace_waterfallshows one trace as a parent and child waterfall with millisecond timing and self-time.get_trace_attribute_deviationscompares slow and fast spans. - Logs.
get_service_logsreturns raw lines for a service, andget_logsruns a LogJSON pipeline to filter or aggregate them. - Change events.
get_change_eventsreads thelast9_change_eventsmetric so the agent can line up deployments and config changes against the incident. - Code. Last9 MCP has no code tool. Your coding agent reads the repository it already has access to.
The answer to the Hacker News question is the same window across all five layers. A trace from 14:05 and a deployment from yesterday do not explain each other.
How the hosted server and tool loop work
The hosted endpoint is https://app.last9.io/api/v4/organizations/<org_slug>/mcp. Developers in an IDE sign in with OAuth. Bots, services and CI jobs use an MCP-type Client token, passed as Authorization: Bearer <token>. You create it under Query Tokens, with Token Type Client and Client Type MCP. The hosted server needs no local binary.
Once connected, a typical investigation runs as a loop. The client chooses each call from the previous result:
get_service_profileto see which signals exist for the service.get_exceptionsto find what is failing in the window.get_trace_waterfallon a failing or slow trace ID.get_trace_attribute_deviationsto see which attribute values correlate with the slow spans.get_change_eventsto check what shipped near the window.
If the agent has a misspelled service name, did_you_mean suggests matching entity names before an empty result gets mistaken for a healthy service.
Investigating one incident from your editor
The loop is easiest to see from a prompt. Start with the symptom, the service and the window:
I'm seeing errors in production for checkout-service between14:00 and 14:30 UTC today. What exceptions occurred, and whichtrace shows the slowest failing request?The client calls get_exceptions and get_service_performance_details, then pulls one trace through get_trace_waterfall. From there, ask the follow-ups the docs use:
- “What attributes differ between slow and fast requests on checkout-service?” triggers
get_trace_attribute_deviationswithcomparison_mode: latency. - “We had performance issues around 2pm. Were there any deployments around that time?” triggers
get_change_events. - “Find error logs from the user-service in the last 30 minutes” triggers
get_service_logs.
When you reach the code, the entry point is a prompt your agent already understands: ask it to fix the last stack trace for the service. It has the exception, the trace and the deployment time in context, and the repository in front of it.
Keeping the agent from guessing
The skeptic’s objection has a mechanical answer. Guessing happens when the agent treats missing evidence as a finding. Last9 MCP tools are written to make the gaps visible.
- No match is not healthy. An empty
get_trace_waterfallresult carriesevidence_quality: insufficient. Widen the window or verify the trace ID before concluding the trace does not exist. - Correlation is not cause.
get_trace_attribute_deviationsranks attribute values that differ between cohorts and says so: the results describe correlation, not cause. - Some results are final. For
get_apm_service_deviations, treatstable,no_dataandunsupported_workload_shapeas terminal outcomes and answer from the result without more tool calls. - Pin the incident. Keep the service, environment and an absolute time window together for the whole conversation, and use those same bounds for every signal.
Then ask for the output in three separate lists:
Report three lists: confirmed findings with the tool call behindeach, possible causes with the evidence for and against, and theevidence still missing. Do not present a deployment near thewindow as the cause unless a trace or log ties them together.An agent that must name its missing evidence has less room to fill the gap with a plausible story.
Permissions, limits and where your telemetry goes
Of the tools Last9 MCP serves, 51 are read-only and carry readOnlyHint: true. Five can write: create_dashboard, update_dashboard, delete_dashboard, delete_dashboard_snapshot and add_drop_rule. The last one changes what is ingested, so treat it like a production change.
Approval lives in your MCP client or agent, not in Last9 MCP and not in a prompt. For an investigation bot, keep an allowlist of read tools and check it when you expose or call a tool. If you self-host the open-source server, LAST9_TOOLSETS=investigate limits it to investigation tools. Use one token per bot or developer so you can audit and revoke access separately.
Tool results can contain log messages, span attributes and exception details, and they go to the model provider behind your client. Check that provider’s data handling before you connect an agent to production telemetry.
Two limits to plan around. You need a Last9 account and telemetry already flowing, and the agent sees only what is instrumented: a service without traces gives the agent logs and nothing else. Trace attribute comparison also needs the trace-analysis capability enabled for your tenant.
Last9’s own agent, if you don’t want to build one
If you would rather not wire up a bot, Last9 AI runs in the dashboard and in Slack with @Last9. It runs on your model provider or inference endpoint, with no per-investigation charge. Our Last9 AI overview covers the surfaces and model configuration.
If you want your own agent, the guide to building your own AI SRE covers incident context storage, tool allowlists, time limits and what a partial report should return. For the process side of automation, see our incident response automation playbook. For a definition of the category, see what AI SRE is.
Get started with the Last9 MCP server
-
Find your organization slug in your Last9 URL:
https://app.last9.io/v2/organizations/<org_slug>/.... -
Add the hosted endpoint to your client. In Claude Code:
claude mcp add --transport http last9 "https://app.last9.io/api/v4/organizations/<org_slug>/mcp" -
Run
/mcp, select last9, and complete the OAuth sign-in. -
Verify with “What exceptions occurred in the last hour?”
Cursor, VS Code, Windsurf, Claude.ai and Claude Desktop, Codex CLI and ChatGPT are covered in the Last9 MCP docs. For tokens and Python examples for bots, see Last9 MCP for AI agents. To walk through a full investigation, see Investigate an incident with AI. To see what the server does with live data before you wire it in, the Last9 MCP page has the overview.
FAQ
What context does an AI agent need for incident response?
Five kinds: the symptom (which service, environment and absolute time window), traces that show where a request slowed or failed, logs from the same window, change events such as deployments, and the code on that path. Last9 MCP supplies the first four through tool calls. The agent reads code from its own repository access.
What is the Last9 MCP server?
It is an MCP server that exposes Last9 logs, traces, metrics, alerts and dashboards as tools. Your AI client picks which tools to call and uses the results to answer. The hosted endpoint is https://app.last9.io/api/v4/organizations/<org_slug>/mcp, and an open-source server is available for self-hosting.
How do I connect an AI agent to Last9 MCP?
In an IDE or chat client, add the hosted endpoint with your organization slug and complete the OAuth sign-in. For an agent, bot or CI job, create an MCP-type Client token under Query Tokens and send it as a Bearer token. Then ask for the exceptions in the last hour to verify the connection.
Can the Last9 MCP server change my configuration?
Mostly no. Of the tools, 51 are read-only and carry readOnlyHint true. Five can write: create_dashboard, update_dashboard, delete_dashboard, delete_dashboard_snapshot and add_drop_rule. Your MCP client or agent decides which calls need confirmation, so allowlist read tools for an investigation bot and require approval for the rest.
Where does my telemetry go when an agent queries it over MCP?
Tool results can contain log messages, span attributes and exception details, and they go to the model provider behind your MCP client. Check that provider’s data handling and the client’s approval settings before you connect an agent to production telemetry.
Can an AI agent do root cause analysis on its own?
It can gather and organize evidence, but the evidence has limits. Trace deviation results describe correlation, not cause, and an empty result is not proof that nothing happened. Ask the agent to separate confirmed findings from possible causes and missing evidence, and keep the engineer responsible for the conclusion.


