
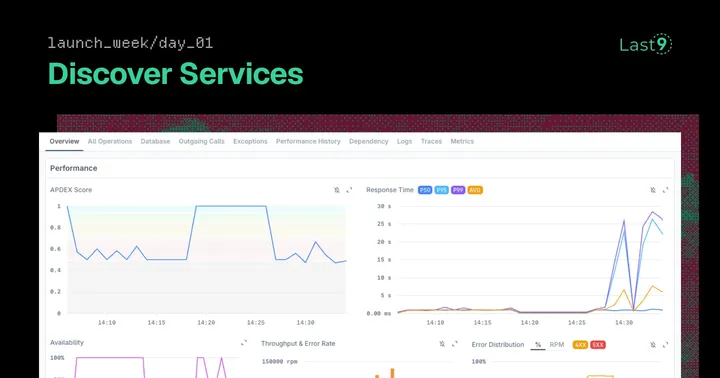
Launch Week Day 1: Introducing Discover Services
Picture this: It’s 2 AM, alerts are firing, and you’re staring at a dashboard trying to figure out which service is causing the cascade of failures. Your service map is a six-month-old Miro board, and you have no idea what’s actually talking to what in production right now.
If you’ve been there, you’re not alone. In fast-moving teams, new services get deployed faster than you can track them. By the time you need to debug something, half your service map is already out of date, and you’re flying blind trying to understand dependencies and performance bottlenecks.
Beyond Service Catalogs: What Discovery Actually Means
Most solutions give you a service catalog - essentially a fancy phone book of what exists. Service meshes like Istio show you connectivity, but that’s still just the “what” without the “how” or “why.”
The fundamental problem? Most discovery approaches require configuration - you manually declare what exists, draw the topology, maintain YAML files. It’s like trying to keep a phone book current by hand. In fast-moving environments, configuration rots the moment you write it.
Discover Services takes a different approach: convention over configuration. Instead of asking you to declare your services, we automatically discover them from your telemetry. If you’re sending OpenTelemetry traces, we can see your entire service graph, dependencies, and performance characteristics without you having to configure anything.
Real discovery needs to answer critical questions about what’s running and how it all connects-automatically. Today, we’re diving deep into Discover Services - our answer to service discovery that evolves with your code.
Discover Services: APM That Actually Maps Your Reality
This is so much better than whatever we were using in New Relic.
Here’s what makes Discover Services different: it’s not just showing you that Service A talks to Service B. It’s showing you that Service A’s /checkout endpoint makes 47 calls per second to Service B with P95 latency of 230ms and burns 12% of your error budget.
This is APM-level visibility with dependency intelligence built in.
What you get:
- Automatic service discovery that tracks new deployments as they happen
- Real-time service dependencies that update as your architecture evolves
- Operation-level performance for every endpoint, database query, and external API call
- Stack traces that show exactly what needs fixing, not just what’s broken
- High-cardinality slicing by runtime version, language, tenant, or any custom dimension
- Pre-built dashboards with alerts already configured for each chart
The “Just Send Traces” Setup That Actually Works
The best part? Getting started is stupid simple. No configuration files, no manual service registration, no topology declarations. If you’re already doing distributed tracing (and if you’re not, you should be), you’re 90% there.
Prerequisites:
- Required: Send OpenTelemetry traces to Last9 (that’s it)
- Optional but recommended: Forward your logs and infrastructure metrics for deeper context
From your traces, we automatically build your service map, detect dependencies, and start monitoring performance. No YAML to maintain, no service registry to update. Convention beats configuration every time because conventions evolve with your systems while manual configs rot.
A publicly-listed ecommerce company recently migrated from New Relic to Last9. Their engineering team told us Discover Services gave them visibility they never had before-not just into individual services, but into how their entire system behaves as a connected graph. “This is so much better than whatever we were using in New Relic,” their platform lead said.
What This Looks Like In Practice
When issues hit, you need to rule out problems fast: Is it my service or a dependency? Bad database call or external API? My code or someone else’s? Infrastructure problem?
Here’s your new incident response flow:
Start by asking our Last9 MCP agent: “identify last problems in production environment, go through all hypothesis and create a final RCA document”
The agent investigates across your services, correlates symptoms with root causes, and generates a complete RCA - all through natural conversation. Then jump into the visual dashboards to drill deeper into specific services, operations, or stack traces.
Same underlying telemetry data, seamless workflow. Chat for rapid diagnosis, dashboards for detailed investigation. Every conversation teaches the system about your environment, creating a self-learning loop that gets smarter about your specific architecture.
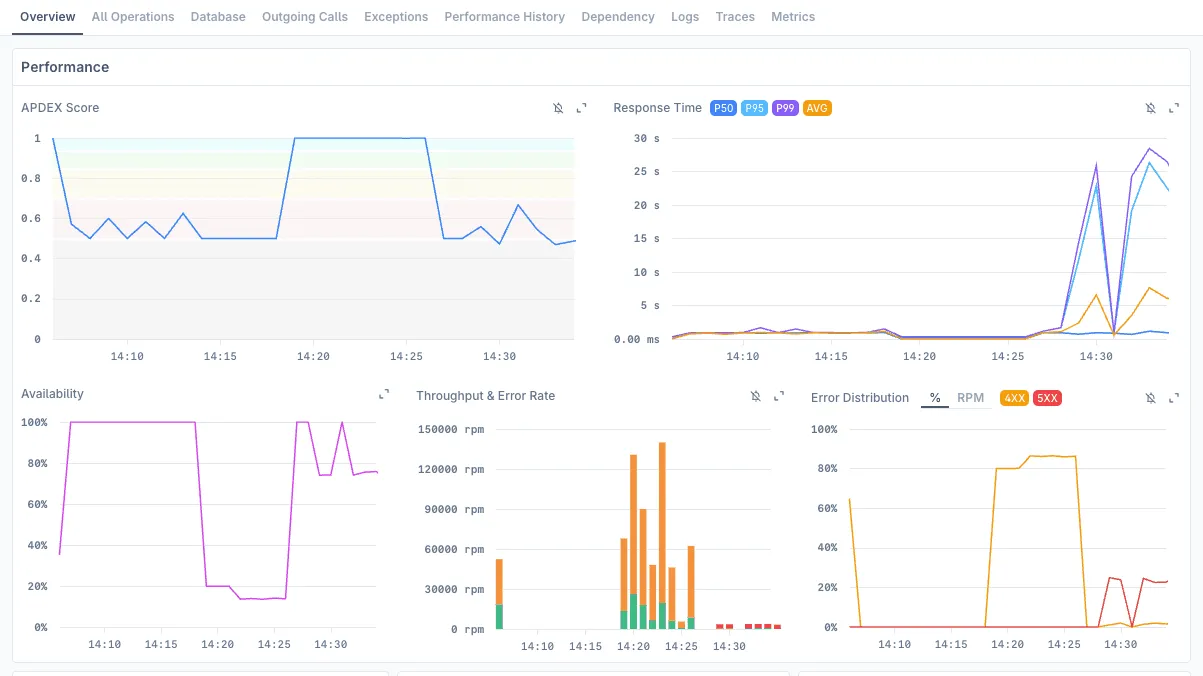
Once you’re in the dashboards:
- Service overview - See APDEX, error rates, throughput at a glance across all services
- Drill into operations - Find that slow database query or failing external call
- Check dependencies - See which services are getting hammered, internal vs external
- Stack traces - Get the exact line of code and fix that needs to happen
- Slice by dimensions - Filter by runtime version, tenant, region, or any custom tag
- One-click alerts - Every chart comes with pre-configured alert rules ready to enable
The Real Win: Self-Documenting Architecture
The best documentation writes itself. Discover Services creates a living map of your architecture that evolves as your code evolves. New service deployed? It appears automatically. Changed how services communicate? The dependency graph updates in real-time.
No more outdated Confluence pages. Your service map becomes your single source of truth.
What’s Next in Launch Week
Today we’re introducing Discover Services, but this is just day one. Throughout Launch Week, we’ll be showing you how infrastructure discovery keeps your monitoring coverage complete, and other ways to eliminate the guesswork from your observability stack.
The goal? A world where “what’s causing this cascade failure?” is a question you can answer in seconds, not hours.
Ready to See Your Services Clearly?
Want to stop flying blind during incidents? Discover Services is available now.
Start free (just send us your traces) or talk to an expert to see how it works with your specific stack.
Built for developers, by developers who are tired of broken service maps and incident guessing games.
This is Day 1 of Last9’s Launch Week. Tomorrow: More from the Discover stable and why your monitoring coverage has more gaps than you think.

