
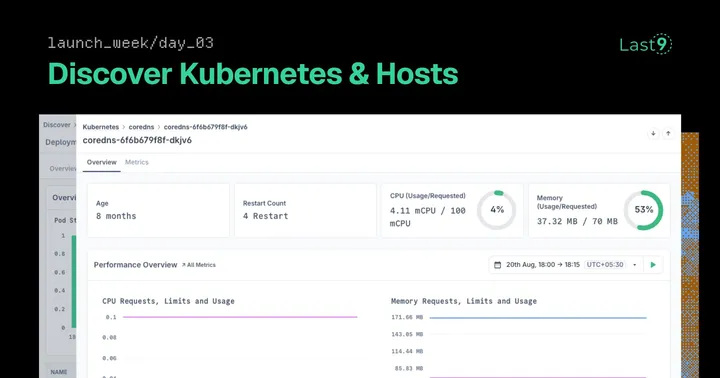
Launch Week Day 3: Introducing Discover Infrastructure
Your dashboard looks perfect. APIs responding in 80ms, background jobs processing smoothly, error rates at 0.02%. Everything’s green.
Then production breaks. “Why is checkout so slow?” “The payment service keeps timing out!” You run kubectl get pods and discover payment-service pods restarting every 3 minutes due to OOM kills. Then you check your database host-CPU at 98% because someone forgot the new ML training job runs there too.
Sound familiar?
What Your Current Tools Miss
Here’s what’s happening across your infrastructure while your monitoring shows green: Kubernetes pods hitting memory limits and getting killed mid-request, traditional hosts running out of disk space causing silent database write failures, CPU throttling on containers causing latency spikes that don’t show up in application metrics, and critical services running with fewer replicas than configured because nodes can’t schedule new pods.
When your API returns a 500, you get an alert. When infrastructure degrades gradually, your applications just get mysteriously slower until someone manually checks resource usage.
- Prometheus + Grafana shows cluster and host metrics but won’t correlate that your API latency jumped because specific pods are CPU-throttled, not because your code is slow.
- Datadog Infrastructure gives you node-level visibility but charges per-host, creating blind spots where you monitor production K8s but skip staging VMs.
- New Relic tracks pod status but won’t show you that background jobs are backing up because worker pods keep getting evicted while your database host is under memory pressure.
The real problem: infrastructure monitoring tools treat K8s and traditional hosts as separate worlds, forcing you to piece together the complete picture manually.
When Infrastructure Becomes Part of Your App Story
Instead of the usual debugging dance across multiple tools-”API latency is high… check the code… maybe the database… check Prometheus for K8s… SSH to the database host… oh, both are having resource issues…”-you get direct answers.
Ask our AI agent: “Why are payments slow?” and get the complete story: “Payment-service pods hitting memory limits every 4 minutes on K8s cluster. Database host CPU at 95% due to ML training job. Both issues started 2 hours ago. Here are the recommended fixes.”
One conversation, complete infrastructure diagnosis across your entire stack. No separate tools for containers vs VMs. No agents per infrastructure type. Same platform where you debug services and jobs.
Last9 stood out in our rigorous evaluations due to its reliability-first observability model, cost efficiency, and engineering-friendly interface.
Discover Kubernetes:
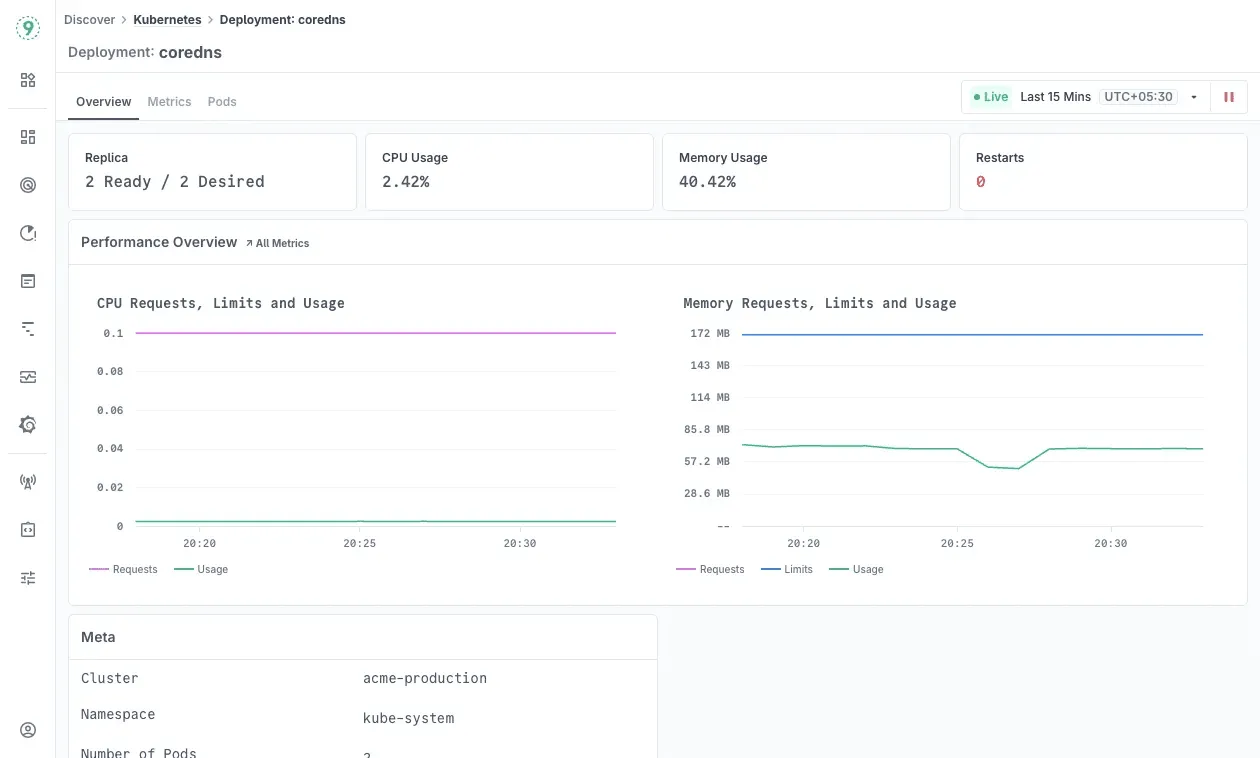
- Pod-level debugging showing which instances cause application problems
- Resource right-sizing based on actual usage vs configured limits
- Deployment health with replica tracking and rollout status
Discover Hosts:
- Traditional VM and bare metal monitoring with host-level TSLIs
- Sort by performance indicators to focus on problematic hosts first
- Host metadata and workload identification for capacity planning
Prerequisites:
- Kubernetes Cluster Monitoring integration for K8s visibility
- Host monitoring setup for traditional infrastructure
- Optional: Logs and Events integrations for complete context
What you get: Cross-stack correlation connecting infrastructure issues to business impact, AI-powered debugging across services, jobs, K8s, and traditional hosts, and unified resource optimization across your entire infrastructure footprint.
Completing the Stack
- Day 1: Discover Services - Service discovery from telemetry
- Day 2: Discover Jobs - Background job monitoring
- Day 3: Discover Infrastructure - Complete infrastructure visibility
Three layers, one platform. Ask AI about any performance problem and get answers that span your entire stack-from application traces through background jobs down to the specific pods and hosts where things are actually running.
Why This Matters Right Now
Modern applications run on hybrid infrastructure-Kubernetes clusters for new services, traditional hosts for databases and legacy systems, auto-scaling that spans both worlds. Yet most teams debug infrastructure problems by checking each layer separately, manually correlating issues across tools.
“Last9 stood out in our rigorous evaluations due to its reliability-first observability model, cost efficiency, and engineering-friendly interface,” says Neeraj Prem V., Engineering Manager. “Their platform helped us reduce alert fatigue, gain better insight into service reliability, and adapt to the scale fluctuations we deal with in dynamic and high-traffic events.”
Your infrastructure deserves the same observability sophistication as your application code. Because when infrastructure fails silently, applications fail loudly.
Ready to see what your infrastructure is actually doing?
Start monitoring infrastructure or see a demo with your specific stack.
This completes the Discover trilogy. Tomorrow: The next chapter in unified observability.

