

When it comes to monitoring Java applications, JMX (Java Management Extensions) plays a pivotal role.
If you’re looking to optimize your app’s performance, understand its behavior, and troubleshoot issues in real-time, JMX monitoring is a tool you’ll want to understand inside and out.
In this guide, we’ll dive deep into the world of JMX monitoring, exploring not just the basics, but also some lesser-known features and advanced tips that will give you an edge in keeping your Java apps running smoothly.
What is JMX Monitoring?
JMX (Java Management Extensions) is a framework that allows developers to manage and monitor Java applications, system objects, devices, and service-oriented networks.
With JMX monitoring, you can access real-time metrics, such as memory usage, thread counts, and garbage collection statistics, providing a clear view of how your app is performing.
It’s typically used for performance monitoring, resource management, and diagnostics. Think of it as your go-to tool for gaining insights into the JVM (Java Virtual Machine), as well as managing and monitoring the health of applications, servers, and other resources.
To explore more about monitoring tools, check out our guide on JMX monitoring for Java applications.
How Does JMX Monitoring Work?
JMX monitoring works by exposing a set of management interfaces and components through which external tools can access real-time application metrics.
Here’s a breakdown of how it works:
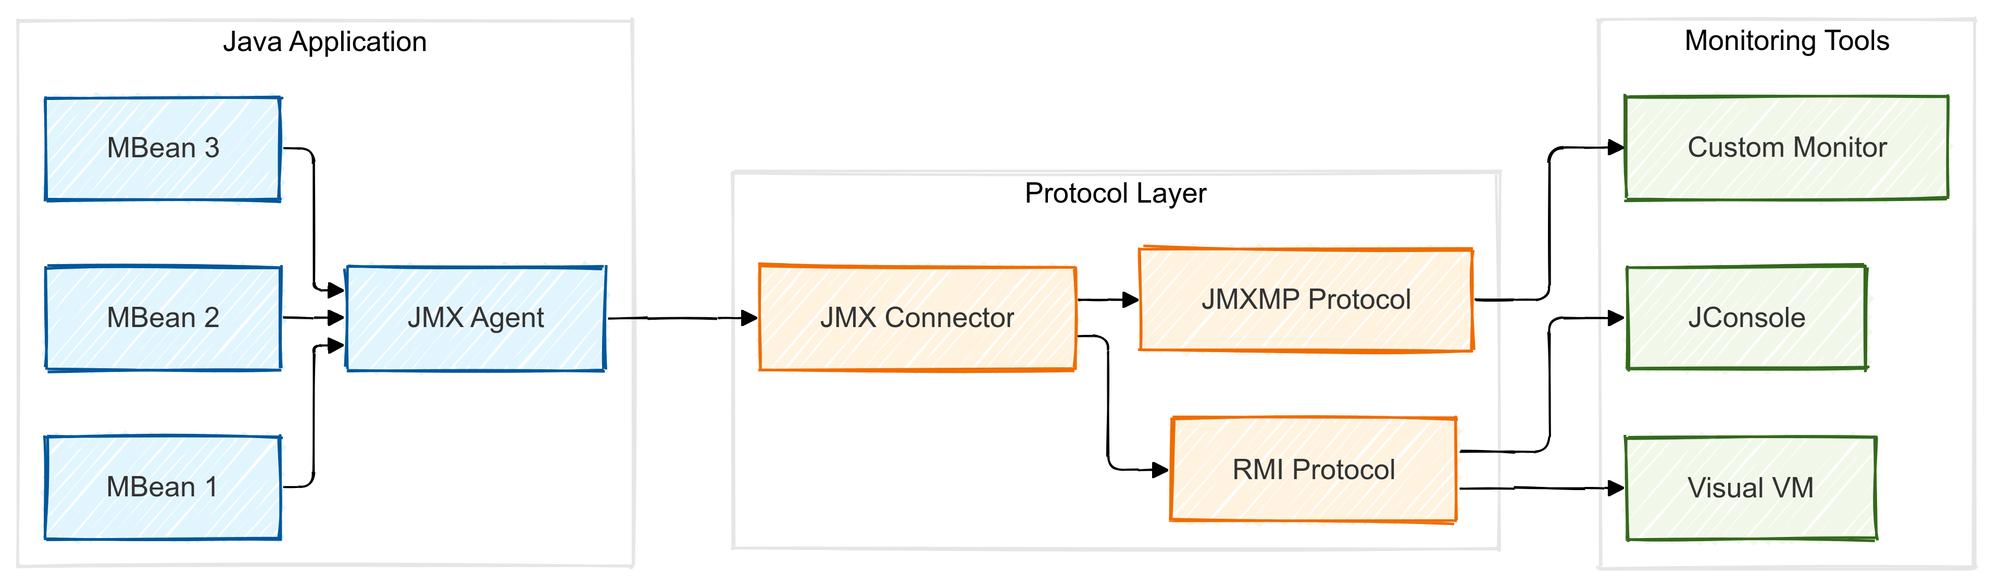
- MBeans (Managed Beans): These are the core building blocks of JMX. MBeans represent the resources or components being managed (e.g., JVM, application servers, etc.) and can be either standard or dynamic.
- JMX Agent: This is responsible for managing the MBeans and their interactions with external systems. The JMX agent can be part of the application or run as a separate process.
- Connector: The connector acts as a bridge, allowing external tools to connect to the JMX agent and retrieve data. It supports protocols like RMI (Remote Method Invocation), JMXMP, and more.
Key Metrics to Monitor with JMX
When monitoring Java applications with JMX, several important metrics can give you insights into the performance and health of your system.
These include:
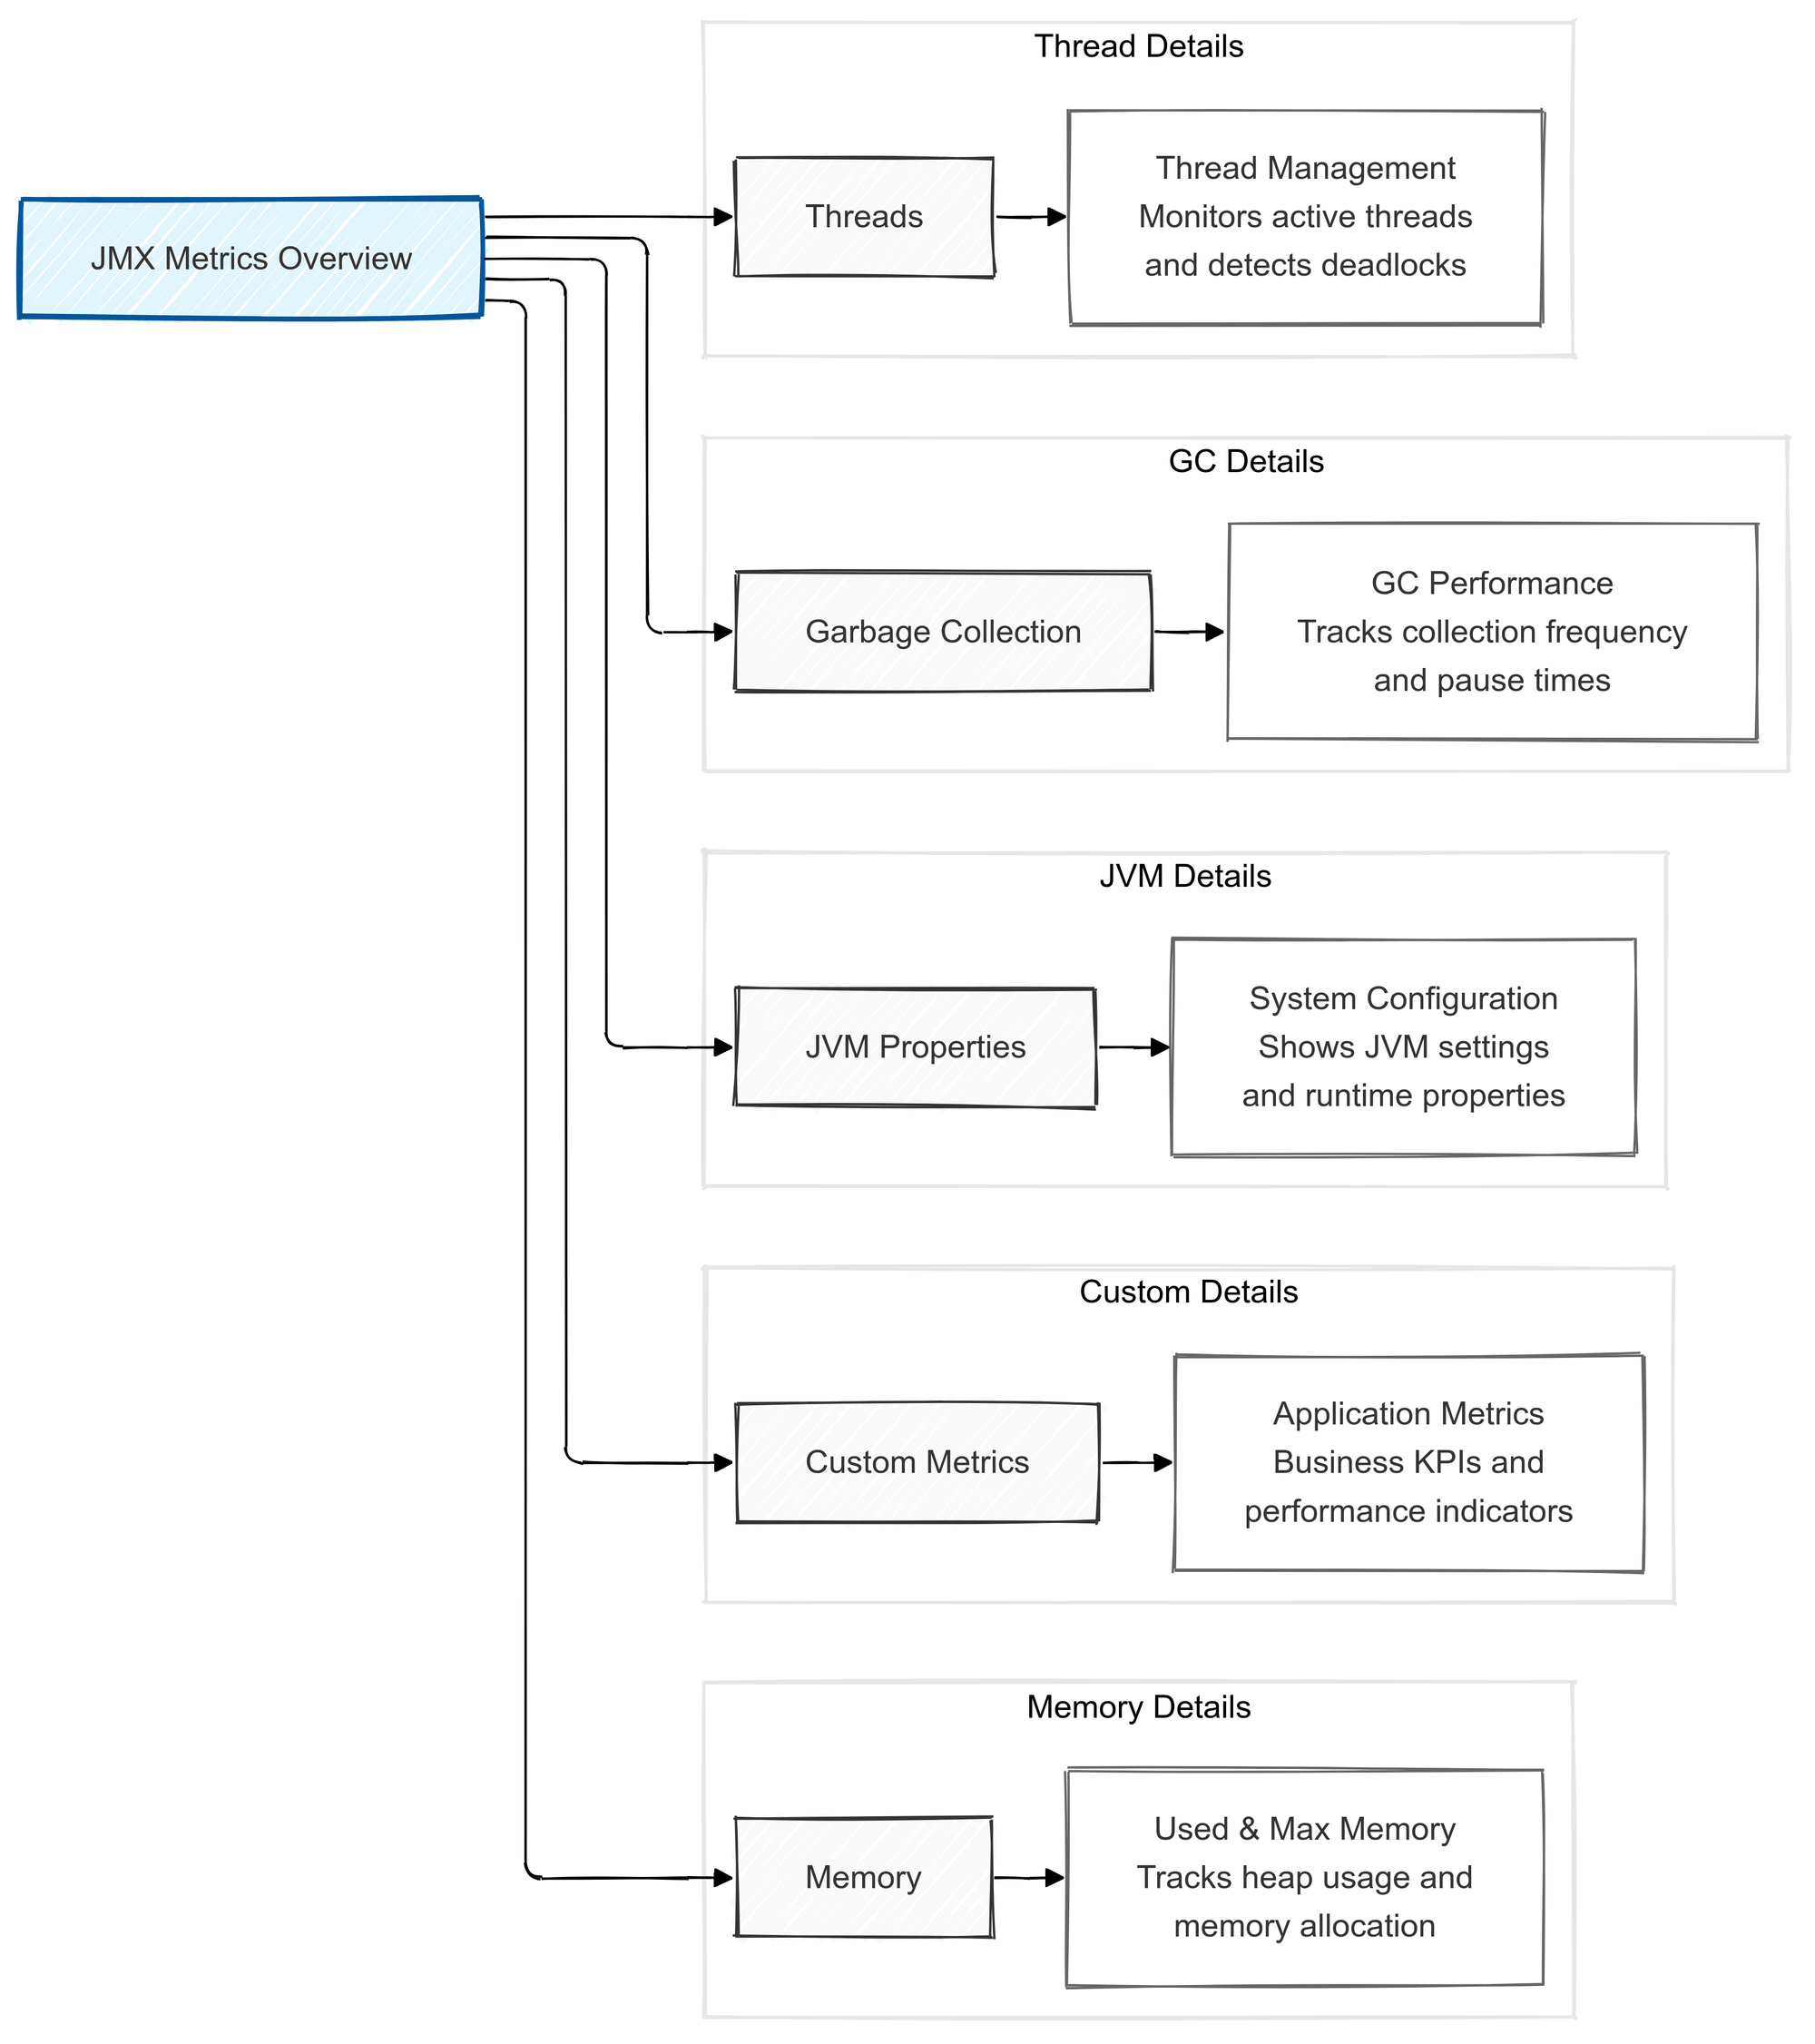
- Heap Memory Usage: Monitoring memory usage is crucial for identifying memory leaks, excessive memory consumption, or other performance issues that might arise during runtime.
- Thread Count and State: JMX allows you to keep an eye on the number of active threads and their states. This helps you pinpoint thread-related bottlenecks or deadlocks.
- Garbage Collection: JMX enables you to monitor the activity of the garbage collector, helping to identify inefficiencies or excessive GC pauses that might be affecting application performance.
- JVM System Properties: These properties give insight into the JVM’s configuration and environment, which can help in fine-tuning the JVM settings for optimal performance.
- Application-specific Metrics: Many applications expose custom metrics through JMX. These can be tailored to track specific operations, transactions, or other behavior.
To learn more about real-user monitoring, check out our guide on Real User Monitoring (RUM).
Why Should You Use JMX Monitoring?
- Real-time Insights: With JMX, you can access data in real-time, which is essential for proactive performance management.
- Granular Control: Unlike basic monitoring tools, JMX provides granular visibility into the inner workings of your Java application, allowing you to drill down into specific metrics that matter most.
- Customizable: JMX is highly flexible. You can define your MBeans to expose specific metrics that may not be available out of the box, which makes it ideal for application-specific monitoring.
- Wide Tooling Support: Many popular monitoring tools, like Prometheus, Grafana, and New Relic, support JMX monitoring out of the box, which means you don’t have to reinvent the wheel when integrating it into your system.
7 Best Tools for JMX Monitoring
There are several powerful tools to help you maximize the potential of JMX monitoring. Here’s a closer look at some of the top tools and what they offer:
1. Prometheus
Prometheus, paired with the JMX Exporter, is one of the most popular choices for monitoring Java applications. It scrapes JMX metrics and stores them for long-term analysis. Prometheus provides robust query capabilities, and it integrates easily with Grafana for creating rich dashboards to visualize your metrics in real time.
- Features:
- Scalable, open-source time-series database.
- Powerful querying capabilities.
- Easy integration with Grafana for visualization.
- Active community support and continuous development.
- Best for: Teams that need a flexible, open-source solution for collecting and analyzing metrics.
2. Grafana
Grafana is primarily used for visualizing data from a variety of sources, and when paired with Prometheus or any other JMX monitoring tool, it excels in real-time monitoring and dashboard creation.
- Features:
- Stunning, customizable dashboards.
- Real-time data visualization.
- Integrates well with a wide variety of data sources.
- Alerts and notifications.
- Best for: Users who need an intuitive way to create dashboards and monitor their metrics visually.
To learn more about monitoring with Prometheus and Grafana, check out our guide on Prometheus and Grafana.
3. Last9
Last9 is a comprehensive telemetry data platform that helps teams monitor and troubleshoot complex distributed systems. With support for JMX monitoring, Last9 enables detailed metrics collection and analysis from Java applications, offering deep visibility into performance and infrastructure.
- Features:
- High cardinality support and unified platform for logs, metrics, and traces.
- End-to-end monitoring for distributed systems.
- JMX support for Java applications.
- Integrated with anomaly detection, tracing, and logging.
- Customizable dashboards for real-time monitoring.
- Best for: Teams looking for a more holistic monitoring solution with integrated observability for complex systems.
4. Zabbix
Zabbix is another powerful open-source monitoring tool that collects JMX metrics. It provides a full range of monitoring features, including alerts, graphs, and detailed reports. Zabbix is ideal for creating robust, enterprise-grade monitoring solutions.
- Features:
- Flexible, open-source monitoring.
- Supports a wide range of metrics, including JMX.
- Customizable alerting and reporting system.
- High scalability for large environments.
- Best for: Organizations needing a comprehensive, customizable monitoring tool.
5. Datadog
Datadog is a leading cloud infrastructure monitoring tool with excellent support for JMX monitoring. It provides a unified platform for monitoring your entire stack, including Java applications, with robust dashboards, alerting, and anomaly detection.
- Features:
- Cloud-native, fully managed service.
- Advanced analytics and anomaly detection.
- Real-time dashboards and alerts.
- Extensive integrations with various tools and services.
- Best for: Teams that need a highly scalable, cloud-based monitoring solution with advanced analytics.
6. New Relic
New Relic is a widely used performance monitoring tool that also offers support for JMX metrics. It provides deep insights into application performance, helping teams optimize their Java applications.
- Features:
- Full-stack monitoring with application performance insights.
- Easy-to-use dashboards and visualization tools.
- Real-time monitoring with detailed metrics.
- Built-in alerting and reporting features.
- Best for: Teams seeking an all-in-one performance monitoring platform.
For a detailed breakdown of Datadog pricing, check out our article on Datadog Pricing: All Your Questions Answered.
7. Dynatrace
Dynatrace is a powerful monitoring platform that goes beyond JMX metrics to offer deep, AI-driven insights into Java applications and infrastructure. It excels at providing automatic problem detection, real-time monitoring, and detailed performance analytics.
- Features:
- AI-powered monitoring and root cause analysis.
- Full-stack observability including JMX metrics.
- Auto-discovery of applications and infrastructure.
- Deep, real-time insights into Java performance.
- Best for: Enterprises looking for advanced AI-driven monitoring with a focus on Java applications.
How to Secure JMX Connections
JMX provides powerful monitoring and management capabilities, but it can also introduce security risks if not properly configured. To prevent unauthorized access and ensure your JMX connections remain secure, follow these best practices.
1. Enable Authentication
Without authentication, anyone can connect to your JMX interface and access sensitive data or modify application settings. Enable authentication by configuring the jmxremote.authenticate system property, requiring users to provide a username and password when connecting to the JMX server. Store credentials securely (e.g., in a secrets manager or encrypted file).
How to enable authentication: Modify your JMX configuration with these JVM startup options:
-Dcom.sun.management.jmxremote.authenticate=true-Dcom.sun.management.jmxremote.password.file=<path-to-password-file>-Dcom.sun.management.jmxremote.access.file=<path-to-access-file>The password file contains encrypted usernames and passwords, while the access file defines user permissions (read/write access).
2. Use SSL/TLS Encryption for JMX Connections
JMX connections are not encrypted by default, meaning sensitive data is transmitted in plain text. Enable SSL (or its more modern counterpart, TLS) to encrypt communications between the JMX client and server, preventing data interception or tampering.
How to enable SSL: Add the following system properties:
-Dcom.sun.management.jmxremote.ssl=true-Dcom.sun.management.jmxremote.ssl.keystore=<path-to-keystore-file>-Dcom.sun.management.jmxremote.ssl.keystore.password=<keystore-password>-Dcom.sun.management.jmxremote.ssl.truststore=<path-to-truststore-file>-Dcom.sun.management.jmxremote.ssl.truststore.password=<truststore-password>The keystore file contains the server’s SSL certificate and private key, while the truststore contains trusted client or root CA certificates.
3. Use a VPN or Private Network for JMX Access
Restrict access to the JMX interface by using a VPN or private network. This ensures that only authorized clients within trusted networks can connect to JMX, reducing the risk of external threats. Configure firewalls to block access to JMX ports from external IP addresses.
4. Limit JMX Permissions
Control access to different MBeans and operations using an access control list (ACL). Follow the principle of least privilege and grant each user only the permissions they need. Define user roles (e.g., read-only vs. read-write) to minimize the impact of a compromised account.
How to limit permissions: Specify access restrictions in the access file for each user or group.
5. Monitor JMX Connections
Monitoring and logging JMX connection attempts is crucial to detecting suspicious activities. Log failed login attempts, access patterns, and other events to proactively identify and address potential security breaches. Use Java’s built-in logging system or external monitoring tools like Prometheus or Splunk for centralized analysis.
Learn how API monitoring can improve your system’s performance in our article on API Monitoring.
Advanced JMX Monitoring Techniques
While most developers are familiar with basic JMX monitoring, there are a few lesser-known strategies that can enhance your monitoring setup:
1. Using JMX in Distributed Systems
In distributed applications, JMX can help monitor not just a single instance of a service but also the entire network of services that make up the system. By using JMX’s ability to expose metrics across multiple JVMs, you can get a holistic view of how each component in your distributed system is performing.
2. Custom MBeans for Business Metrics
Most default JMX metrics focus on system and resource health, but you can also expose your application-specific metrics through custom MBeans. This allows you to monitor things like business transactions, service-level objectives (SLOs), and other domain-specific metrics, providing you with a detailed, contextual understanding of how your application is functioning.
3. JMX for Garbage Collection Optimization
JVM garbage collection is a common bottleneck in Java applications, and using JMX, you can track garbage collection behavior in-depth. Monitoring metrics like GC pause times, GC frequency, and heap memory usage can help you fine-tune your GC strategy for better application performance.
4. Integrating JMX with Log Aggregation Tools
For more detailed diagnostics, you can integrate JMX with log aggregation tools like ELK (Elasticsearch, Logstash, Kibana) or Splunk. By correlating JMX data with logs, you can trace application issues more easily, making it simpler to troubleshoot and improve overall system reliability.
5. Alerting Based on JMX Metrics
Setting up proactive alerts based on specific JMX metrics can help prevent issues before they escalate. For example, you could set up alerts for high heap memory usage or long garbage collection pauses, which can trigger automatic remediation actions or notifications to the DevOps team.
Learn more about how Java application monitoring works in our article on Java Application Monitoring: How It Works.
5 Troubleshooting JMX Issues You Need to Know
JMX is essential for managing and monitoring Java applications, but it can sometimes present challenges. Here’s a breakdown of common JMX issues and how to troubleshoot them.
1. JMX Connection Refused
This error occurs when a client tries to connect to a JMX server, but the connection is blocked.
Possible Causes:
- JMX service isn’t running.
- Firewall or network issues blocking the JMX port.
- Incorrect JMX port.
Troubleshooting:
- Check server status: Ensure the JMX agent is running and the JVM is started with the correct system properties (
-Dcom.sun.management.jmxremote). - Verify firewall and network settings: Make sure firewalls or proxies aren’t blocking the JMX port. Use tools like telnet or nc to test connectivity.
- Confirm the port: Ensure the client is connecting to the correct JMX port (usually 1099).
2. Authentication Failures
Invalid or missing credentials can prevent access to JMX.
Possible Causes:
- Incorrect username/password.
- Misconfigured or missing authentication files.
Troubleshooting:
- Check password and access files: Verify the
jmxremote.passwordandjmxremote.accessfiles are correctly set up and accessible. - Validate file permissions: Ensure these files are accessible by the JMX process.
- Test with valid credentials: Try connecting with known working credentials.
3. SSL/TLS Connection Errors
SSL/TLS issues arise if the keystore or truststore is misconfigured or certificates are invalid.
Possible Causes:
- Invalid or expired certificates.
- Incorrect keystore/truststore settings.
- Untrusted certificate.
Troubleshooting:
- Verify keystore and truststore: Ensure paths and passwords are correct, and certificates are valid.
- Test SSL connection: Use tools like
opensslto verify SSL handshake and diagnose issues:
openssl s_client -connect <hostname>:<port>4. Data Not Being Exposed
MBeans may not be visible, even if the connection is successful, due to registration issues or configuration errors.
Possible Causes:
- MBeans aren’t properly registered.
- Incorrect JMX configuration settings.
Troubleshooting:
- Check MBean registration: Use tools like JConsole to inspect registered MBeans. If MBeans are missing, check application logs for registration errors.
- Review configuration: Ensure the JMX agent is set up to expose the necessary MBeans.
Learn how DNS monitoring ensures uptime and reliability in your network with our article on DNS Monitoring.
5. High Latency or Slow Performance
If JMX connections are slow, network or JVM performance could be the issue.
Possible Causes:
- Network latency or congestion.
- Heavy JVM load.
Troubleshooting:
- Check network performance: Use
pingortracerouteto check for network delays. - Monitor JVM performance: Use tools like
jstatortopto check CPU and memory usage. Consider optimizing JVM settings to reduce load. - Reduce MBean queries: Lower the frequency of MBean queries or batch requests to reduce JVM strain.
Conclusion
JMX monitoring is a game-changer for keeping your Java apps in top shape. With real-time performance insights, JVM health tracking, and the ability to pull in custom metrics, it’s an essential tool for any developer.
If you still have questions, come talk to us out on Discord! We’ve got a channel where you can discuss your usecase with other developers and jump into your specific use case.

