

JMX metrics offer a powerful way to monitor and optimize Java application performance. In this blog, we’ll explore the types of JMX metrics you should keep an eye on when to check them, and how they help ensure your applications run smoothly and efficiently.
What Are JMX Metrics?
Java Management Extensions (JMX) is a framework that provides a standardized way to monitor and manage Java applications.
JMX metrics offer deep insights into the performance and health of Java applications, making them essential for developers, site reliability engineers (SREs), and system administrators.
JMX exposes various runtime metrics that help track memory usage, garbage collection, CPU utilization, and more. These metrics are particularly valuable when troubleshooting performance issues and ensuring applications run efficiently—whether your application runs on localhost, in Docker, or scales across distributed systems like Apache Kafka.
For a deeper dive into JMX monitoring, check out our comprehensive guide on JMX Monitoring.
Why Are JMX Metrics Important?
1. Performance Monitoring
JMX metrics provide real-time insights into JVM performance. Tracking heap memory usage, thread counts, and garbage collection cycles helps identify bottlenecks and optimize resource allocation. Integrating with tools like the Prometheus JMX Exporter or using GitHub plugins can automate the monitoring process.
2. Application Health Tracking
Continuous monitoring of JMX metrics helps prevent unexpected failures by detecting anomalies early. This proactive approach reduces downtime and improves reliability, especially for applications running critical services like Kafka brokers or Apache Tomcat instances.
For more insights into monitoring user experience, check out our guide on Real User Monitoring (RUM).
3. Scalability Planning
Analyzing historical JMX data helps teams understand resource consumption and plan for scaling. Tracking API request loads and database connections via MBeans can be especially useful for making infrastructure decisions in high-traffic applications.
Key JMX Metrics You Should Monitor
1. Memory Usage Metrics
JVM memory management is crucial for performance. Key metrics include:
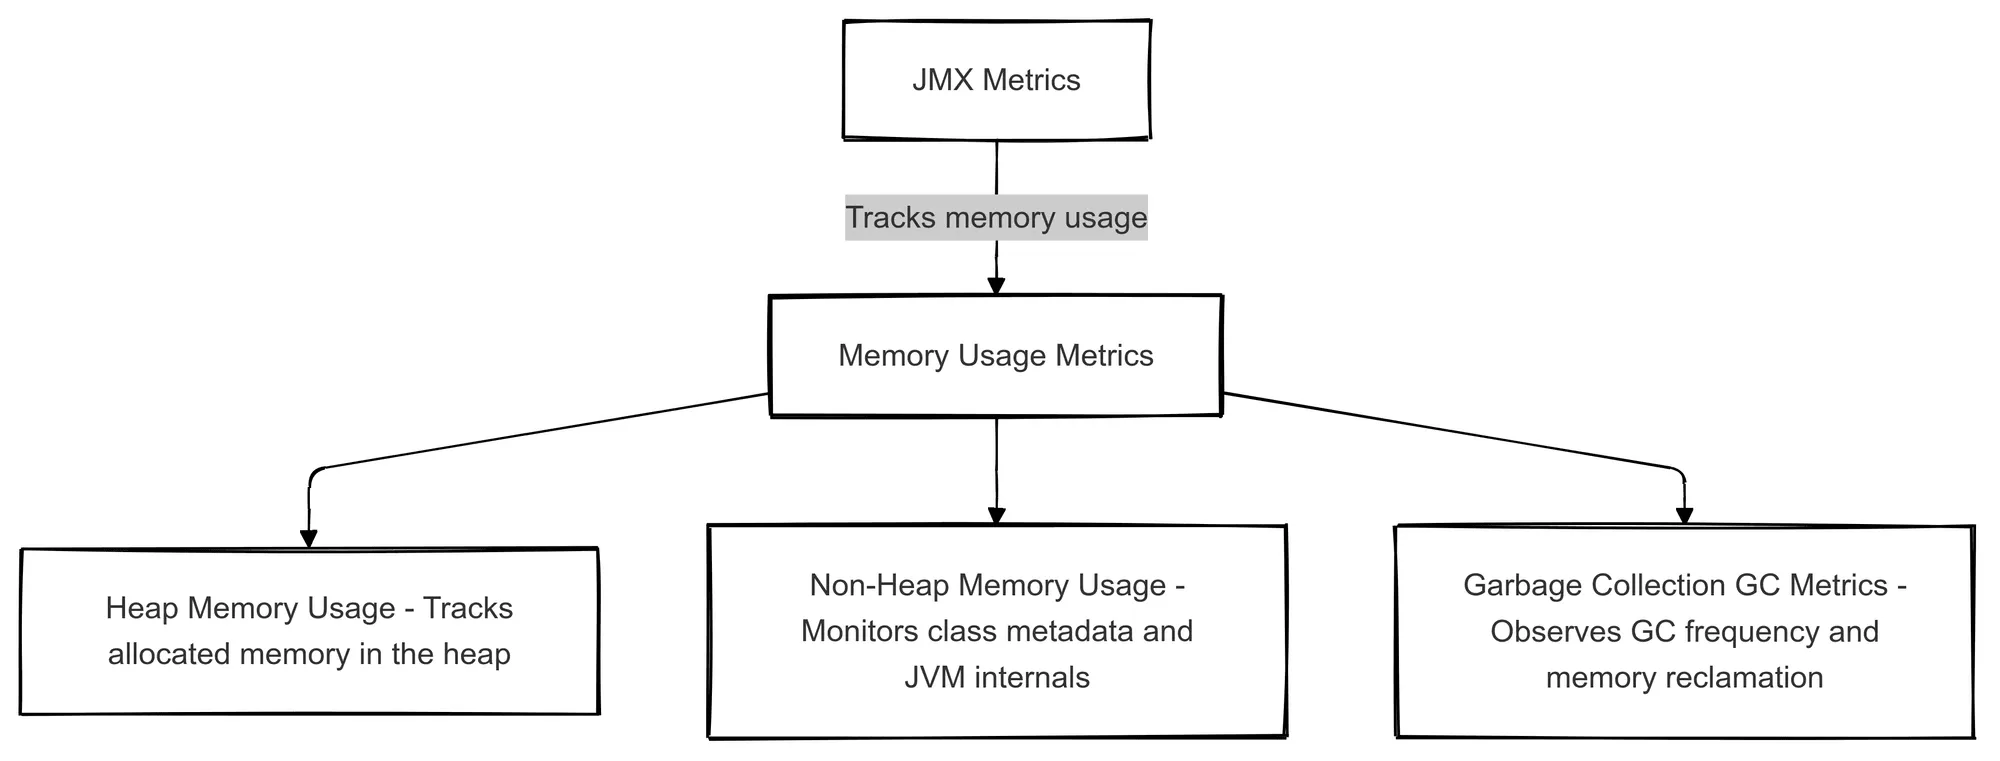
- Heap Memory Usage – Monitors memory allocated to objects in the heap, which is vital for applications running in Docker environments.
- Non-Heap Memory Usage – Tracks memory allocated for class metadata and internal JVM structures.
- Garbage Collection (GC) Metrics – Observe how often GC runs and how much memory is reclaimed. Tools like Apache JMeter use these metrics for load testing.
2. CPU and Thread Metrics
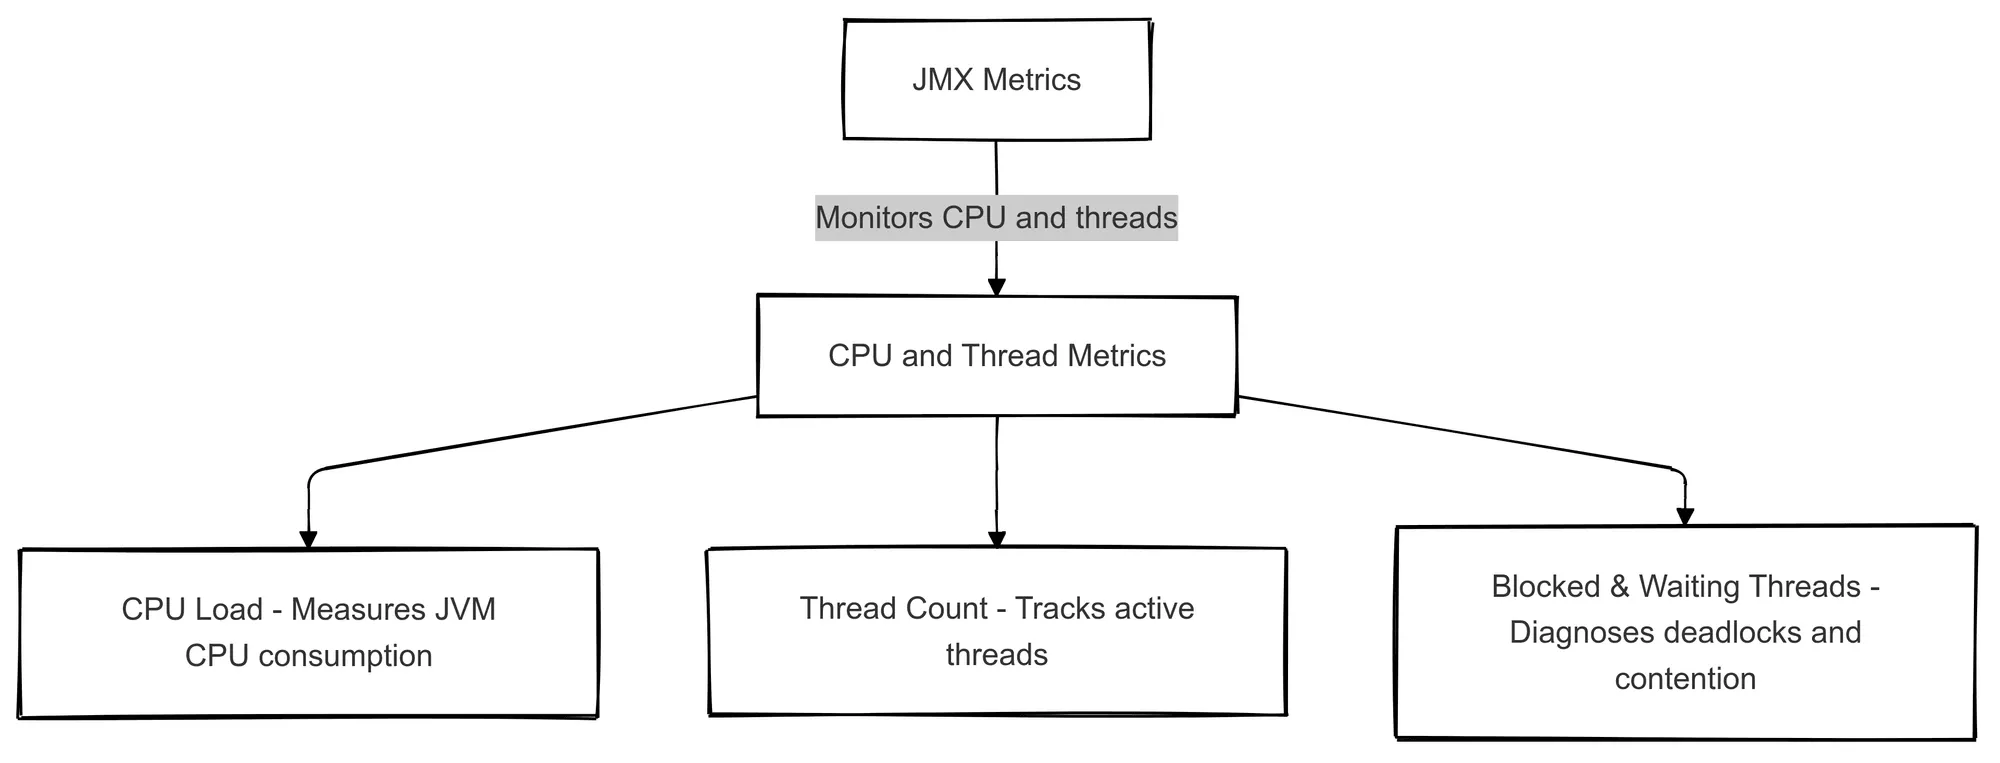
- CPU Load – Measures JVM’s CPU consumption, indicating performance overhead, especially for high-throughput Kafka consumers and producers.
- Thread Count – Tracks active threads and helps identify thread leaks, a common issue in API services.
- Blocked and Waiting Threads – Useful for diagnosing deadlocks and thread contention issues in multi-threaded applications.
3. Class Loading Metrics
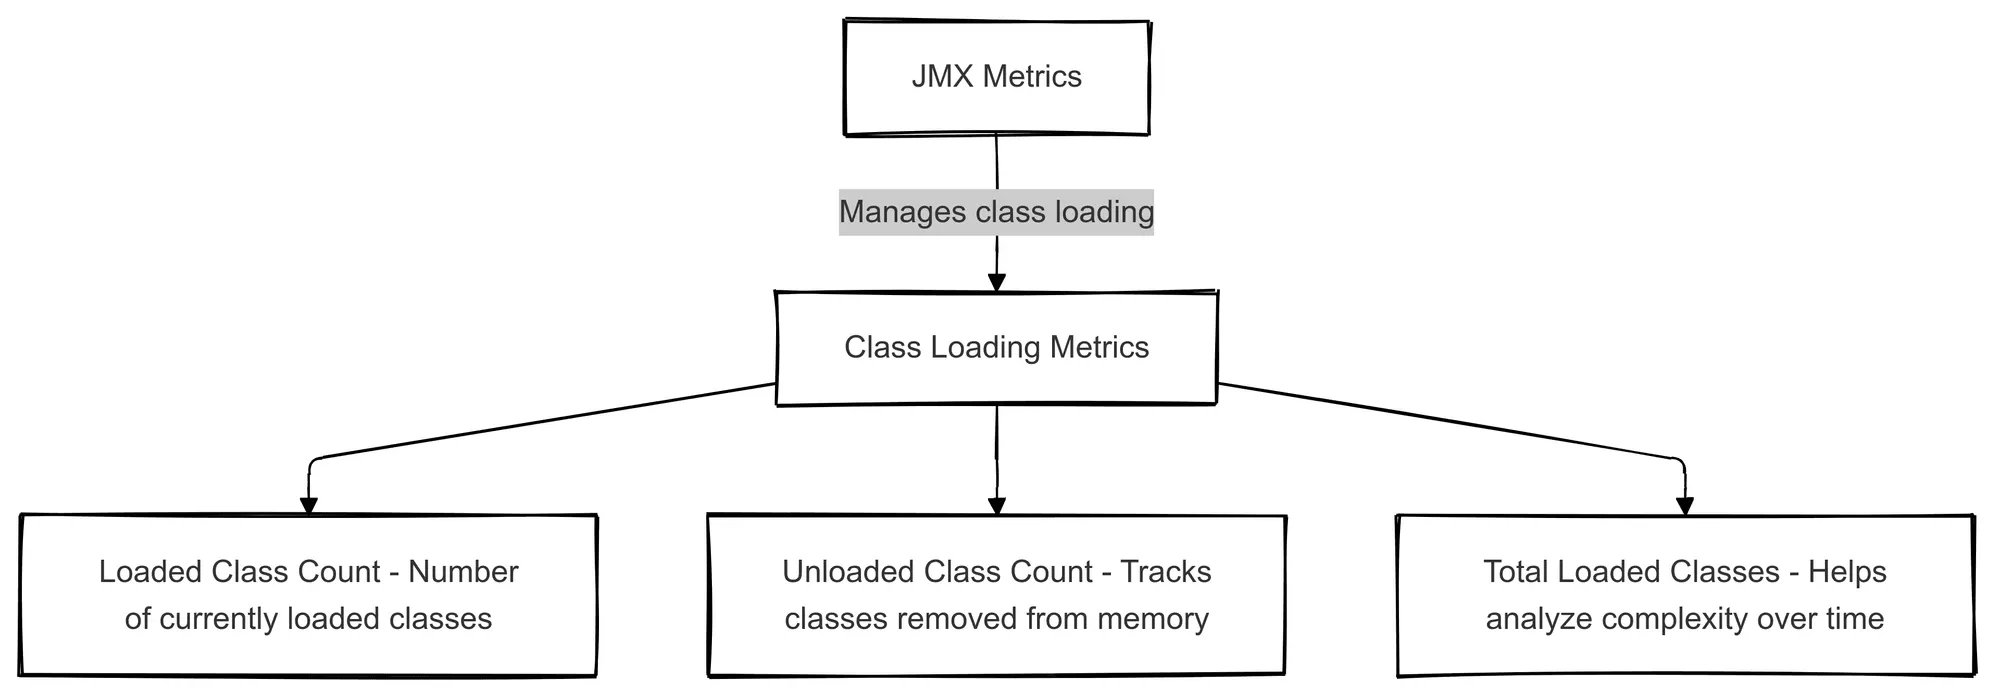
- Loaded Class Count – Monitors how many classes are currently loaded in the JVM, helping in debugging excessive class loading.
- Unloaded Class Count – Tracks classes removed from memory, which can be tuned via a configuration file.
- Total Loaded Classes – Helps analyze application complexity and memory usage over time, useful when debugging issues reported in GitHub issues.
4. MBean Attributes
MBeans (Managed Beans) expose real-time, application-specific metrics such as:
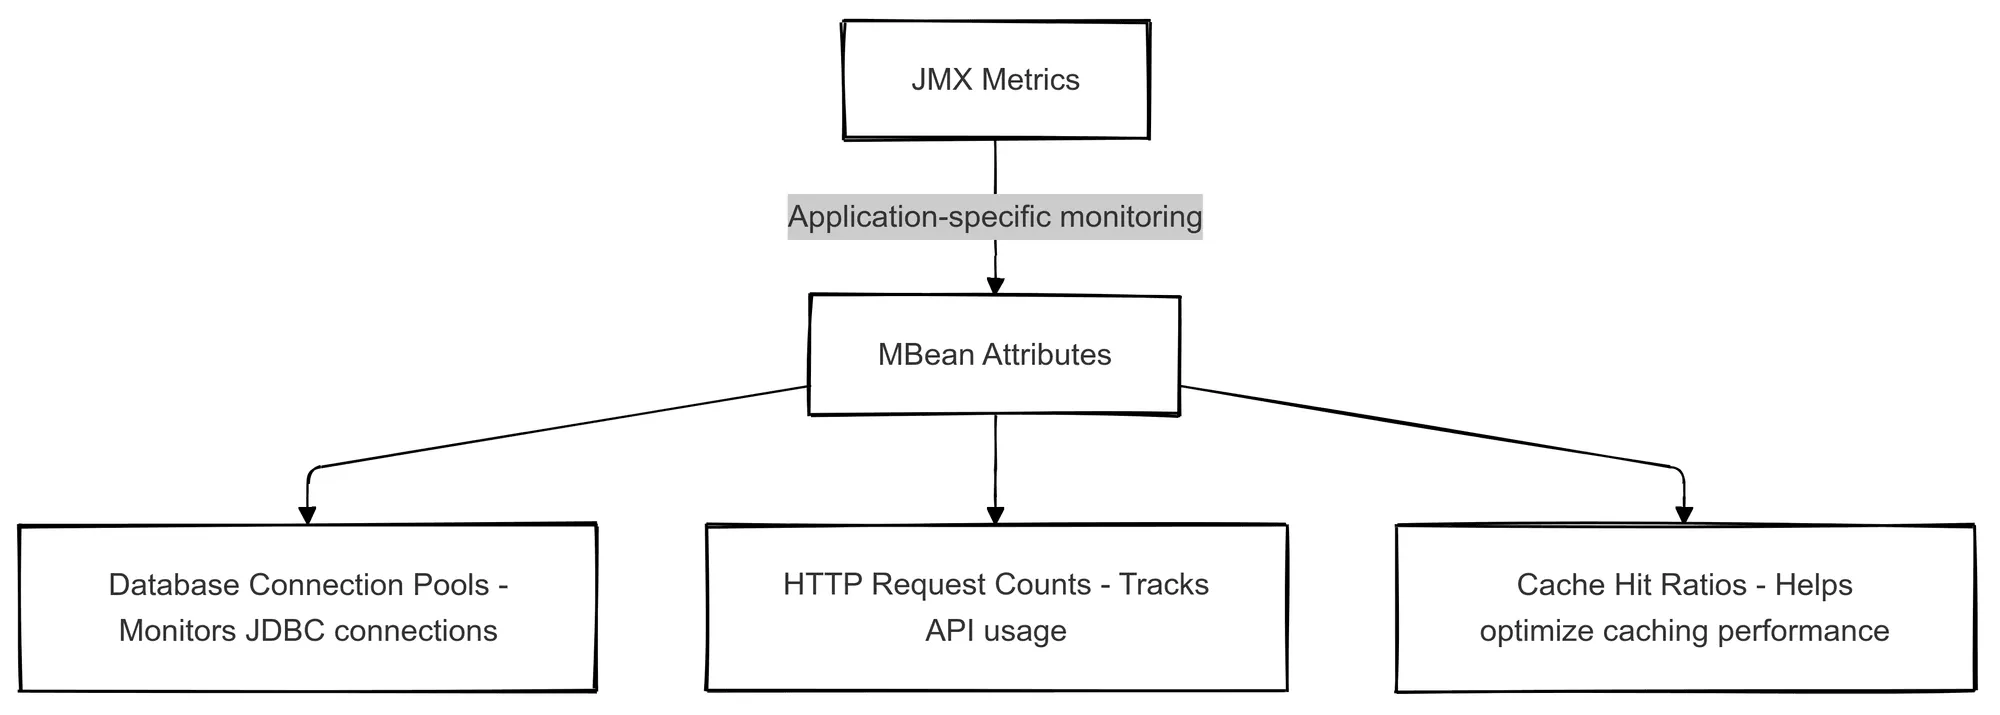
- Database connection pools – Monitor JDBC connections for APIs handling large-scale transactions.
- HTTP request counts – Essential for tracking API usage patterns.
- Cache hit ratios – Helps in performance tuning for caching layers like Redis.
With the right plugin or monitoring tool, you can collect and analyze JMX metrics from various sources, including Kafka, Apache Tomcat, and custom-built Java applications running on localhost or containerized environments. Configuring notifications for anomalies ensures that performance issues don’t go unnoticed.
To explore Prometheus metrics, take a look at our detailed blog on Prometheus Metrics: Types & A Deep Dive.
What Is JMX Monitoring?
JMX Monitoring is like having a dashboard for your Java application’s inner workings. It lets you peek under the hood of your JVM (Java Virtual Machine) and keep tabs on memory usage, active threads, CPU load, and even garbage collection.
Think of it as a health check for your Java app. Without it, you’re flying blind—issues like memory leaks or thread deadlocks could creep in without warning. But with JMX Monitoring, you can spot trouble before it spirals into production nightmares.
You can use tools like JConsole, VisualVM, or Prometheus (with a JMX Exporter) to collect and analyze these metrics. Whether you’re troubleshooting performance bottlenecks or just making sure everything runs smoothly, JMX Monitoring is a must-have for Java applications.
For more tips on optimizing your monitoring strategy, don’t miss our post on Application Monitoring Best Practices.
What Are MBeans?
MBeans (Managed Beans) are the backbone of JMX. They’re Java objects that expose real-time stats about your application—kind of like tiny sensors embedded in your code, reporting on everything from memory usage to database connections.
There are different types of MBeans:
- Standard MBeans – The basic ones, used for monitoring and simple configurations.
- Dynamic MBeans – More flexible, letting you define attributes and methods at runtime.
- Open MBeans & Model MBeans – Used for more advanced use cases with extra metadata and customization.
When you enable JMX in your Java app, these MBeans start surfacing useful metrics that can be accessed via monitoring tools. Want to check how many active threads your app has? There’s an MBean for that. Need to track garbage collection behavior? Yep, there’s an MBean for that too.
In short, MBeans are your direct line to what’s happening inside your Java app, making them essential for effective monitoring and troubleshooting.
How to Collect and Monitor JMX Metrics
Using JConsole
JConsole is a built-in tool in the JDK that allows real-time monitoring of JMX metrics. It provides a graphical user interface for observing memory usage, CPU consumption, and active threads.
Using Prometheus and JMX Exporter
Prometheus JMX Exporter is widely used for collecting JMX metrics and integrating them into a time-series database. This setup enables long-term trend analysis and alerting.
Using Grafana for Visualization
Grafana can be used alongside Prometheus to create dashboards for JMX metrics, helping teams monitor application health effectively.
For a deeper understanding of Grafana, check out our guide on Grafana Variables.
What Are JMX Layers?
JMX is structured into three layers, each handling different responsibilities for monitoring and managing Java applications:
1. Instrumentation Layer
This is where MBeans (Managed Beans) are created. They collect and expose various data about your application. For example, an MBean might track the number of active database connections.
2. Agent Layer
In this layer, the MBean Server acts as the intermediary between the MBeans and management tools. It registers MBeans and processes requests from monitoring clients, enabling data to be accessed.
3. Remote Management Layer
This layer facilitates the connection of external tools to your application. It uses protocols like RMI, JMXMP, or HTTP (via JMX Exporter for Prometheus), allowing remote monitoring and management of your application.
How JMX Helps You Build Management Services
JMX isn’t just about monitoring—it also lets you build management services for Java applications. These services can handle things like configuration changes, logging adjustments, resource management, and even triggering maintenance tasks without restarting the app.
Here are some common management services you can develop using JMX:
- Dynamic Configuration Management – Update logging levels, database connection pools, or feature flags on the fly.
- Performance Monitoring – Keep an eye on memory usage, thread activity, and CPU load.
- Health Checks & Alerts – Detect anomalies and trigger alerts before things go south.
- Garbage Collection Control – Force GC runs in specific scenarios (though use this wisely).
- Application-Specific Admin Tasks – Expose custom operations, like clearing caches or resetting internal states.
How to Integrate JMX to Build Management-Aware Apps
A management-aware application doesn’t just run—it reports its status and allows external control when needed. By integrating JMX, you can build applications that expose key operational data and even let admins tweak settings without a restart.
To make an application management-aware:
- Define MBeans – Create Java objects that expose attributes (e.g., memory usage) and operations (e.g., reset counters).
- Register MBeans with an MBean Server – This makes them accessible for external tools.
- Use a JMX Connector – This lets remote monitoring tools (like JConsole or Prometheus) interact with your application.
- Secure Access – Configure authentication and permissions so only authorized users can modify settings.
This approach makes debugging easier and helps prevent downtime by enabling live adjustments instead of full deployments for minor changes.
To learn more about monitoring Java applications, check out our detailed post on Java Application Monitoring: How It Works.
Is JMX Right for Your Application?
JMX is useful when you need:
- Real-time monitoring – Keep tabs on memory, CPU, and threads.
- Runtime configuration updates – Adjust logging levels or performance settings without redeploying.
- Fine-grained control – Perform admin tasks like clearing caches or resetting services remotely.
- Scalability insights – Analyze resource usage to optimize performance.
It’s especially handy in enterprise Java applications, microservices, and long-running server processes where visibility and control are crucial.
However, if you’re working on a lightweight application with minimal monitoring needs, JMX might be overkill. In such cases, simpler logging or basic metrics collection could be enough.
3 Lesser-Known JMX Metrics That Can Boost Your Monitoring
While most monitoring setups focus on memory and thread metrics, there are a few lesser-known JMX metrics that can offer deeper insights into JVM performance.
These often-overlooked metrics could help uncover hidden issues and improve your application’s efficiency.
1. Compilation Time Metrics
The Total Compilation Time metric tracks how long the Just-In-Time (JIT) compiler spends optimizing bytecode. A sudden spike in this metric could indicate performance problems, as excessive compilation time can slow down application execution.
For example, if your app is performing complex calculations or processing large volumes of data, it’s worth keeping an eye on this metric to avoid performance degradation.
- Total Compilation Time: Tracks JIT compiler optimization time.
2. Safepoint Metrics
The Safepoint Count and Safepoint Time metrics track JVM pauses during critical operations like garbage collection and thread stack unwinding. These pauses can introduce latency, so monitoring these metrics is important for performance tuning.
Frequent safepoints or long pauses can create noticeable delays, especially in applications with high throughput or low latency requirements. Keeping track of these metrics helps you understand and reduce JVM pause times.
- Safepoint Count: Tracks how often the JVM pauses for GC or thread management.
- Safepoint Time: Measures the duration of these pauses, highlighting potential latency issues.
3. Metaspace Utilization
Metaspace Usage tracks the memory used for storing class metadata. This is particularly important for applications that dynamically load classes, such as those built on frameworks like Spring or Hibernate.
If the metaspace usage is high and continues to grow, it could lead to OutOfMemoryError. Monitoring this metric ensures that dynamic class loading does not overwhelm memory resources.
- Metaspace Usage: Tracks memory for class metadata storage.
For a comprehensive look at key monitoring metrics, explore our blog on Golden Signals for Monitoring.
Best Practices for JMX Metrics Monitoring
Enable Remote JMX Monitoring Securely
When enabling remote JMX monitoring, always use authentication and encryption. This prevents unauthorized access to sensitive metrics. Make sure you use secure protocols like SSL/TLS to safeguard your data.
Set Up Alerts for Critical Metrics
Configure alerts for key metrics like heap memory, high GC pause times, and thread counts. Alerts help you catch potential performance issues before they affect your users, allowing you to take action before problems escalate.
Tune JVM Parameters Based on Insights
Use the insights from JMX metrics to fine-tune your JVM parameters. Adjust options like -Xms, -Xmx, and -XX:MaxMetaspaceSize to optimize your JVM’s performance based on real-time data.
Conclusion
JMX metrics are a powerful tool for understanding Java application performance. Implementing a robust JMX monitoring strategy helps keep applications running smoothly, minimizes downtime, and provides valuable insights into JVM behavior. If you haven’t started tracking JMX metrics yet, now is the time to do so!
FAQs
What is a JMX metric?
A JMX metric is a performance or system-level data point exposed by the Java Management Extensions (JMX) framework. These metrics help monitor and manage Java applications by providing insights into memory usage, garbage collection, thread activity, and more.
What is the JMX tool?
JMX itself is a framework built into Java for monitoring and managing applications. Tools like JConsole, VisualVM, and Prometheus JMX Exporter use JMX to collect and visualize metrics.
What is the difference between JMS and JMX?
JMS (Java Message Service) is used for messaging between applications, while JMX (Java Management Extensions) is for monitoring and managing Java applications. JMS deals with message queues, whereas JMX provides insights into an application’s internal state.
What are JMX files used for?
JMX files often store configuration details for JMeter test plans, but in a broader JMX context, they can also be used to define and manage MBeans (Managed Beans) for application monitoring.
Which metrics can you monitor with a JMX extension?
JMX extensions allow you to monitor JVM-specific metrics like heap memory usage, garbage collection stats, active threads, CPU load, and database connection pool statistics.
Is JMX still used?
Yes, JMX is widely used in Java-based applications for monitoring and management, especially in enterprise environments. Many observability tools integrate JMX to collect performance data.
What is JMX and how to use it?
JMX (Java Management Extensions) is a framework for managing and monitoring Java applications. You can enable JMX in a Java application, use MBeans to expose metrics and connect tools like JConsole or Prometheus to collect data.
What is JMX Monitoring?
JMX Monitoring is the practice of collecting and analyzing performance metrics from Java applications using JMX. This helps track JVM health, optimize resource usage, and detect performance bottlenecks.
Why is JMX Monitoring Important for DevOps?
JMX monitoring helps DevOps teams track application performance, detect memory leaks, analyze garbage collection behavior, and optimize JVM performance—all of which contribute to better system reliability.
Why Should I Monitor Java Applications?
Monitoring Java applications helps identify performance issues, optimize resource usage, prevent downtime, and ensure a smooth user experience. JMX provides real-time visibility into JVM internals.
Where do I find the JMX Metrics in Application Insights?
In Azure Application Insights, JMX metrics can be collected using Azure Monitor and the Java Agent. These metrics can be found in the “Metrics” section under the “Monitoring” tab in the Azure portal.
What is Prometheus?
Prometheus is an open-source monitoring and alerting toolkit widely used for collecting time-series metrics. It can scrape JMX metrics using the JMX Exporter, making it useful for monitoring Java applications.
What do you monitor with JMX in a Java application?
Common metrics include:
- Heap and non-heap memory usage
- Garbage collection stats
- Thread count and states
- CPU usage
- Active database connections
- Application-specific MBeans
How can I access JMX metrics from a Java application?
JMX metrics can be accessed via tools like JConsole, VisualVM, or through remote connections using JMX clients. You can also expose JMX metrics over HTTP using the Prometheus JMX Exporter.
How can I collect and analyze JMX metrics for performance tuning?
You can use tools like JConsole, VisualVM, or Prometheus to collect JMX metrics, and then analyze trends in memory usage, garbage collection, and thread behavior to optimize performance.
How can I collect JMX metrics for performance analysis?
JMX metrics can be collected using monitoring tools like Prometheus (with the JMX Exporter), Micrometer, or Datadog. These tools provide dashboards and alerting for JVM performance analysis.
How can I configure JMX to monitor JVM performance metrics?
You can enable JMX monitoring by starting your Java application with the following options:
-Dcom.sun.management.jmxremote -Dcom.sun.management.jmxremote.port=9000 -Dcom.sun.management.jmxremote.authenticate=false -Dcom.sun.management.jmxremote.ssl=false
