
Debugging issues in microservices architectures presents unique challenges. When a request passes through dozens of services, identifying performance bottlenecks or failure points becomes exponentially more difficult. Jaeger distributed tracing addresses this problem by providing clear visibility into request flows across service boundaries.
This guide explores Jaeger's core capabilities, implementation approaches, and practical troubleshooting techniques. We'll focus on concrete examples and actionable insights that DevOps teams can apply immediately to improve system observability.
What is Distributed Tracing in Jaeger?
Jaeger is an open-source, end-to-end tracing system that helps you monitor and troubleshoot complex distributed systems. Created by Uber Engineering and now part of the Cloud Native Computing Foundation (CNCF), Jaeger lets you track request flows across service boundaries, making it easier to spot performance bottlenecks and debug issues.
Consider it as a GPS for your requests – mapping the entire journey through your microservices architecture with timestamps at each stop.
Why DevOps Engineers Need Distributed Tracing Solutions
Microservices are great for scaling teams and systems, but they create a visibility nightmare. Here's why Jaeger distributed tracing matters:
- Find bottlenecks fast – See exactly which service is causing delays
- Debug production issues – Trace requests across your entire stack
- Optimize performance – Identify unnecessary calls and latency issues
- Understand dependencies – Map how your services connect and interact
- Detect anomalies – Spot unusual patterns that might indicate problems
Without distributed tracing, you're guessing where problems might be. With Jaeger, you get a map that shows exactly what's happening.
How Tracing Architecture Works in Jaeger
Jaeger uses a concept called "spans" to track operations within your system. Here's the basic flow:
- Instrumentation – Your code creates spans for operations
- Collection – Spans are sent to Jaeger agents or collectors
- Storage – Data is saved in a backend like Elasticsearch or Cassandra
- Visualization – You view traces in the Jaeger UI
Each span includes:
- Start and end times
- Operation name
- Parent-child relationships
- Tags and logs for context
This creates a complete picture of request flow through your system, showing you exactly where time is spent.
Jaeger Architecture Components
Jaeger has a modular architecture with several key components:
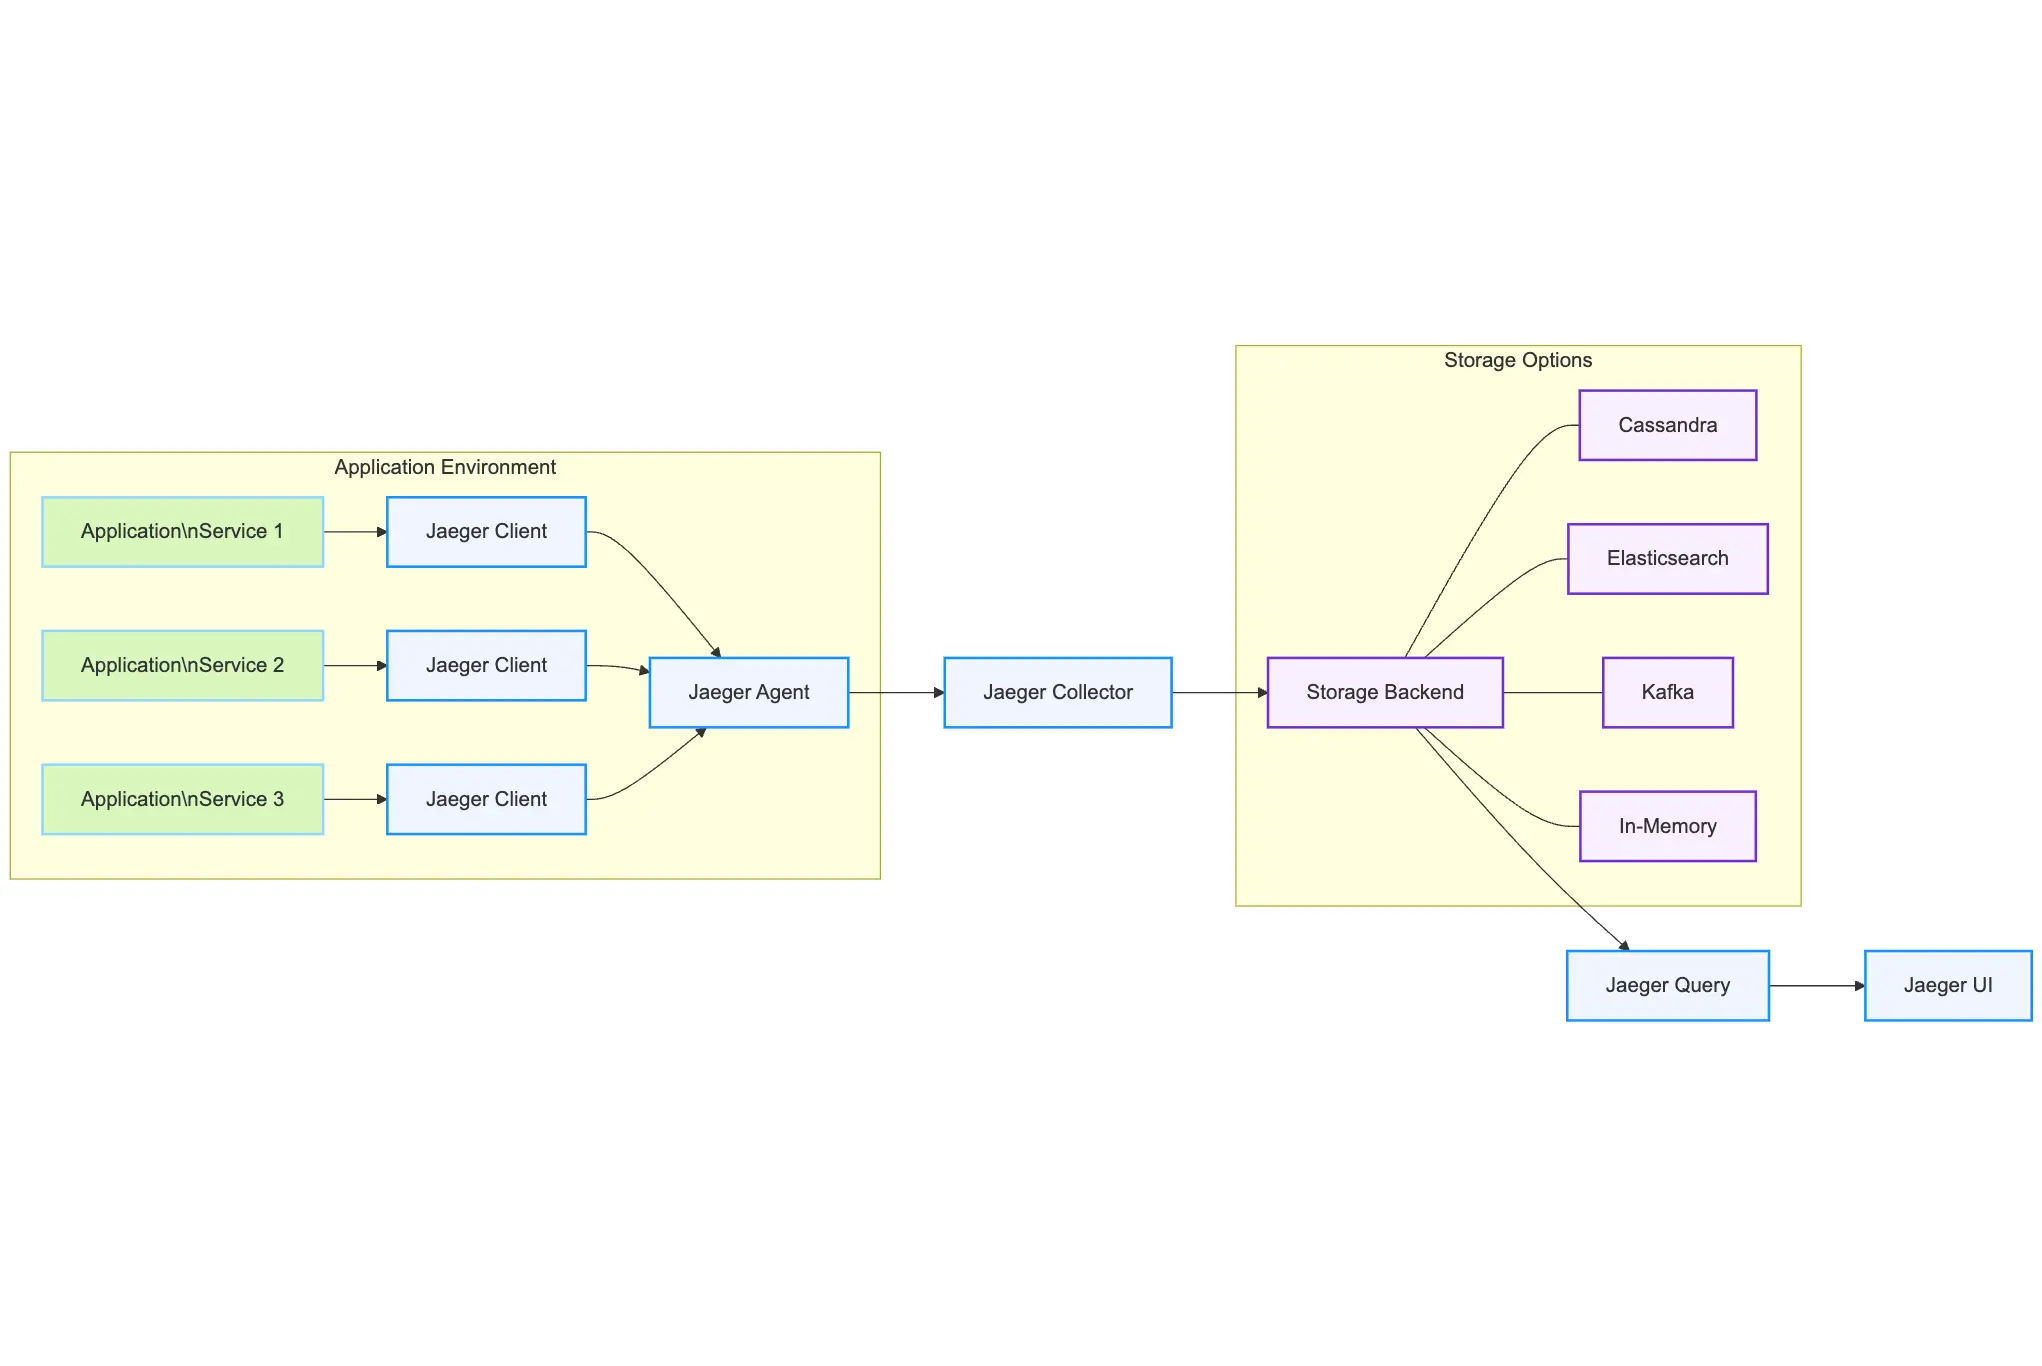
Jaeger Client – Libraries in different languages that create spans in your code and send them to the agent.
Jaeger Agent – A network daemon that listens for spans sent by the client and forwards them to the collector. Typically deployed on the same host as your application.
Jaeger Collector – Receives spans, validates them, performs processing (like indexing), and stores them. Can be scaled horizontally.
Storage Backend – Where your trace data lives. Options include Cassandra, Elasticsearch, Kafka, and in-memory storage.
Jaeger Query – Service that retrieves traces from storage for analysis.
Jaeger UI – Web interface that allows you to search and view traces, analyze spans, and understand service dependencies.
Context Propagation
For tracing to work across service boundaries, context needs to be passed from one service to another. This is called propagation, and Jaeger supports multiple formats:
- Jaeger Propagation – Jaeger's native format
- B3 – Used by Zipkin
- W3C TraceContext – The standard cross-platform format
Here's how context propagation works in practice:
# Receiving a request in Service A
incoming_span = tracer.extract(Format.HTTP_HEADERS, request.headers)
span = tracer.start_span('process-in-a', child_of=incoming_span)

# Making a request to Service B
tracer.inject(span, Format.HTTP_HEADERS, outgoing_request.headers)
This passes the trace context from Service A to Service B, maintaining the parent-child relationship.
Step-by-Step Guide to Setting Up Jaeger
Getting Jaeger running is straightforward. Here's how to do it:
Deploying the Jaeger Backend
The quickest way to start is with the all-in-one Docker image:
docker run -d --name jaeger \
  -e COLLECTOR_ZIPKIN_HOST_PORT=:9411 \
  -p 5775:5775/udp \
  -p 6831:6831/udp \
  -p 6832:6832/udp \
  -p 5778:5778 \
  -p 16686:16686 \
  -p 14268:14268 \
  -p 14250:14250 \
  -p 9411:9411 \
  jaegertracing/all-in-one:1.29
For production, you'll want a proper setup with separate components:
- Jaeger Agent
- Jaeger Collector
- Storage Backend (Elasticsearch/Cassandra)
- Jaeger Query (UI)
Kubernetes Deployment
For Kubernetes environments, use the Jaeger Operator for easier management:
# Install the Jaeger operator
kubectl create namespace observability
kubectl create -f https://github.com/jaegertracing/jaeger-operator/releases/download/v1.30.0/jaeger-operator.yaml -n observability

# Create a simple Jaeger instance
kubectl apply -f - <<EOF
apiVersion: jaegertracing.io/v1
kind: Jaeger
metadata:
  name: jaeger
spec:
  strategy: allInOne
  allInOne:
    image: jaegertracing/all-in-one:1.30.0
    options:
      log-level: debug
  storage:
    type: memory
    options:
      memory:
        max-traces: 100000
  ingress:
    enabled: true
EOF
This creates a basic Jaeger setup in your Kubernetes cluster. For production, you'd want to configure persistent storage and adjust resource limits.
Instrumenting Your Applications
There are two main ways to add Jaeger distributed tracing to your apps:
Option 1: Use Jaeger Client Libraries
Jaeger has client libraries for:
- Go
- Java
- Node.js
- Python
- C++
- C#
Option 2: Use OpenTelemetry (Recommended)
OpenTelemetry is the new standard for instrumentation that works with Jaeger and other tracing systems:
// Java example with OpenTelemetry
Tracer tracer = GlobalOpenTelemetry.getTracer("my-service");
Span span = tracer.spanBuilder("process-payment").startSpan();
try (Scope scope = span.makeCurrent()) {
    // Your code here
} catch (Exception e) {
    span.recordException(e);
    throw e;
} finally {
    span.end();
}Configuring Sampling Strategies
Tracing every request in production will kill your performance. Instead, use sampling:
| Sampling Type | Best For | Trade-offs |
|---|---|---|
| Constant | Testing | Predictable overhead |
| Probabilistic | Production | May miss important traces |
| Rate Limiting | Balanced approach | More complex to configure |
| Adaptive | Dynamic environments | Highest implementation complexity |
For most teams, starting with probabilistic sampling at 10% is a good balance.
Essential Best Practices for Jaeger Implementation
Want to get the most from Jaeger? Follow these tips:
Create Meaningful Span Names
Don't use generic names like "process" or "handle." Use specific names that tell you what the span does:
Good: process-payment Bad: process
Add Context with Tags
Tags make your traces more useful. Add information like:
- User IDs
- Request parameters
- Environment info
- Business context
# Python example
with tracer.start_as_current_span("process-order") as span:
    span.set_attribute("order.id", order_id)
    span.set_attribute("customer.type", customer_type)
    # Process order
Log Important Events
Use span logs to record key events:
// JavaScript example
const span = tracer.startSpan('processOrder');
try {
  // Process order
  span.log({event: 'order_validated'});
  // More processing
  span.log({event: 'payment_processed'});
} catch (error) {
  span.log({event: 'error', message: error.message});
  throw error;
} finally {
  span.finish();
}
Link Related Traces
For asynchronous processing, use span references to connect related traces:
// Go example
childSpan := tracer.StartSpan(
  "process-async-task",
  opentracing.FollowsFrom(parentSpan.Context()),
)Troubleshooting Common Jaeger Implementation Issues
Even the best tools have their quirks. Here's how to fix common Jaeger headaches:
Resolving Missing Traces
If your traces aren't showing up:
- Check that your services are connecting to the right Jaeger agent address
- Verify sampling is configured correctly
- Check for networking issues between your services and Jaeger
- Look for errors in your Jaeger collector logs
Fixing Incomplete Traces
For traces with missing spans:
- Make sure all services are instrumented
- Check for timeouts in your services
- Verify context propagation between services
- Check that spans are being closed properly
Addressing Performance Issues
If Jaeger is slowing things down:
- Reduce sampling rate
- Use batch reporting
- Consider upgrading your storage backend
- Enable adaptive sampling
Comparing Distributed Tracing Tools for Your Stack
Jaeger isn't the only player in town. Here's how it stacks up:
| Tool | Strengths | Pricing |
|---|---|---|
| Last9 | Unified monitoring with metrics, logs, and traces; high-cardinality support; excellent OpenTelemetry integration | No. of events ingested, cost-efficient at scale |
| Zipkin | Simple to set up; lightweight | Free, open-source |
| Lightstep | Powerful analytics; great UI | Premium pricing, varies by usage |
| Instana | Automated discovery; AI-driven insights | Enterprise pricing, contact sales |
Integrating Jaeger with Your Existing Monitoring Stack
Jaeger works best as part of a complete observability strategy. Here's how to connect it with your other tools:
Combining Prometheus and Jaeger for Full Visibility
Track both metrics and traces for complete visibility:
- Use Prometheus for system and service-level metrics
- Use Jaeger for request-level tracing
- Add trace IDs to your logs and metrics for correlation
Enhancing Logging with Trace Context
Add trace context to your logs for easy correlation:
# Python example with structured logging
logger.info("Processing payment", extra={
    "trace_id": get_current_span().get_context().trace_id,
    "span_id": get_current_span().get_context().span_id,
    "payment_id": payment_id
})
This lets you go from a log entry straight to the relevant trace.
How to Scale Jaeger for Production Environments
As your system grows, your tracing needs to keep up:
Selecting the Right Storage Backend
| Storage | Best For | Considerations |
|---|---|---|
| Memory | Development | Data is lost on restart |
| Cassandra | High write throughput | Resource intensive |
| Elasticsearch | Better querying | Needs tuning for high volume |
| Kafka + Storage | Buffering high loads | More complex architecture |
Designing an Enterprise Deployment Architecture
For large-scale production:
- Deploy Jaeger agents as sidecars or on each host
- Scale collectors horizontally
- Use Kafka as a buffer between collectors and storage
- Set up proper indexes in your storage backend
Measuring the Business Impact of Jaeger Distributed Tracing
Here's what you can achieve with Jaeger:
- Cut troubleshooting time from hours to minutes by pinpointing issues
- Reduce MTTR (Mean Time To Recovery) with faster root cause analysis
- Improve performance by identifying and fixing slow services
- Better understand service dependencies for more reliable architecture decisions
- Detect issues before users by spotting unusual patterns
Conclusion
Got questions about Jaeger distributed tracing, or want to share your implementation tips? Join our Discord Community where DevOps professionals swap ideas, troubleshooting advice, and best practices.
Remember, in distributed systems, you can't fix what you can't see – and Jaeger gives you the visibility you need to keep complex systems running smoothly.
FAQs
How much overhead does Jaeger add to my services?
With proper sampling (typically 1-10% of requests), the overhead is minimal – usually less than a 3% increase in CPU and memory usage.
Can Jaeger work with serverless architectures?
Yes, though it requires some adaptation. For AWS Lambda, you can use the AWS X-Ray integration or customize the Jaeger client to work within the Lambda execution environment.
How do I secure my Jaeger installation?
For production, use:
- TLS for all communications
- Authentication for the UI and API
- Network isolation for the collectors and storage
- Sanitization of sensitive data in spans
What's the difference between metrics, logs, and traces?
- Metrics tell you WHAT is happening (system-level measurements)
- Logs provide details on events and errors
- Traces show you HOW requests flow through your system
You need all three for complete observability.
How does Jaeger compare to AWS X-Ray?
Jaeger is open-source and cloud-agnostic, while X-Ray is AWS-specific. Jaeger generally offers more flexibility but requires more setup, while X-Ray integrates well with other AWS services but locks you into their ecosystem.
Can I use Jaeger with non-microservice architectures?
Yes! While it's especially useful for microservices, Jaeger provides value for any system with multiple components – even monoliths with various modules or external dependencies.