

Reduce alert noise by 70% through intelligent aggregation, clear ownership boundaries, and filtering metrics that don’t map to user-facing issues.
Monitoring starts with a straightforward goal: understand your system’s health and identify issues before users notice them. You set up metrics, create dashboards, and configure some alerts. At first, it works well.
Over time, your stack gets bigger and more complicated. New services get added. Each incident reveals a visibility gap, so you add instrumentation to cover it. Eventually, you end up with thousands of time series, hundreds of alerts, and notification channels that generate more questions than answers.
This pattern is common. Monitoring systems often scale faster than teams can maintain them, and the symptoms-longer incident response times, alert fatigue, rising costs-tend to build gradually.
Why Monitoring Becomes Difficult to Manage
Most setups begin with a few core metrics-error rates, latency, and resource usage. After a few release cycles, when more components enter the picture, the monitoring surface grows too, and the extra signals can blur what’s actually important.
Some common patterns that contribute to this:
- Auto-discovery features in monitoring tools instrument everything by default, providing comprehensive coverage, but sometimes including more than you need
- Alert templates get reused across services without adjustment for different impact profiles or SLOs
- Reactive additions after incidents, where new alerts get added to prevent specific problems from recurring
- Different tools across teams, where each group selects what works best for their needs, creating multiple data sources
- Metrics that persist beyond their useful life because there’s no clear process for reviewing and removing them
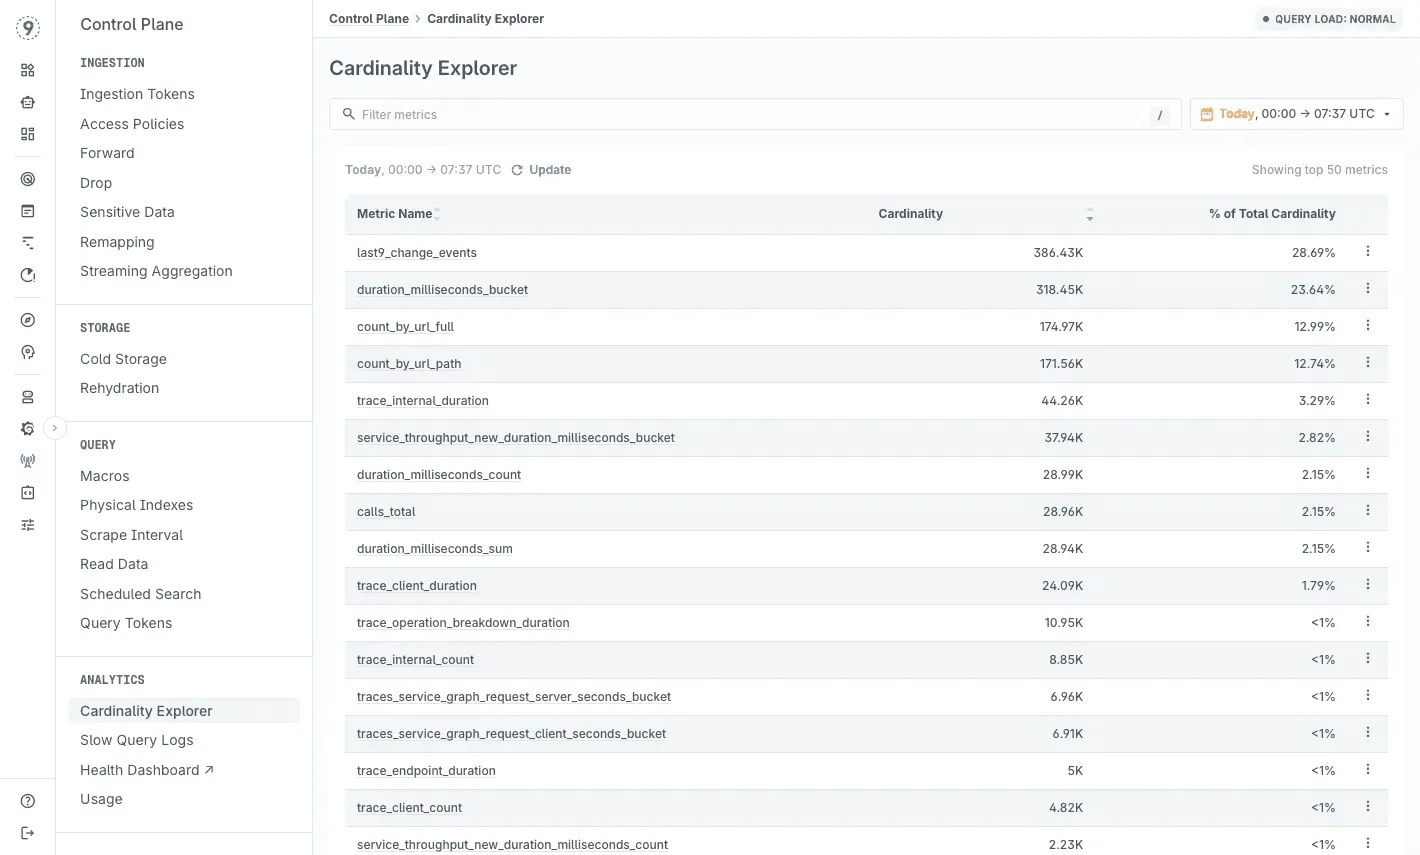
You might end up with thousands of time series where only a portion actually informs decisions. With Last9’s Cardinality Explorer, you get a clear view of which metrics and labels are driving your cardinality growth and which ones aren’t pulling their weight - so you can decide what’s truly worth keeping.
Understanding the Impact
Alert volume shapes how teams respond. When on-call rotations involve dozens of alerts each week, and most don’t need action, urgency naturally fades. The risk is that real issues take longer to stand out once the overall signal-to-noise ratio drops.
This usually shows up as:
- Alerts being acknowledged later than expected
- Important pages blending in with routine notifications
- Teams spending more time deciding whether something matters
Incident response slows down when responders have to jump across dashboards or sift through verbose logs to find relevant information. Each extra step spent narrowing the scope adds directly to the mean time to resolution.
Common friction points include:
- Checking multiple dashboards to confirm the same symptom
- Filtering logs just to identify the affected service or request
- Re-running queries with slightly different filters to isolate the issue
Costs tend to build quietly. Many monitoring tools charge based on data volume and query load. For example:
- 100 million data points per hour
- $0.30 per million
- ≈ $21,600 per month
In practice, a portion of those metrics rarely get queried outside of fixed dashboards. Identifying and removing low-usage metrics can free up budget without reducing visibility.
On-call rotation also becomes harder to sustain:
- High false-positive rates increase stress during shifts
- New team members take longer to learn which alerts matter
- Constant noise adds cognitive load that compounds over time
With Last9, you’re not limited to observing monitoring overload after it happens. You can see where volume and cardinality are coming from and apply aggregation and ingestion controls so your telemetry stays useful instead of overwhelming.
If you’re trying to understand why a latency spike only affects certain users, regions, or deployments, this guide walks through how to track down the real cause step by step!
Practical Approaches to Reduce Cloud Monitoring Overload
Start With Alert Ownership and SLOs
Every alert works better when it has a clear owner and a clear link to user impact. If an alert fires and no one knows who should act-or what it means for users-that’s usually a sign the alert needs refinement.
Start by defining your service level objectives. Ask a simple question: what does acceptable service look like to your users?
For many systems, that might mean 99.9% availability and p95 latency under 200ms.
Once those targets are clear, identify the metrics that directly reflect SLO health. These become your primary alerts-the ones that signal real or imminent user impact. Other metrics still matter, but they’re better suited for investigation than paging.
Example: alert rule with clear ownership and user impact
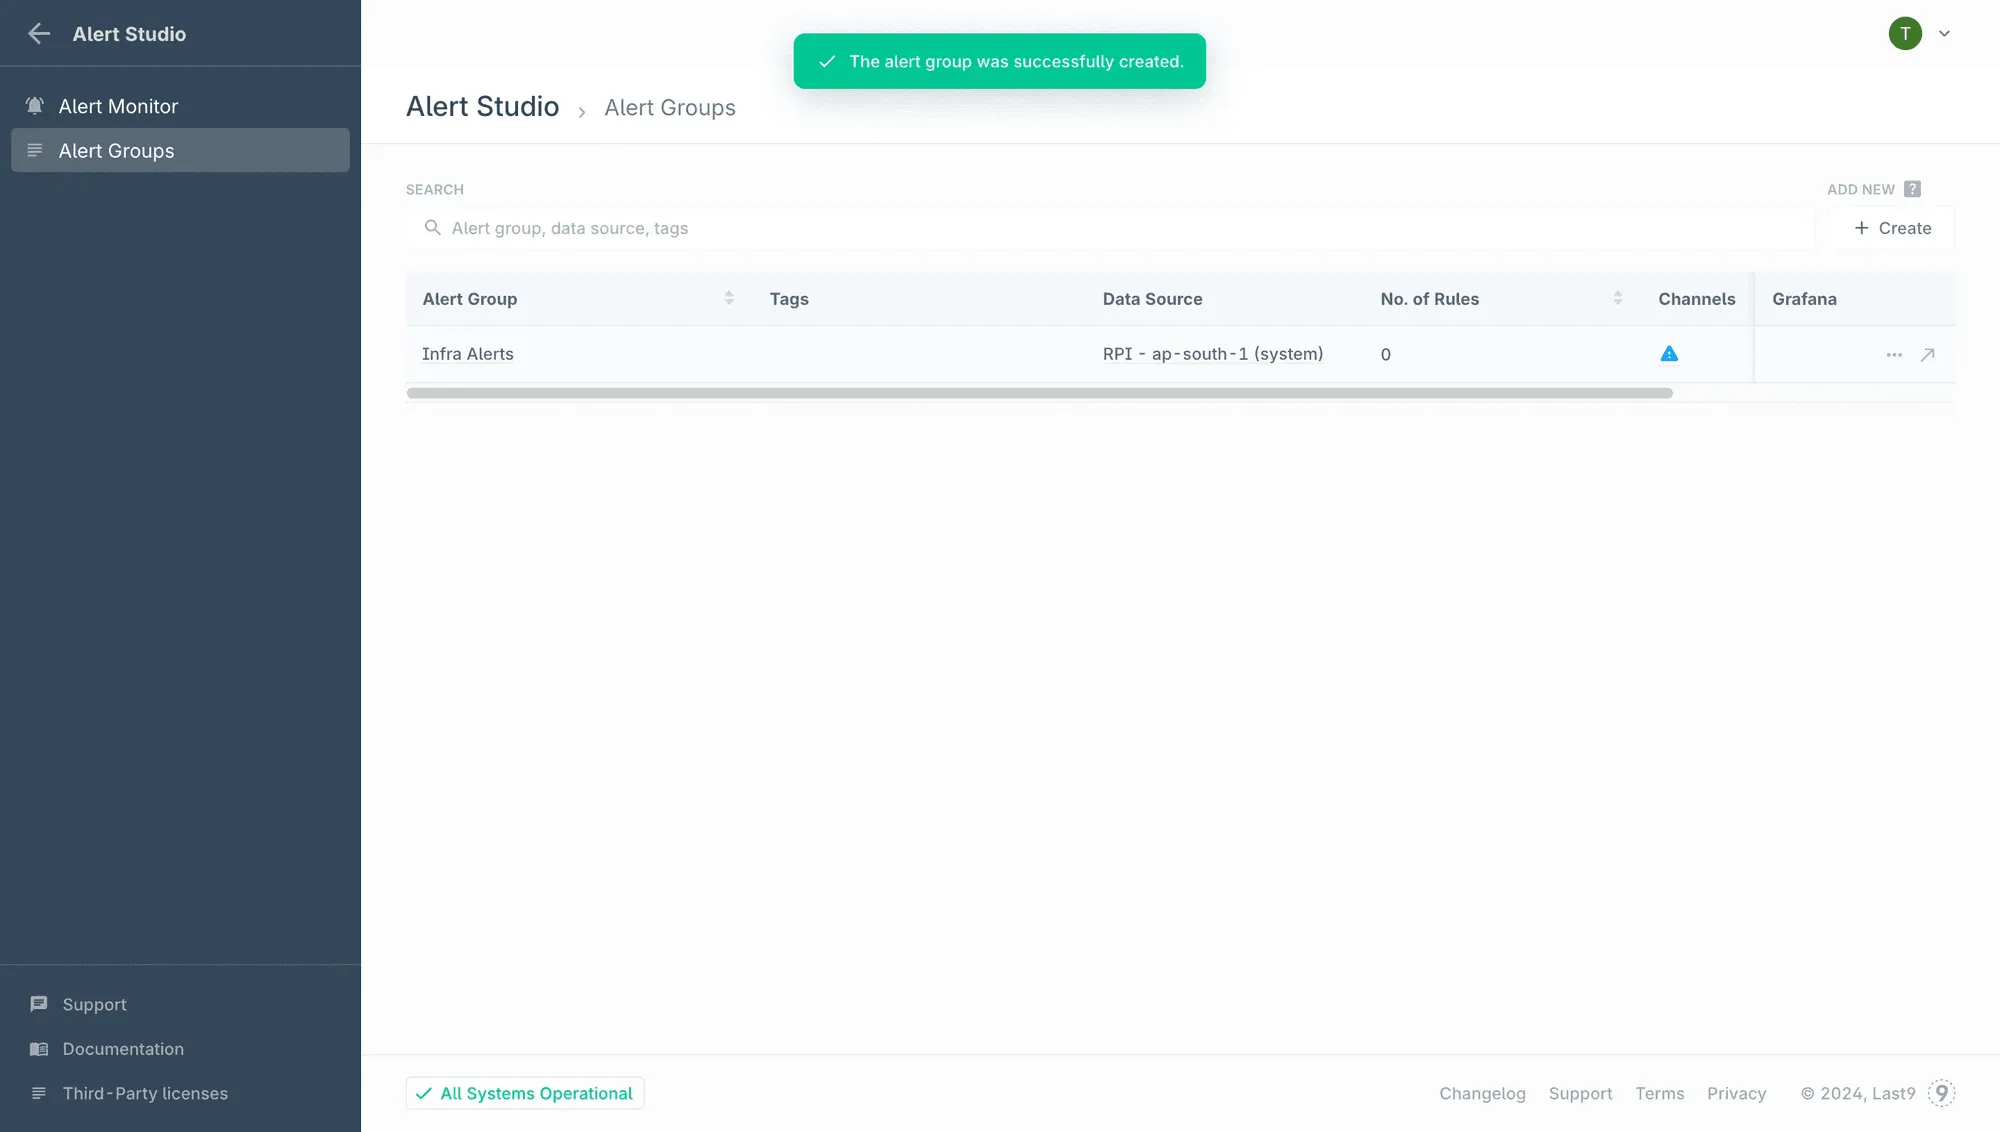
alert: HighErrorRateexpr: rate(http_requests_total{status=~"5.."}[5m]) > 0.05for: 5mlabels: severity: page owner: platform-team user_impact: highannotations: summary: "Error rate above 5% for 5 minutes" runbook: "https://wiki.company.com/runbooks/high-error-rate" slo_impact: "Degrading 99.9% availability SLO"In Last9, alerts are organized into alert groups and evaluated using PromQL-based rules, so you can structure alerts around services or teams instead of managing isolated conditions. You get a real-time view of alert state across groups, along with historical health context, which makes it easier to see patterns, tune thresholds, and route notifications without adding more noise.
Aggregate and Reduce Cardinality in Alerting Paths
High-cardinality metrics carry valuable context. Dimensions like customer, endpoint, zone, or pod are often exactly what you need when something goes wrong.
The challenge isn’t the data itself - it’s evaluating every possible combination continuously for routine alerts and dashboards.
Metrics such as http_requests_total can quickly expand when combined with dimensions like:
- method
- endpoint
- status
- customer_id
- deployment_zone
- pod_name
That expansion is expected. The key is deciding where that detail is evaluated.
A practical approach is to separate routine monitoring from deep debugging.
For alerts and high-level dashboards, you can aggregate metrics to the service level so they answer simple questions quickly: Is this service healthy right now?
When you need detail, the richer breakdowns remain available for targeted investigations instead of constant evaluation.
Example: pre-aggregating for alerting
# Original high-cardinality metrichttp_requests_total{method="GET", endpoint="/api/users", status="200", pod="pod-abc-123"}
# Pre-aggregated recording rule for alertsjob:http_requests_total:rate5m = rate(http_requests_total[5m])
This keeps alerts focused and fast, without discarding the underlying detail.
For a practical overview of how high-cardinality data shows up in modern systems and how teams work with it effectively, see the high-cardinality guides here!
Filter Metrics at the Source
Not all telemetry needs to leave your infrastructure immediately or at full resolution. Just like debug logs are useful locally but noisy in production, not every metric needs to be exported at full fidelity.
The goal isn’t to remove context - it’s to decide when and where that context is evaluated.
Common ways to shape metrics early include:
- Pre-aggregating histograms instead of exporting raw observations
- Pausing export for consistently healthy checks after long periods of stability
- Sampling very high-frequency metrics that don’t need second-level precision
- Exporting different views by environment, such as
productionvsstaging
Example: conditional export by environment
if os.Getenv("ENV") == "production" { metrics.Export(prometheusExporter)} else { // Dev/staging: export summary stats instead metrics.Export(summaryExporter)}By shaping metrics before export, you reduce unnecessary ingestion while keeping the signals that support routine monitoring and debugging.
If you’re exploring ways to get better visibility without overspending on telemetry, this blog covers practical approaches and considerations!
Implement Metric Lifecycle Management
Metrics evolve along with your system. Some remain critical, others fade in relevance, and a few quietly persist after their original purpose has passed.
Treating metrics as long-lived assets helps keep monitoring useful over time.
A lightweight, periodic review can include:
- Reviewing which metrics and time series have been queried in the last
90 days - Flagging signals that never appear during investigations
- Checking alert behavior - alerts that never fire may need tuning or reframing
- Identifying duplicate or overlapping metrics across teams
Standardize Where It Helps
Different teams often use different tools. That flexibility can be useful, but it tends to add friction when incidents span multiple services.
During investigations, this friction usually shows up as:
- Switching between multiple UIs
- Translating metric names and query formats
- Rebuilding context under time pressure
You don’t need to force everyone onto a single vendor. A small amount of standardization goes a long way, especially around the data itself.
Helpful starting points include:
- Common metric naming conventions across services
- Shared dashboards for cross-service visibility
- Consistent alert formats and severity levels
Monitor Third-Party Dependencies
Most systems rely on external services-payment gateways, authentication providers, cloud APIs. When one of them degrades, the impact usually shows up in your application metrics before you get a clear explanation elsewhere.
A few practices help make those issues easier to spot:
- Track latency and error rates for outbound calls to external services
- Monitor third-party status pages or health APIs where available
- Alert when dependency behavior starts to threaten your SLOs
- Include dependency signals alongside application metrics in incident dashboards
With Last9, you can explore your application metrics, logs, and traces in one place, which makes it easier to correlate internal behavior with external dependency issues. That context helps you quickly tell whether a problem originates inside your system or outside it.
Build Knowledge Transfer Into the Process
Monitoring systems accumulate context over time-why an alert exists, why a threshold was chosen, and which investigation paths tend to work. When that context lives only in people’s heads, it’s easy to lose.
Making monitoring knowledge explicit helps teams respond more consistently:
- Document the intent behind each alert and the expected response
- Link runbooks directly from alerts, so context is available during incidents
- Run periodic monitoring walkthroughs to share how systems are observed
- Include observability reviews as part of onboarding
- Capture and review learnings from past incidents
Clear, accessible documentation reduces ramp-up time and gives everyone more confidence when issues surface, especially during high-pressure situations.
Alongside metrics and traces, logs can quickly drive observability spend, and this post walks through ways to control log data costs without dropping useful context!
Habits That Prevent Monitoring From Degrading
Design for Fast Answers During Incidents
During an incident, jumping between multiple monitoring tools slows diagnosis. What helps most is having dashboards and runbooks built around a small set of clear questions:
- Are users affected right now?
- What’s the scope (how many users, which regions or services)?
- When did the issue start?
- What changed recently?
- What’s the primary symptom-errors, latency, or availability?
Pre-built dashboards and saved queries that answer these questions directly reduce guesswork and help shorten mean time to resolution.
Watch for Early Warning Signs
Monitoring issues usually don’t appear overnight. They tend to build up gradually.
Some early indicators include:
- On-call shifts getting steadily busier
- Alerts taking longer to review or acknowledge
- Investigation time increasing for similar issues
- Teams flagging alert noise or fatigue
Spotting these patterns early gives you more options to adjust before monitoring becomes a liability.
Add Lightweight Monitoring Health Checks
You don’t need a heavy process to keep monitoring effectively. A simple, recurring review often goes a long way.
A short monthly check can include:
- Trends in alert volume
- The percentage of alerts that led to meaningful action
- Time spent on investigations
- Backlog growth related to monitoring or alerts
Even a 15-minute review can surface patterns worth addressing.
Validate Alerts in Practice
Alerts should behave the way you expect when something breaks. Periodic testing helps confirm that they still do.
- Trigger known failure modes and verify alerts fire
- Check whether responders treat alerts as urgent or routine
- Adjust thresholds or routing when signals don’t match intent
If alerts don’t fire when they should, you’ve found a coverage gap. If they fire but get ignored, that’s usually a tuning or routing issue.
Keep the Focus on Clarity
More metrics don’t automatically mean better visibility. Tracking thousands of time series doesn’t guarantee faster diagnosis. In many cases, a smaller set of well-chosen signals makes it easier to spot real problems and act on them quickly.
Why Monitoring Overload Is Easier to Manage With Last9
Cloud monitoring overload usually shows up when alerts and dashboards keep expanding, but the way you evaluate them doesn’t change. You end up checking too many signals too often, even when most of them aren’t relevant to the issue at hand.
With Last9, you structure alerting around alert groups and indicators. You define alerts using PromQL, group them by service or ownership, and review their behavior over time. That makes it easier to understand whether a service is unhealthy, instead of reacting to individual alerts in isolation.
You control what gets aggregated by defining streaming aggregation rules that generate new metrics. For example, create one rollup metric that drops high-cardinality labels for stable dashboards and alerting, and another rollup that retains only the essential high-cardinality labels for debugging and correlation.
During incidents, you don’t need to compensate for tooling gaps with extra alerts. Move from metric spike → trace → exact log line instantly.
The practical effect is simpler monitoring:
- Fewer alerts firing independently for the same issue
- Faster scoping during incidents
- Less pressure to over-alert or over-simplify metrics
Try Last9 today, or book time with our team to see how it fits into your stack.
FAQs
How do I know which metrics to keep and which to remove?
Start from alerting and debugging paths, not raw counts. Metrics that participate in SLO alerts, are referenced in runbooks, or are routinely used to scope incidents (service, endpoint, dependency) should stay. Metrics that exist only because instrumentation emitted them-and aren’t used to trigger alerts or narrow failures-are candidates for aggregation or removal from routine monitoring.
Won’t reducing metrics mean missing important signals?
Only if you remove debugging dimensions, not evaluation paths. The goal is to avoid continuously evaluating every label combination. Keep high-cardinality dimensions available for investigation, but don’t alert or dashboard on them by default. Alerts should answer “is something wrong?”; detailed metrics answer “where and why?”.
How do I approach metric cleanup with my team?
Treat it like performance tuning, not cleanup. Pick one service and map:
- SLO signals
- Alert rules
- Metrics actually referenced during recent incidents
Anything outside those paths gets reviewed. Make changes incrementally and verify impact on page volume, investigation time, and alert clarity before expanding.
What should I do when one service generates far more alerts than others?
First, check alert intent. Many noisy services alert on symptoms that are downstream effects, not root causes. Tighten aggregation windows, alert on rates instead of raw counts, and prefer service-level signals over instance-level ones. If noise persists, it often points to unclear ownership or unstable dependencies-not insufficient alerting.
What’s the right balance between proactive and reactive monitoring?
Proactive alerts should map directly to SLO burn or capacity saturation. Reactive alerts should be rare and sharp. If alerts mostly fire after users complain, you’re missing leading indicators. If proactive alerts fire often without correlating to incidents, you’re evaluating too much detail too early.

