

Both Grafana Tempo and Jaeger are distributed tracing tools designed for modern microservice architectures. Jaeger, released as an open-source project by Uber in 2015, has matured into a graduated CNCF project. Tempo, announced by Grafana Labs in October 2020, is a newer entrant focused on high-volume tracing with a unique storage architecture.
Before comparing these tools in detail, let’s quickly review what distributed tracing is and why it matters.
What is Distributed Tracing?
In microservice architectures, a single user request typically flows through dozens or hundreds of services before completing. This distribution creates a significant challenge: how do you track performance issues when a request spans multiple independent services?
Distributed tracing solves this by tracking requests as they move through your services, giving you visibility into:
- Which services did the request touch
- How long did each service take to process the request
- Where failures or bottlenecks occurred
There are two key concepts in distributed tracing:
- Spans: Single operations within a trace representing work done by one service
- Trace Context: Information passed between services to connect spans into a complete trace
With proper tracing, you can see exactly how a request performs across your entire system without manually checking multiple dashboards.
You can learn more about the basics of traces and spans and how they fit into observability in our guide here: https://last9.io/blog/traces-spans-observability-basics/
The Architecture Behind Jaeger and Tempo
Jaeger and Tempo are both built for distributed tracing, but they follow very different design philosophies. Understanding how each system is structured helps explain its trade-offs, especially when it comes to scale, storage, and operational overhead.
Jaeger: Modular, with Database-Backed Storage
Jaeger follows a classic, multi-component architecture where each part handles a specific responsibility.
Applications are instrumented using Jaeger Client libraries, which generate span data. This data is first sent to a Jaeger Agent, a lightweight daemon that runs alongside your service and forwards spans to the Collector.
The Jaeger Collector processes, validates, and writes this data to storage, typically using indexing databases like Cassandra or Elasticsearch. From there, traces can be queried through the Jaeger Query service and visualized in the Jaeger UI.
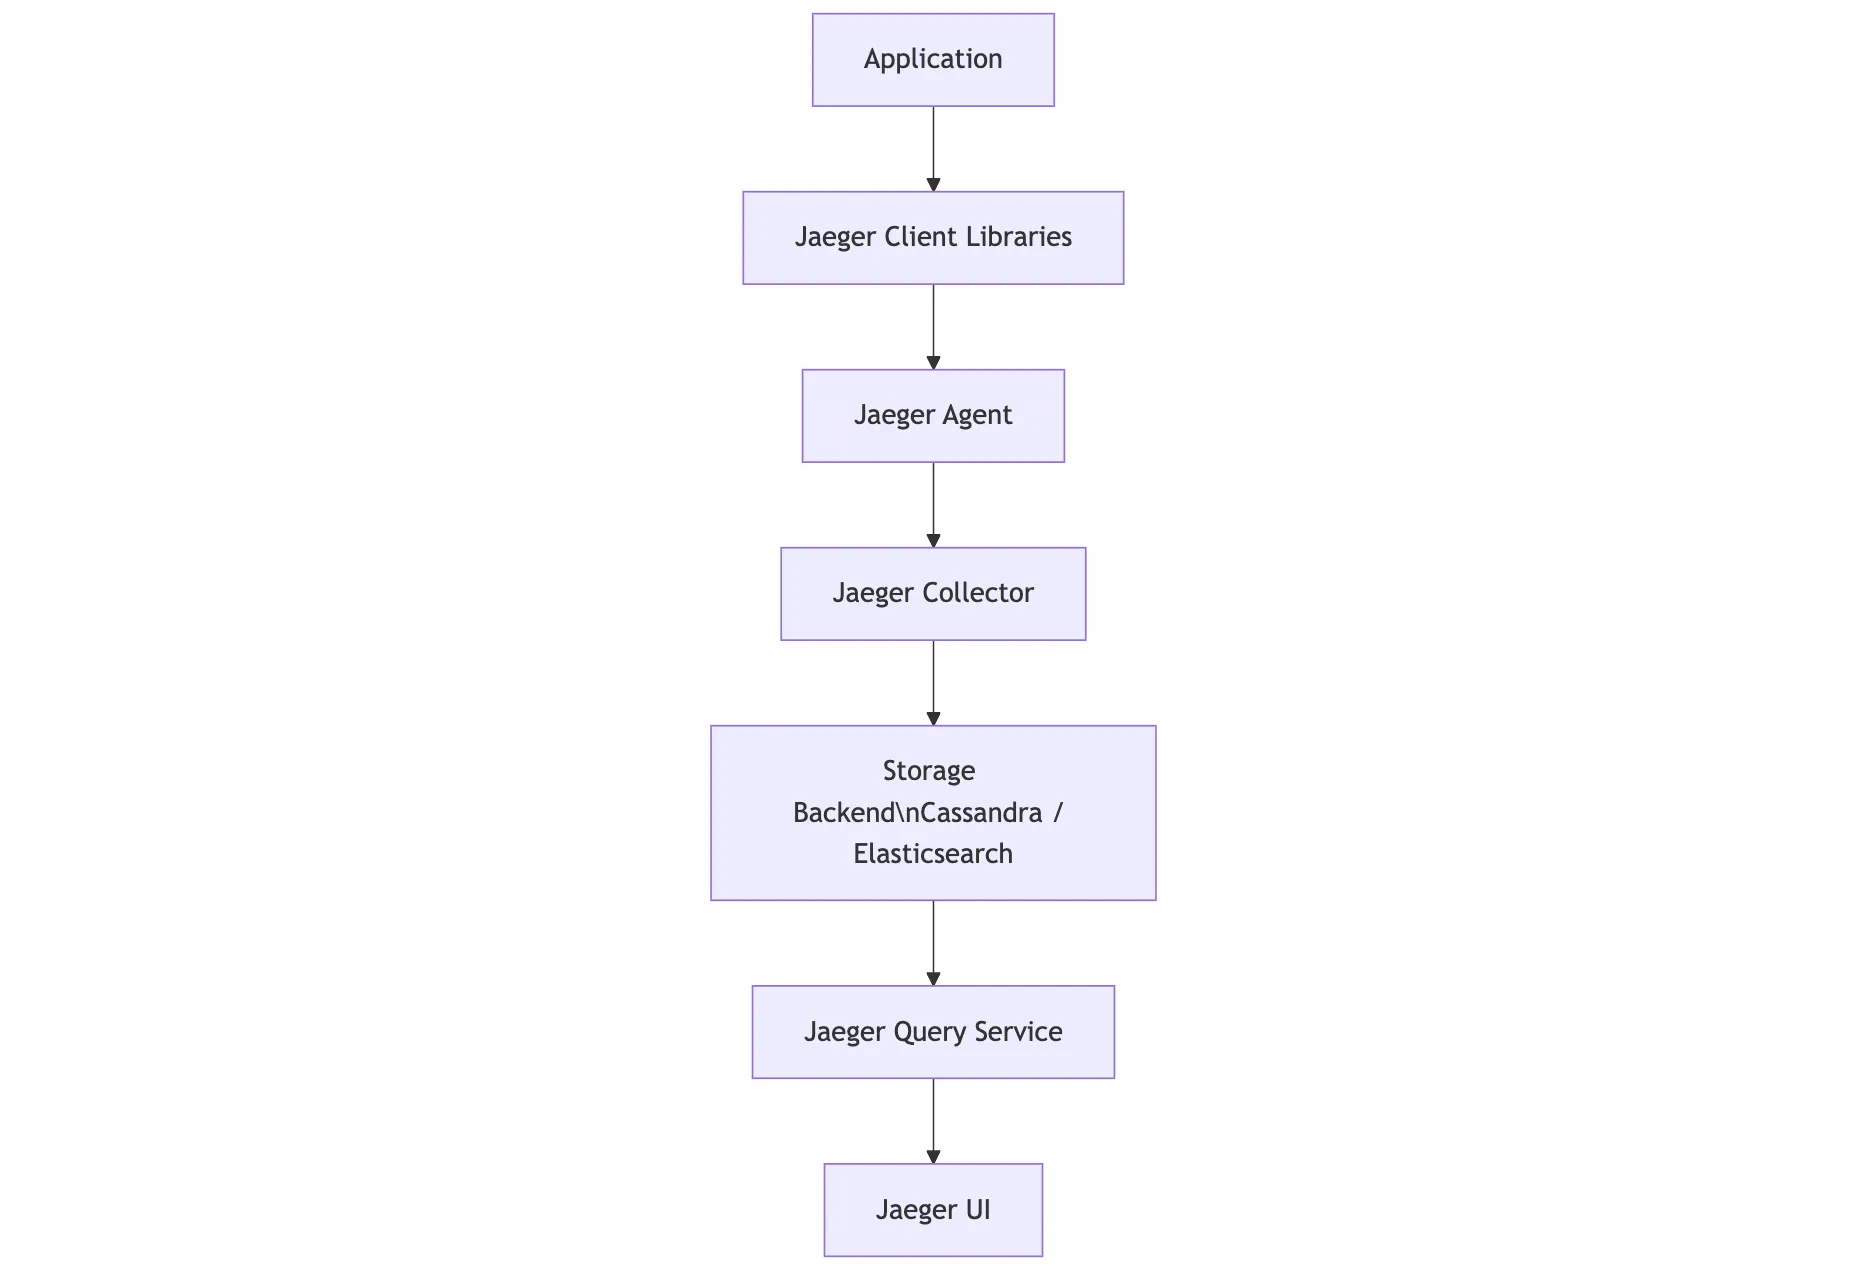
This architecture is flexible and mature, but it comes with overhead—especially when managing and scaling stateful databases.
Tempo: Built for Simplicity and Scale
Tempo was designed to avoid the operational complexity of managing databases altogether. Instead, it uses object storage—like S3, GCS, or Azure Blob—and simplifies how trace data is stored and retrieved.
Trace data enters Tempo through a Distributor, which accepts multiple formats (OTLP, Jaeger, Zipkin). The data is buffered and grouped by the Ingester, then written to backend storage in blocks.
Behind the scenes, a Compactor optimizes stored blocks, reducing volume and improving efficiency. When it’s time to query data, requests go through a Query Frontend, which routes them to the Querier for lookup by trace ID.
Visualization is handled using Grafana, not a custom UI — keeping things familiar for teams already using the Grafana stack.
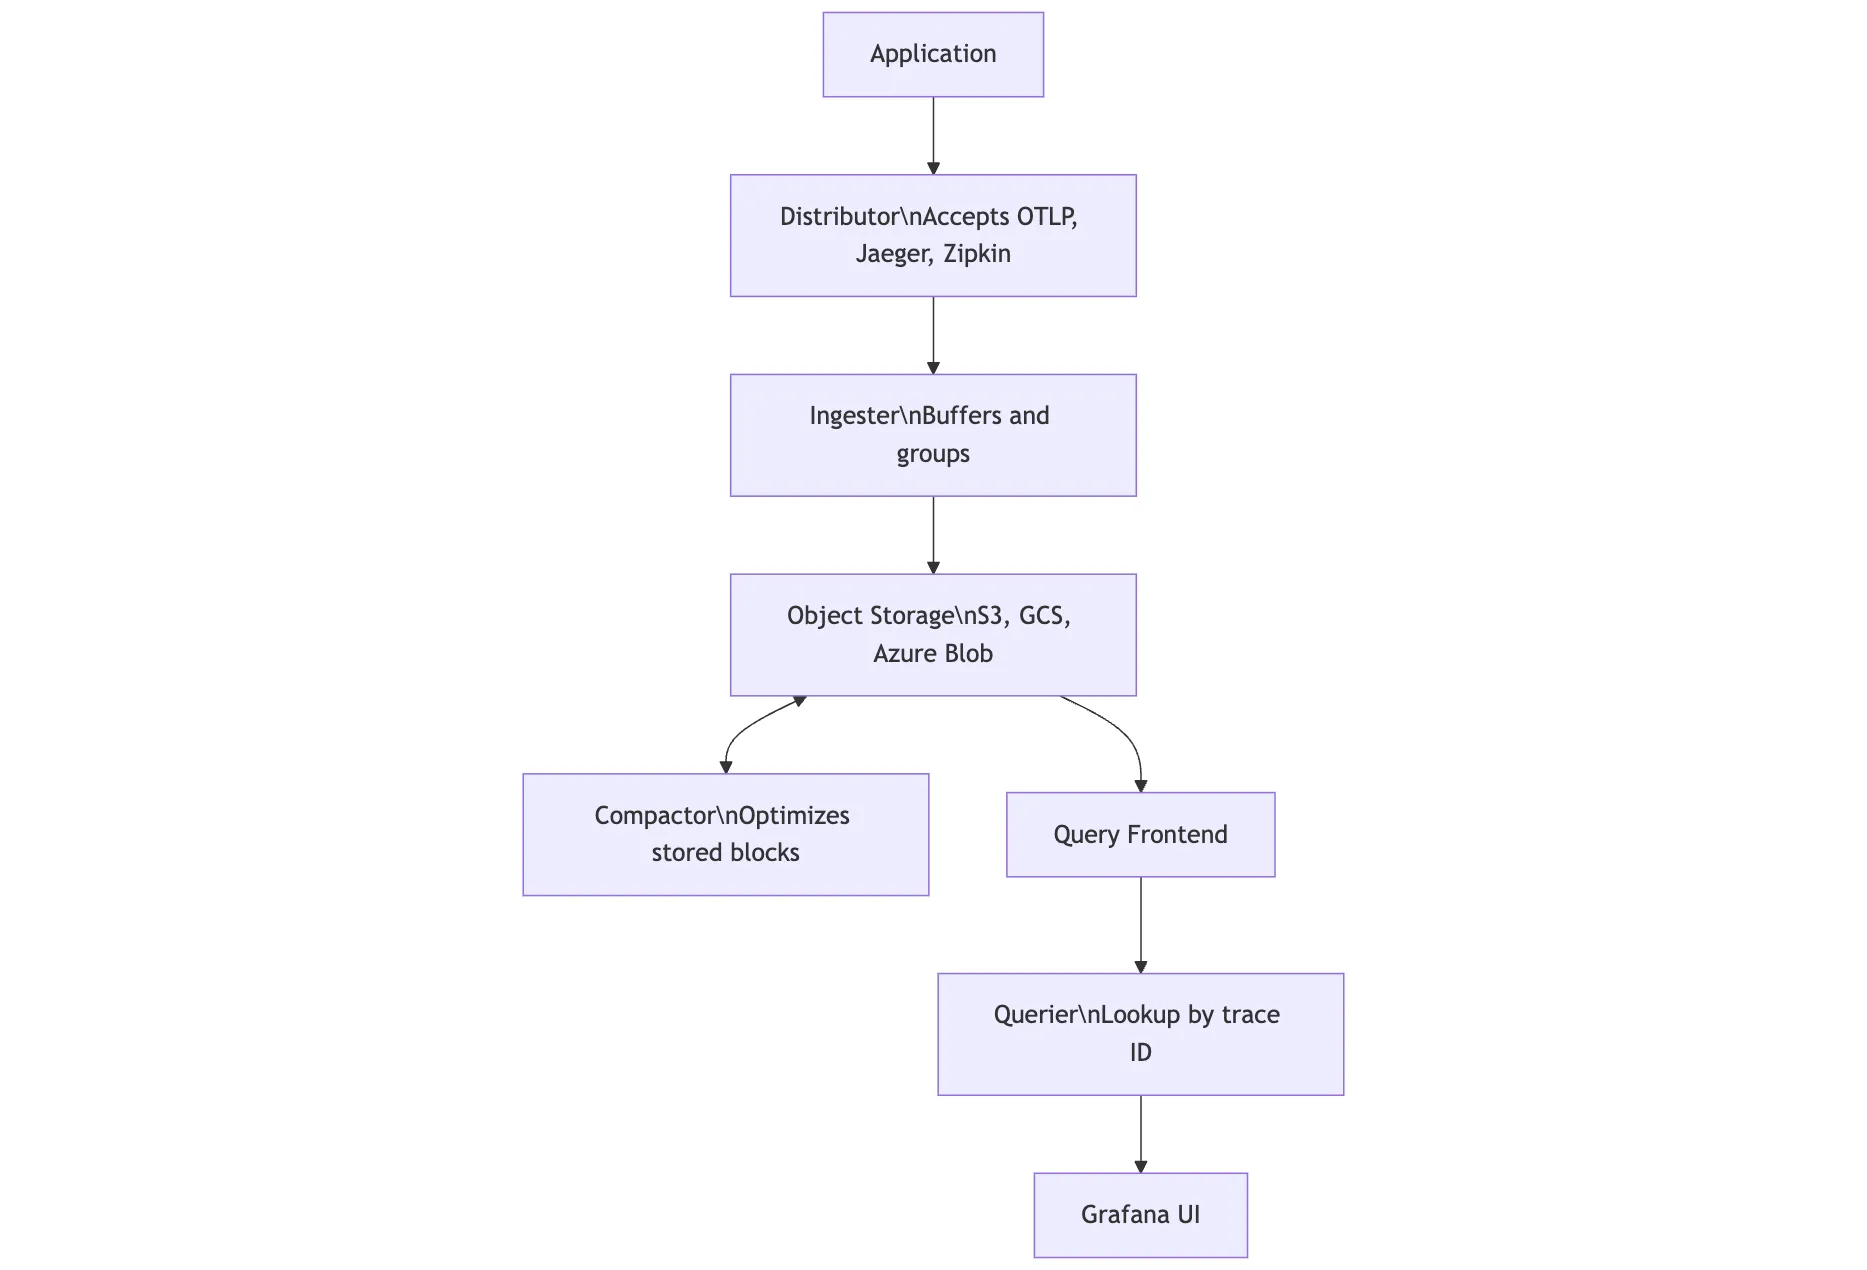
Unlike Jaeger, Tempo skips building indexes altogether. It relies solely on trace ID lookups, which significantly reduces infrastructure complexity, especially at scale.
To understand how to calculate the rate of change in your metrics effectively, check out our guide on the Grafana rate function.
Jaeger vs. Tempo: A Feature-by-Feature Look
Here’s how they stack up across some core areas of a distributed tracing system.
Instrumentation: Where Tracing Starts
Instrumentation is how applications generate trace data. Jaeger and Tempo both support popular tracing standards—but with some differences in approach.
Jaeger started with the OpenTracing API (which has since merged into OpenTelemetry) and offers official client libraries for:
- Java
- Go
- Node.js
- Python
- C++
- C#
These libraries are maintained by the Jaeger project and work well for teams already invested in OpenTracing or migrating to OpenTelemetry.
Tempo, on the other hand, is format-flexible. It supports:
- OpenTelemetry
- Jaeger (via OpenTracing)
- Zipkin
This gives teams the freedom to instrument services using the standard they prefer, without having to rewrite existing tracing logic. It’s especially helpful for orgs in transition—adopting OpenTelemetry gradually while still supporting older formats.
How Traces Flow Through the System
The data pipeline is where trace data gets buffered, processed, and prepared for storage. This stage is critical for managing volume, shaping trace data, and keeping your system efficient.
Jaeger uses a set of collectors that receive spans, validate and enrich them, apply sampling strategies, and send them to the storage backend. These collectors also handle indexing, making it easier to search for traces later, but also requiring more infrastructure to run.
Tempo takes a lighter, more decentralized approach. It uses Grafana Agents—lightweight processes deployed close to your applications—to collect, batch, and forward traces. These agents push data to Tempo’s backend without needing indexing or complex preprocessing.
Because Tempo writes directly to object storage, its pipeline is optimized for simplicity and scale. But that also means it trades off traditional search features in favor of faster, ID-based lookups.
If you’re comparing monitoring tools to find the best fit for your needs, this detailed comparison of Zabbix and Grafana can help you understand their strengths and differences.
How Jaeger and Tempo Handle Trace Storage
Storage is one of the biggest differences between Jaeger and Tempo—not just in what they use, but in how they think about storing traces.
Jaeger’s approach to storage
Jaeger supports a few different backends depending on your needs:
- In-memory, mostly for local testing or demos
- Cassandra, which scales well and supports high availability
- Elasticsearch, which adds full-text search and indexing
These systems give you powerful query options, especially if you need to search traces by tag or service. But they come with trade-offs. Managing Elasticsearch or Cassandra at scale means more infrastructure, more tuning, and higher operational costs.
Tempo’s storage model
Tempo skips the database entirely. Instead of indexing trace data, it writes everything to object storage—like S3, GCS, or Azure Blob.
This design is built around simplicity. Trace data is grouped into blocks and stored efficiently without indexing. You can also run Tempo in a local setup using the filesystem, and optionally add Redis or Memcached to speed up queries.
The catch? You need the trace ID to look something up. You can’t search by attributes or tags unless you’ve already captured and stored that context somewhere else—usually in logs or metrics.
But the benefit is big: Tempo’s storage model is lightweight and cost-efficient. It often uses 10 to 100 times less storage than Jaeger for the same trace volume.
How Easy Is It to Find Traces?
One of the most noticeable differences between Jaeger and Tempo is how you search for traces. Jaeger gives you a lot of flexibility out of the box. Tempo is simpler—but evolving.
Querying in Jaeger
Jaeger’s strength lies in its powerful search features. You can find traces without needing to know the trace ID, which makes it great for exploratory debugging. Some of the things you can search by include:
- Service name
- Operation (like
http.request) - Tags and custom attributes (like
error=true) - Duration and time windows
For example, you could search for all slow requests from your frontend service using a filter like:
service=frontend operation=http.request error=true duration>500msThis kind of filtering makes Jaeger especially useful when you don’t know exactly what you’re looking for yet.
Querying in Tempo
Tempo was originally built around a simpler model: you needed the trace ID to retrieve a trace. This meant you’d often have to start from a log line or a metric and jump into Tempo from there.
That’s changing. Newer versions of Tempo introduced TraceQL, a query language that lets you filter traces by common attributes—bringing it closer to Jaeger’s flexibility. For example:
{ status.code=500 && service.name="api" && http.method="POST" }Even with TraceQL, Tempo’s search options are still more limited compared to Jaeger. That’s by design—since Tempo doesn’t index trace data, it trades search flexibility for simpler infrastructure and better storage efficiency.
When working with metrics in your observability setup, knowing how to write effective queries is key—this guide to Prometheus Query Language breaks down the essentials in a practical way.
Jaeger UI vs Tempo in Grafana
Tracing is only useful if you can explore the data. Both Jaeger and Tempo offer strong visualization options—but they take different approaches.
What the Jaeger UI Offers
Jaeger comes with its built-in UI designed specifically for working with traces. It gives you:
- A timeline view of spans so you can see how a request unfolds
- Detailed span-level data, including tags, logs, and errors
- Service dependency graphs that show how your systems are connected
- The ability to compare multiple traces side by side
- Tag-based filtering to zero in on specific request patterns
It’s purpose-built for tracing and does that job well, but it’s largely limited to trace data only.
How Tempo Works with Grafana
Tempo doesn’t have a custom UI of its own. Instead, it integrates directly with Grafana, using it as the visualization layer. This has a few big advantages, especially if you’re already using Grafana for metrics or logs.
With Grafana + Tempo, you can:
- View traces alongside metrics and logs on the same dashboard
- Correlate trace timelines with Prometheus metrics
- Use exemplars to jump from a spike in a graph straight into the trace that caused it
- Build unified observability panels without switching tools
The key difference is that Tempo is part of a larger observability story. Instead of a tracing-only UI, it fits into a shared context across logs, metrics, and traces—all in Grafana.
How Jaeger and Tempo Scale
Jaeger and Tempo are both built to support high-throughput environments, but their scaling and priorities aren’t quite the same.
Jaeger
Jaeger can handle large trace volumes, especially when backed by scalable storage like Cassandra or Elasticsearch. But with that flexibility comes more operational complexity. You’ll likely need to manage indexing overhead, tune performance, and apply sampling to keep costs in check.
Here’s an example of Jaeger’s sampling configuration:
type: probabilisticparam: 0.1 # Sample 10% of tracesThis helps reduce load and storage usage, but it also means you’re not storing every trace.
Tempo
Tempo was designed to store all traces, not just a sample. By skipping indexes and writing directly to object storage, it keeps resource usage low—even at massive scale. Tempo’s architecture is simple and cheaper to operate, especially in cloud-native setups.
A typical config looks like:
backend: s3s3: bucket: tempo endpoint: s3.amazonaws.com region: us-west-2You get efficient, near-infinite storage—but with less flexible querying. Tempo focuses on cost-effective trace retention, assuming you’ll use trace IDs (or logs and exemplars) to find what you need.
If you’re deciding between OpenTelemetry and Jaeger, this guide breaks down their key differences to help you choose the right tool for your needs.
Which One Fits Better With Your Existing Stack
Tracing rarely exists in isolation. How well a tool connects with the rest of your monitoring stack—metrics, logs, alerts—can make or break its usefulness.
Jaeger
Jaeger supports a broad range of integrations, especially if you’re already working with OpenTelemetry. It plays nicely with:
- OpenTelemetry SDKs and pipelines
- Prometheus (via AlertManager for incident response)
- Zipkin (thanks to protocol compatibility)
- Most logging systems, with trace ID injection for log correlation
If you’re running a mixed observability stack or transitioning from Zipkin or older tools, Jaeger’s flexibility is a plus.
Tempo
Tempo is designed to slot directly into the Grafana ecosystem—and that’s where it shines.
It integrates tightly with:
- Prometheus, using exemplars to link metric spikes to exact traces
- Loki, by passing trace IDs into logs and enabling back-and-forth navigation
- Grafana dashboards, letting you pivot between metrics, logs, and traces in one place
If you’re already using Grafana for monitoring, Tempo makes it easier to stitch observability data together without jumping between tools. It’s built for that “logs, metrics, and traces in one view” experience.
Explore the strengths and features of popular application logging tools in this comprehensive overview of top logging tools to help you find the best fit for your setup.
When to Use Jaeger vs Tempo
Both Jaeger and Tempo are solid tracing solutions, but they shine in different scenarios.
Jaeger is a better fit when you need a standalone tracing system with rich query capabilities. If filtering by tags, searching without trace IDs, and comparing traces in detail are important to your workflow, Jaeger gives you that out of the box.
It’s mature, well-supported, and works well if you’re okay managing the added complexity of database-backed storage.
Tempo makes more sense if you’re already using Grafana for metrics and logs. It’s built to store 100% of your traces cost-effectively, without having to configure sampling or worry about storage overhead.
If you can rely on logs or metrics to surface trace IDs—and prefer a simpler operational model—Tempo keeps things lean without sacrificing core observability workflows.
Getting Started with Jaeger vs Tempo
Getting started with either Jaeger or Tempo isn’t particularly hard—but they each have their own setup requirements and operational trade-offs.
Getting Jaeger Up and Running
Jaeger offers a few deployment options depending on what stage you’re in:
- For quick testing, there’s a simple all-in-one binary.
- For development, Docker Compose works well.
- For production, most teams deploy it on Kubernetes using the Jaeger Operator.
A production-grade setup usually means running one or more Jaeger components alongside a storage backend like Elasticsearch or Cassandra. You’ll also need to instrument your services using one of Jaeger’s supported client libraries.
While it’s a flexible system, standing up and maintaining a full Jaeger stack—especially the storage layer—can get complex at scale.
Setting Up Tempo
Tempo is typically deployed using Helm in Kubernetes. Before you start, you’ll need to configure object storage—like S3, GCS, or Azure Blob—since that’s where Tempo stores traces.
Once storage is set, you deploy Tempo components, configure your services to send trace data, and hook it all into Grafana for visualization. The setup is straightforward and lighter on infrastructure, especially if you’re already running other Grafana components like Loki or Prometheus.
Comparing Storage and Infrastructure Costs
Both Jaeger and Tempo are open-source and free to use. But the way they use storage impacts costs over time.
Jaeger often requires indexed storage, which can get expensive at high volumes. Elasticsearch or Cassandra clusters add to the infrastructure footprint, and most teams eventually implement sampling to keep data manageable.
Tempo avoids those costs by skipping indexing altogether. Since it writes to object storage, you can retain full-fidelity traces without overwhelming your budget. That said, if you’re using Grafana Cloud, you’ll want to factor in those costs too.
A Managed Option with Built-in Observability
If you’re weighing options like Jaeger and Tempo, our platform, Last9 offers a different approach.
We bring metrics, logs, and traces together in one place, without the operational overhead. Like Tempo, we support OpenTelemetry and focus on cost-effective storage. Like Jaeger, we offer deep visibility—but without the complexity of managing indexing systems.
What sets us apart is our ability to handle high-cardinality data at scale—something that’s typically expensive or difficult to get right. Our platform powers some of the largest real-time systems in the world, while keeping trace correlation simple and storage costs predictable.
If you want full observability without managing multiple tools or scaling databases, we’re built for that. Talk to us or get started for free today!

