Day 4 of Launch Week
Your production systems are generating more telemetry data than ever. Your team is drowning in dashboards. And now you're supposed to add AI agents to the mix?
Here's what we've learned after building observability tooling for hundreds of engineering teams: the same high-cardinality data that makes human debugging effective is exactly what AI agents need to provide useful context. The problem is most observability platforms weren't built with agents in mind.
The High-Cardinality Problem (And Why It Matters for Agents)
When your application scales, metrics explode with labels like user_id, tenant_id, feature_flag, and deployment_version. Traditional platforms either sample this data away or charge you extra for "custom metrics."
But here's the thing: agents need that granular context to be useful. When debugging a production issue, knowing that errors spike for tenant_id=enterprise-customer-123 during feature_flag=new-checkout deployments is the difference between a 5-minute fix and a 2-hour investigation.
We handle 60M+ series per minute without breaking a sweat. No sampling by default. No extra charges for high cardinality. Because if your agent can't see the full picture, it's just expensive grep.
Two Interfaces, Same Data
Here's how it works in practice:
Human workflow: You spot elevated error rates in the Last9 UI, drill down to specific services, examine traces, and identify the problematic code path.
Agent workflow: Your IDE agent calls the Last9 MCP server, analyzes the same telemetry data, correlates it with your local codebase, and suggests specific fixes.
Same data. Different interface. No context switching.
Conversational Monitoring Across Your Stack
Whether you're debugging in VS Code, reviewing PRs in Cursor, or coordinating incident response in Slack, Last9's agents understand your production context:
# In your IDE
> fix the last exception

# Agent analyzes production telemetry
# Identifies NoMethodError in CheckoutController
# Locates the exact code path causing issues
# Suggests authentication module fix
# In Slack during an incident
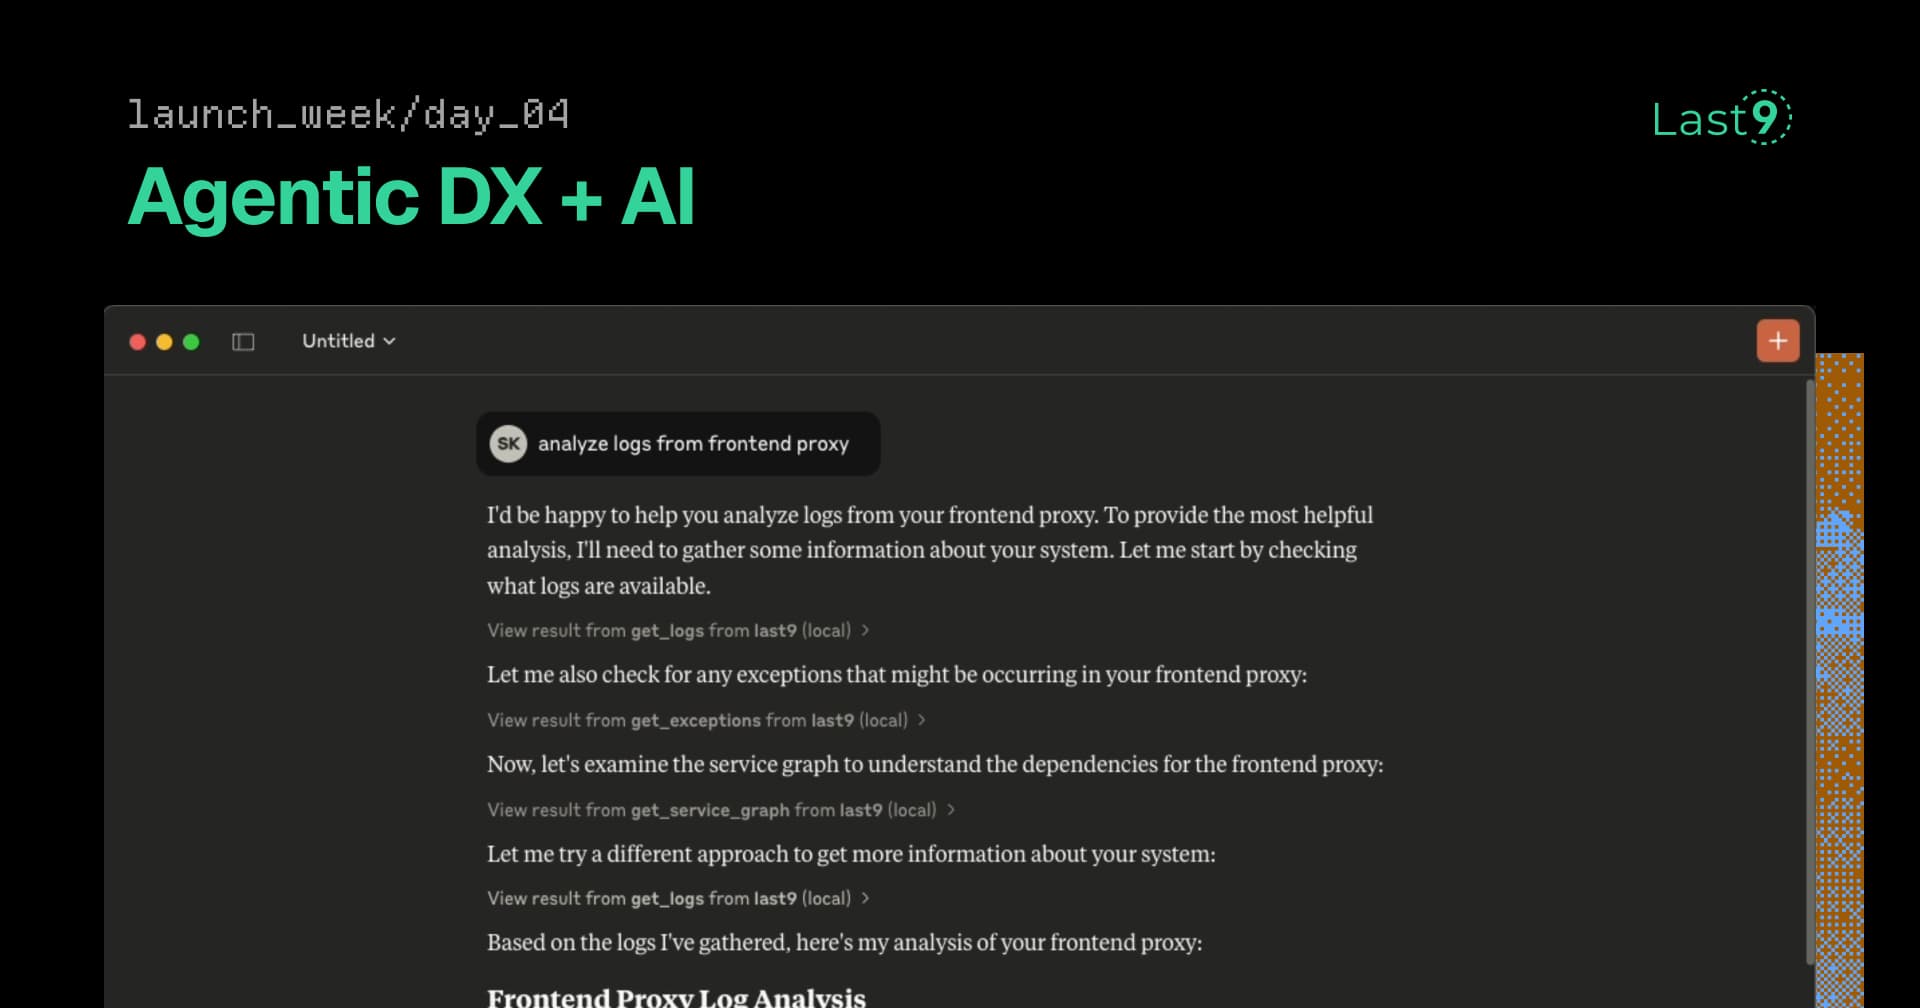
> analyze frontend proxy logs
# Agent identifies repetitive GET requests
# Recommends drop rules to optimize logging volume
# Applies changes directly to your Last9 configurationThe agent doesn't just tell you something's wrong-it shows you exactly where to look and what to fix.
The AI Native Shift
Cloud native changed how we build applications. AI native is changing how we operate them.
Instead of learning 17 different dashboards, your team asks questions in natural language. Instead of manual root cause analysis, agents correlate telemetry across your entire stack. Instead of reactive debugging, you get proactive optimization suggestions.
But this only works if your observability platform was designed for it from day one.
Built for Reactive Debugging and Proactive Optimization
The Last9 MCP server enables two critical workflows:
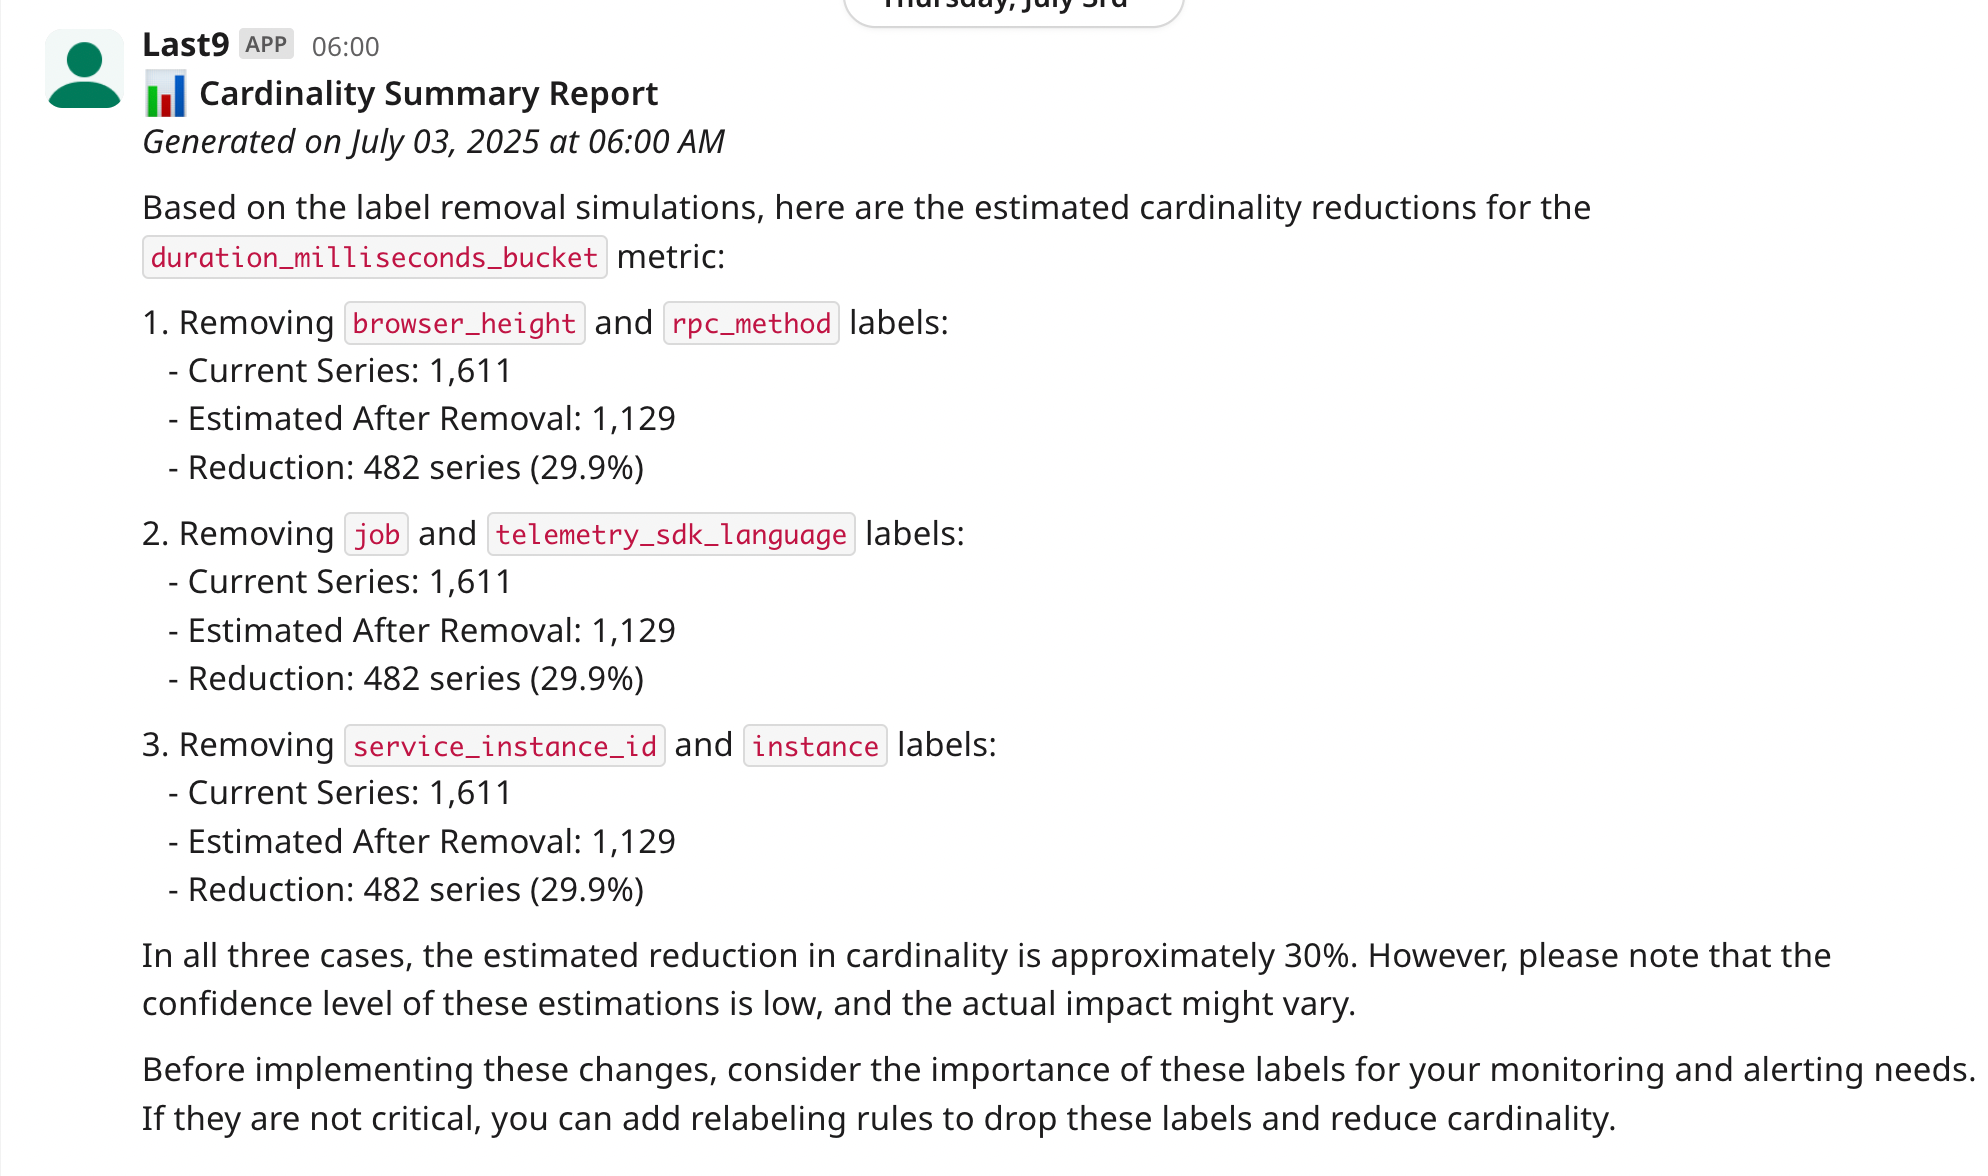
Proactive optimization: Agents continuously analyze your telemetry patterns, identifying performance bottlenecks, cost optimization opportunities, and configuration improvements.
Ask AI to analyze and optimize logs
Reactive debugging: When production breaks, agents have immediate access to high-fidelity telemetry data to identify root causes and suggest fixes.
Ask AI to fetch the latest production issues and suggest fixes
Both workflows require the same thing: complete, unsampled, high-cardinality data that traditional platforms either can't handle or charge extra for.
Getting Started
The shift from cloud native to AI native doesn't happen overnight. But it starts with having the right data foundation.
- Enable OpenTelemetry traces for your services
- Send telemetry to Last9 (zero configuration required)
- Install the MCP server in your IDE or team chat
- Start asking questions about your production systems
Your agents will have the context they need. Your team will debug faster. Your production systems will run smoother.
And you won't pay extra for the privilege.
Want to experience agentic observability? Sign up for Last9 and connect your first agent in under 5 minutes.