As our multi-tenant SaaS platform grew to serve thousands of customers, we faced a critical challenge: understanding CDN usage patterns per customer account.
While Akamai provides excellent CDN services, getting granular, account-level metrics for bytes transferred isn't straightforward.
Here's how we solved this using log parsing and Last9.
The Challenge: Why Metrics Weren't Enough
This seemingly simple question from our billing team sent us down a rabbit hole. While Akamai's built-in metrics are great for overall CDN monitoring, they don't provide the account-level granularity we needed.
Our application serves content through URLs like:
<https://cdn.example.com/accounts/{account-id}/assets/image.jpg>Each request contains vital information about which account is consuming bandwidth, but this information isn't automatically parsed into metrics. Instead, it lives buried in our CDN logs.
Requirements: What We Needed to Solve
- Extract account IDs from request URLs in real-time
- Calculate bytes transferred per account
- Create time-series data for trending and analysis
- Set up alerting for unusual patterns
- Correlate this data with other parts of our stack
The Solution: From Logs to Actionable Metrics
Step 1: Log Ingestion and Parsing
First, we needed to extract account information at ingestion time rather than query time.
This approach has several advantages:

- Reduced query processing overhead
- Faster dashboard rendering
- More efficient storage use
Using Last9's log processing pipeline, we set up custom parsing rules to extract account IDs from our URLs.
Here's what this looks like in practice:
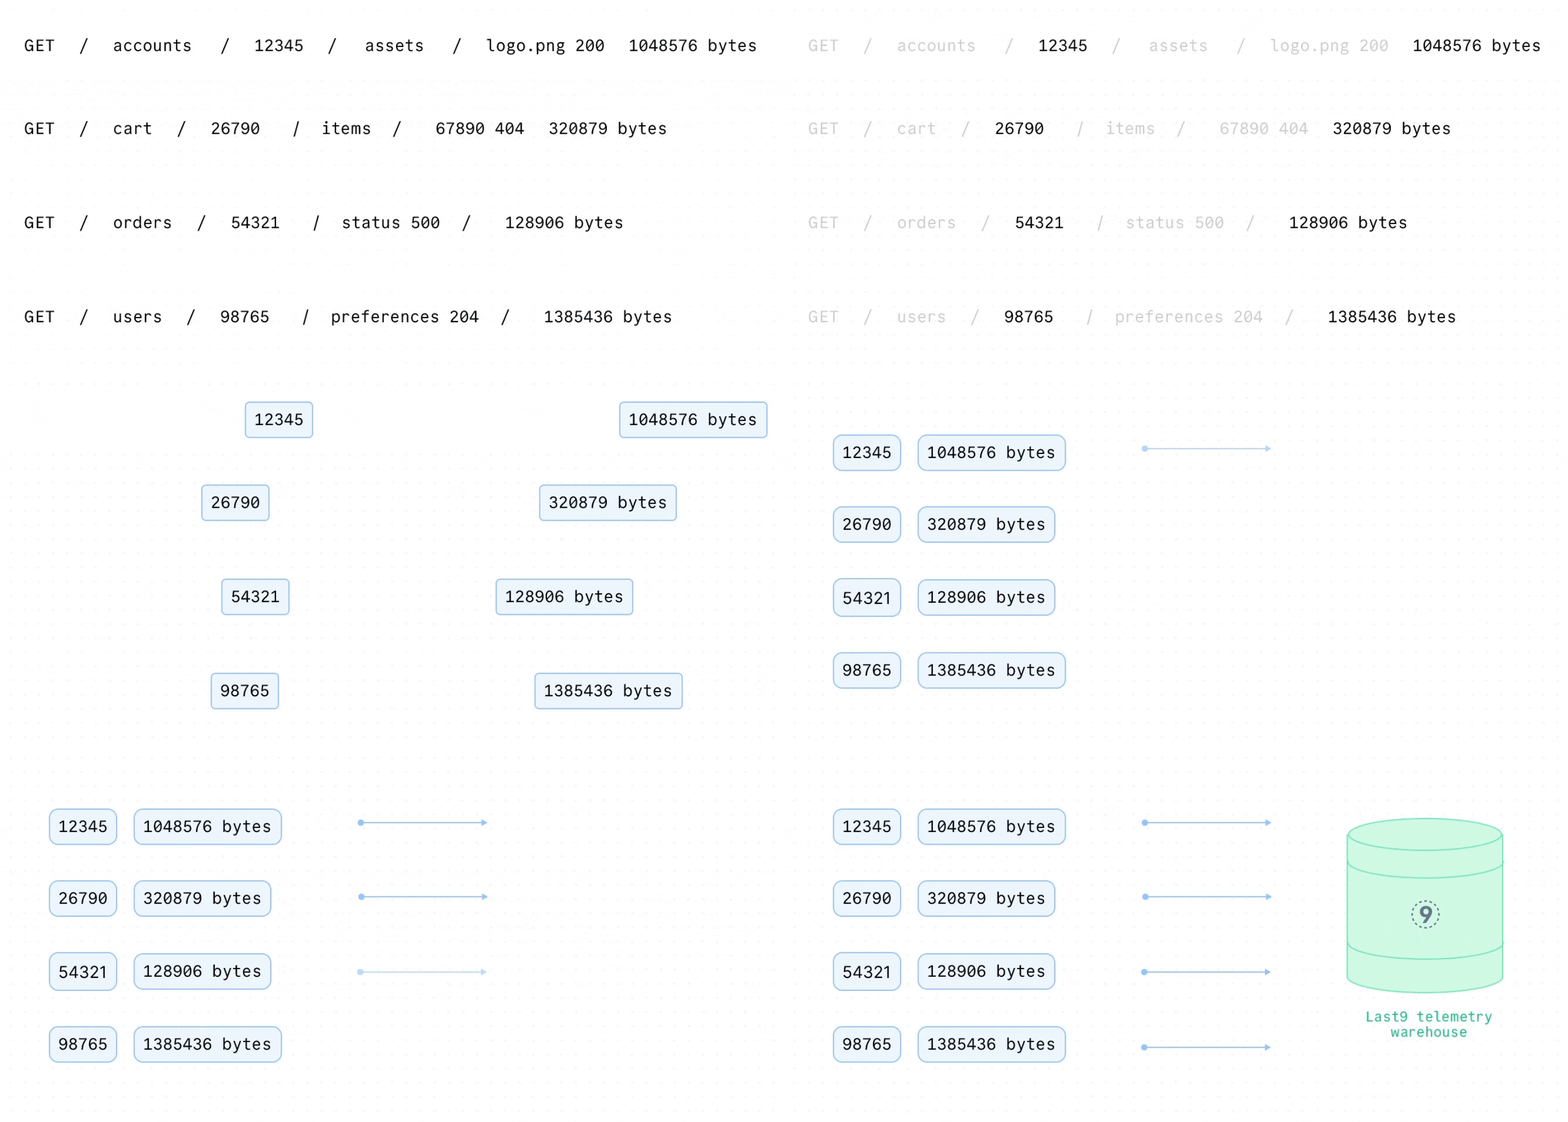
When a log line arrives containing:
GET /accounts/12345/assets/logo.png 200 1048576 bytesWe extract and attach labels:
bytes_transferred{account_id="12345"} 1048576Step 2: Aggregation and Storage

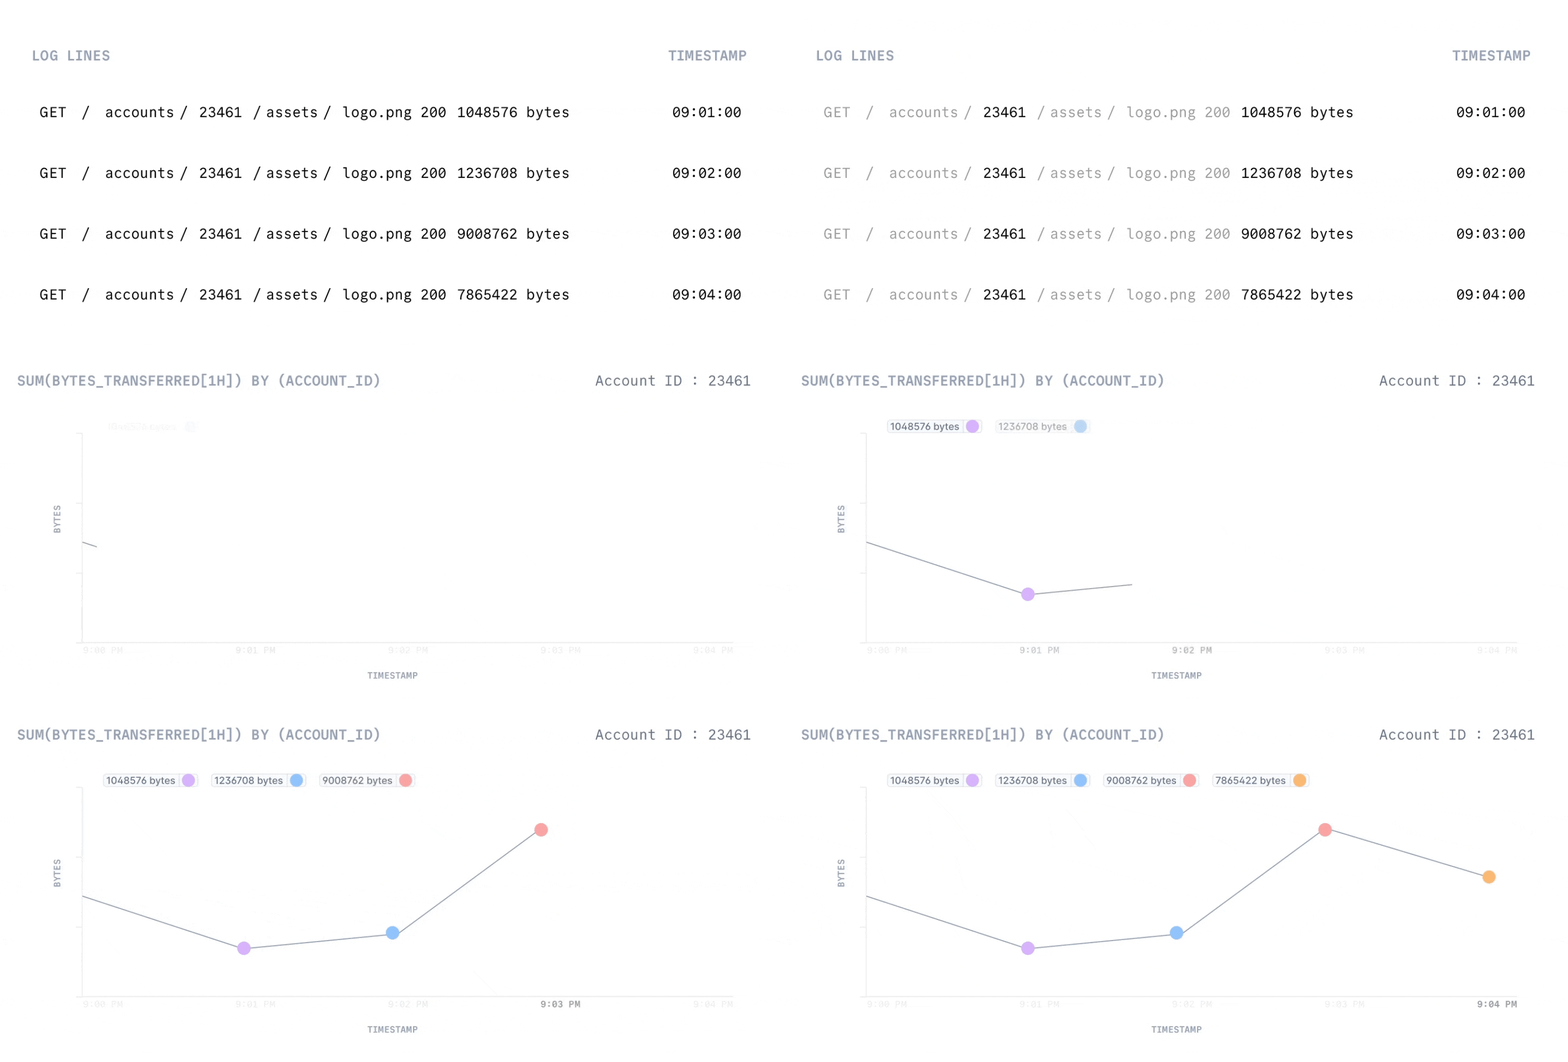
Once we had the labeled data, we needed to aggregate it effectively. Last9's metric aggregation allows us to:
- Sum bytes transferred per account in 1-minute intervals
- Maintain historical data for trend analysis
- Create roll-ups for different time windows (hourly, daily, monthly)
This gives us queries like:
sum(bytes_transferred[1h]) by (account_id)Step 3: Setting Up Alerts

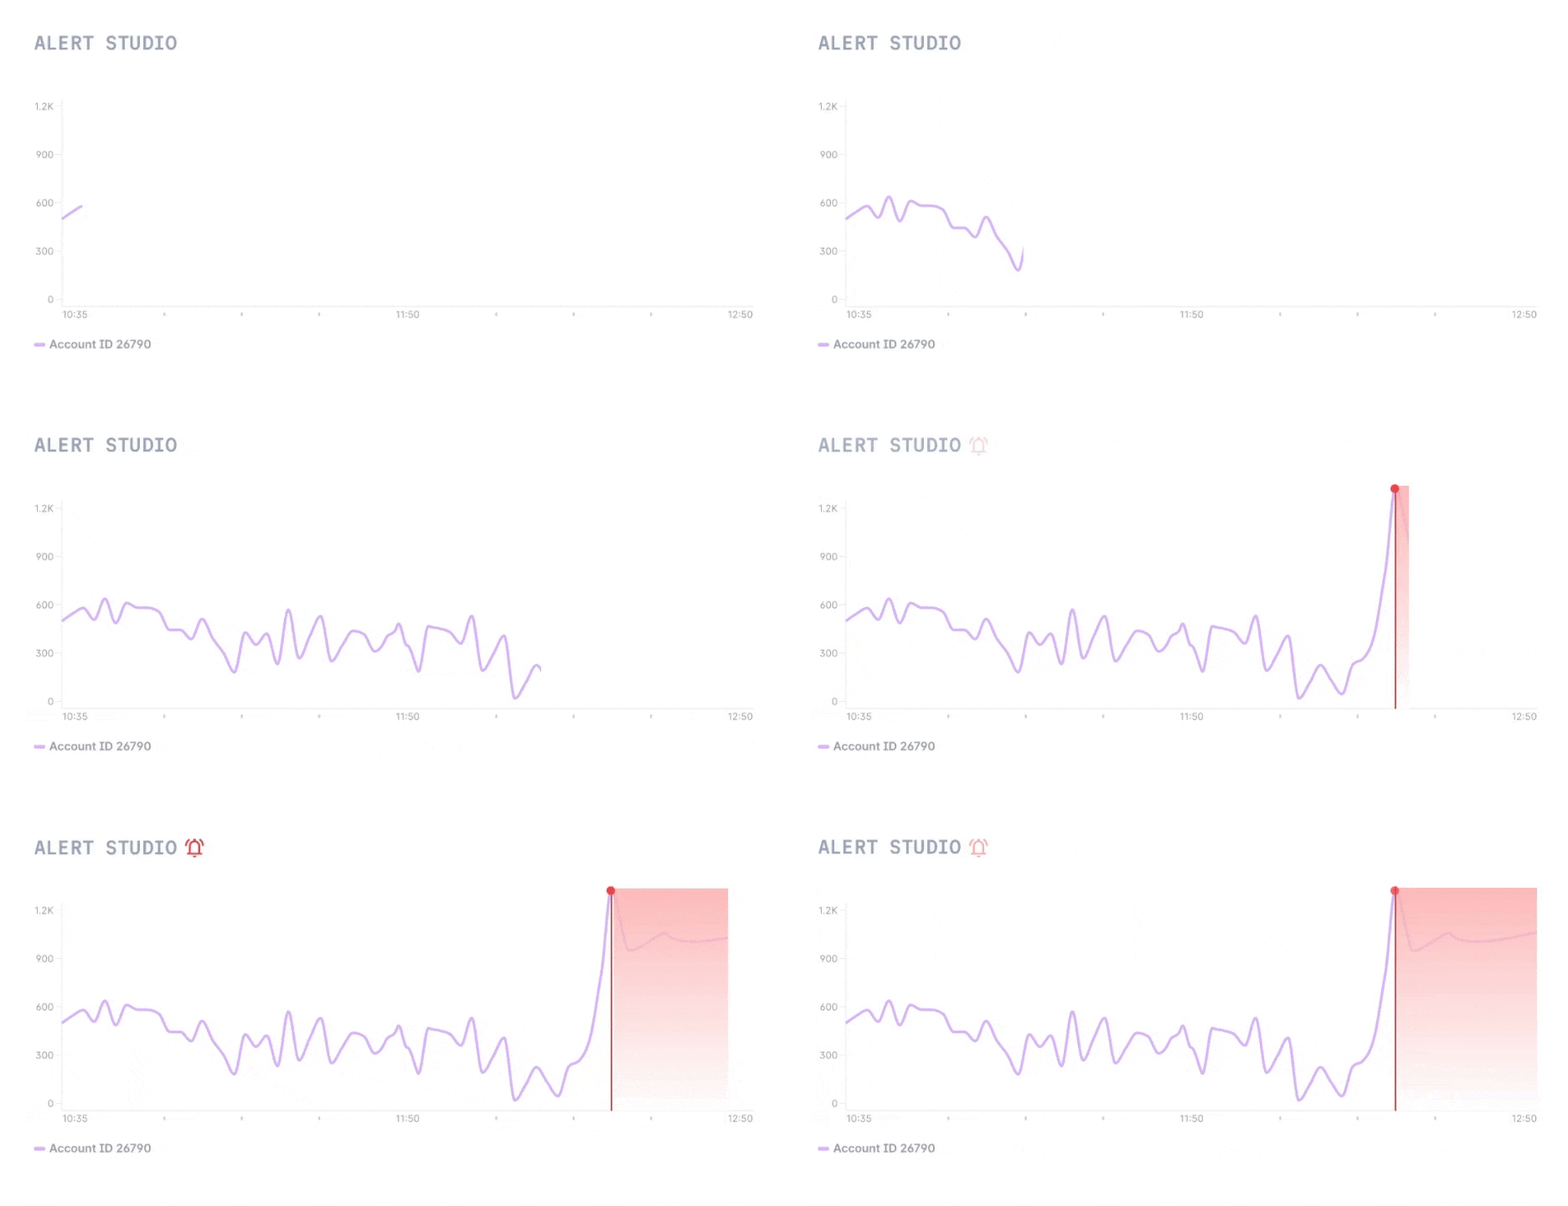
With our data properly labeled and aggregated, we set up several types of alerts:
- Usage Spikes: Alert when an account's bandwidth usage increases by 3x their normal pattern
- Quota Monitoring: Notify when accounts approach their bandwidth limits
- Anomaly Detection: Flag unusual patterns that might indicate security issues
Step 4: Cross-Stack Correlation

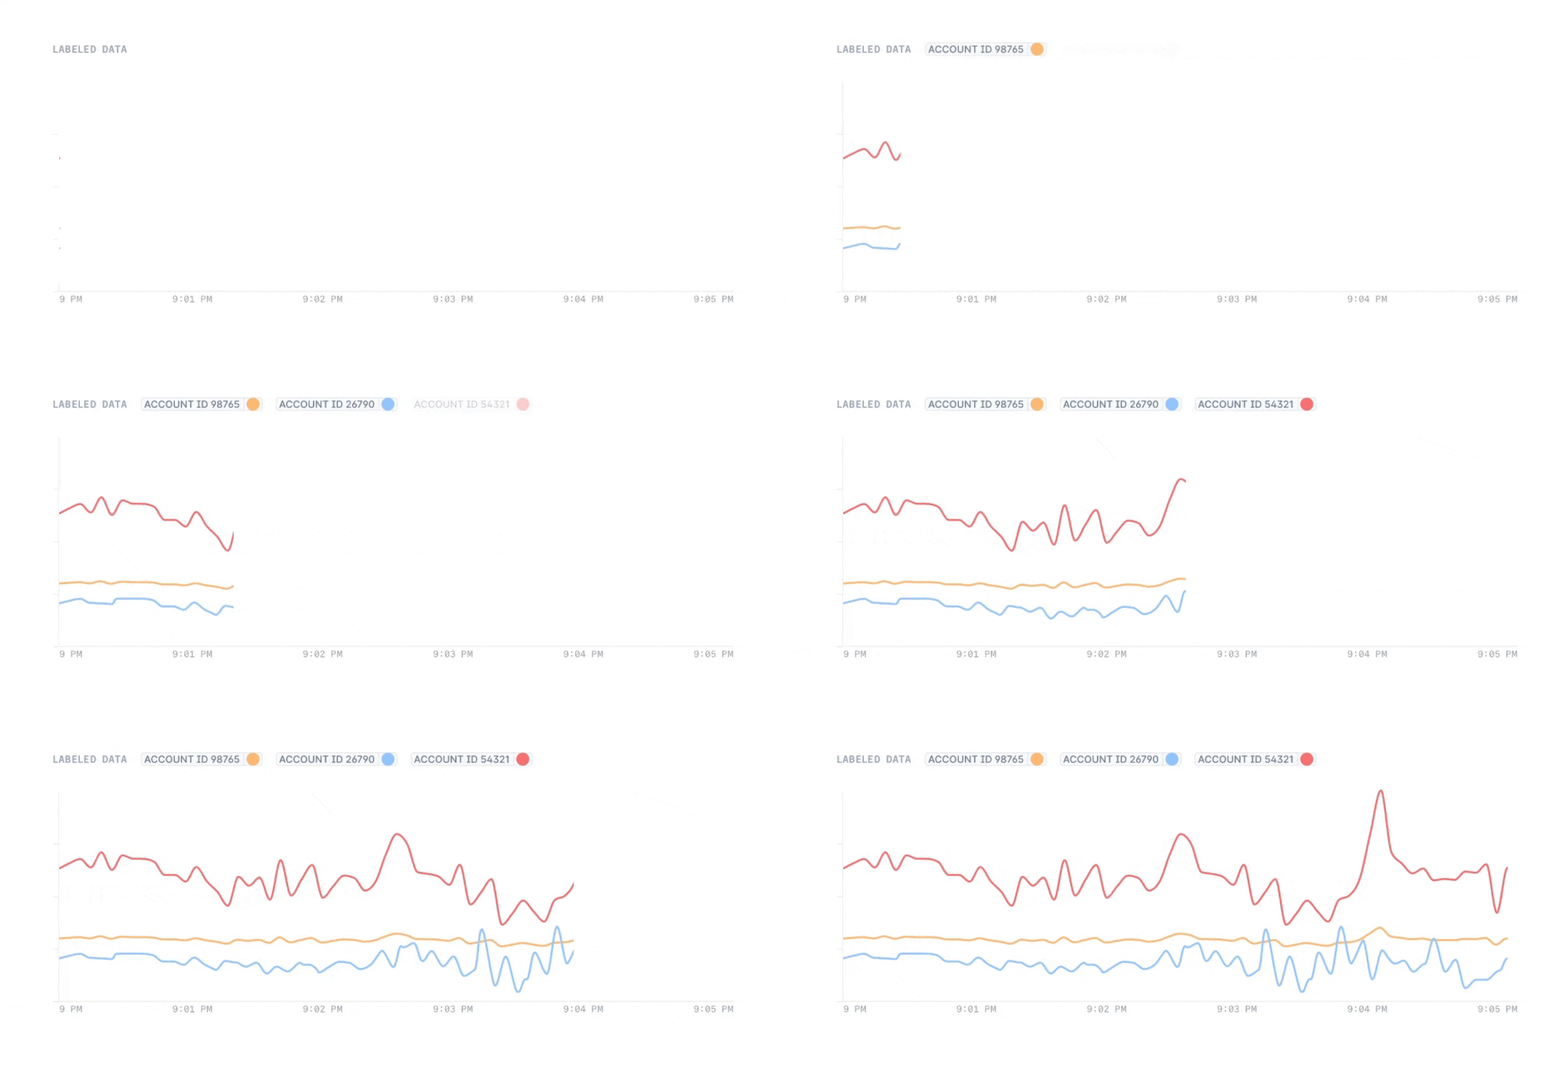
The real power came when we started correlating this data across our stack. By using consistent account ID labels, we could now:
- Compare CDN usage with API calls
- Track end-to-end request flows
- Identify performance bottlenecks per customer
For example, we could now answer questions like: "Is high CDN usage for account X correlating with increased API latency?"
Implementation Tips and Tricks
After implementing this solution across several environments, here are key lessons learned:
- Label Cardinality: Be careful with high-cardinality labels. While account IDs are important, we also maintain a separate lookup for account name/details to keep cardinality manageable.
- Aggregation Timing: Process and aggregate logs as close to ingestion as possible. This reduces storage costs and query latency.
- Historical Data: Keep raw logs for a shorter period (7-14 days) but maintain aggregated metrics for longer (months/years) for trending.
- Alert Tuning: Start with conservative thresholds and adjust based on actual patterns. We began with:
- 3x usage increase over 24-hour average
- 80% of quota warnings
- Minimum baseline thresholds to avoid noise
Looking Forward: Future Improvements
We're currently working on several enhancements:
- Machine Learning: Using historical patterns to predict future usage and detect anomalies more accurately.
- Cost Attribution: Directly linking CDN costs to customer accounts for better business metrics.
- Real-time Dashboard: Building customer-facing dashboards showing CDN usage and trends.
Conclusion
While getting account-level CDN metrics from Akamai required some creative log parsing, the end result has been invaluable for our operations.
Using Last9's capabilities for log processing, metric aggregation, and alerting, we've built a robust system that gives us the granular visibility we need.
The ability to track and alert on per-account CDN usage has helped us:
- Optimize costs through a better understanding of usage patterns
- Improve customer experience by catching issues early
- Make data-driven decisions about infrastructure scaling
Remember, logs contain valuable information that often isn't captured in standard metrics. You can transform this data into actionable insights with the right tools and approach.


