
Quality software is created from a combination of technical prowess and good team culture. But, how do you know whether you're excelling compared to your competitors? DORA metrics provide a framework for measuring DevOps performance. They let you calculate whether you're a high performer and provide data to drive improvements.
The metrics were developed by Google's DevOps Research and Assessment (DORA) working group after six years of research. The group analyzed different DevOps implementations to establish the most efficient ways of building and delivering software. They identified four key metrics that offer a standardized view of DevOps success.
This article will teach you the four DORA metrics, how to make measurements, and the benefits and challenges of using them. You'll also learn some best practices for working with the metrics that will let you effectively compare your organization to others.
The Four DORA Metrics
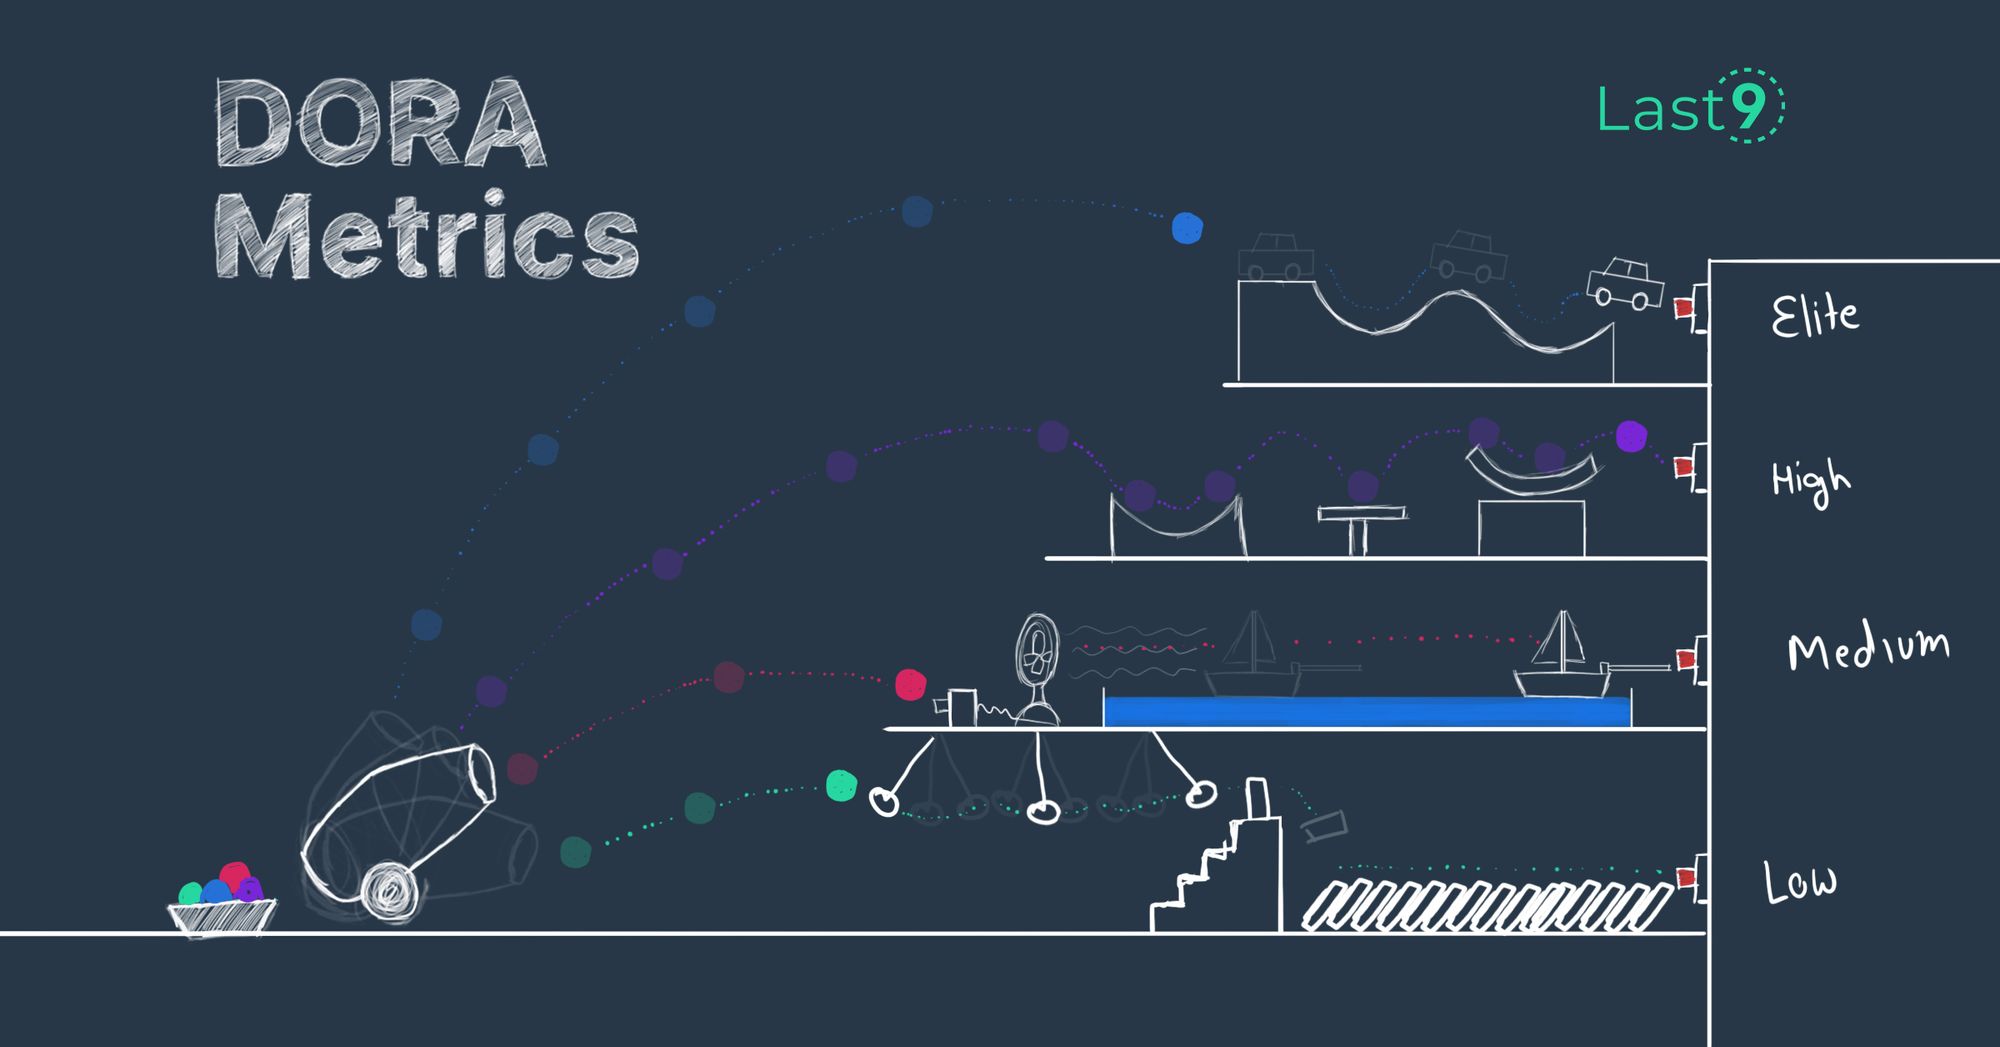
The DORA metrics focus on measurement and analysis of DevOps throughput and reliability. Together, they let you understand the reliability of your deployments and how quickly you're shipping code. The best-performing organizations will deploy frequently while maintaining a low failure rate.
1. Deployment Frequency
Deployment frequency reveals how often you deliver new code into production. It's a simple measure of the number of deployments that have reached users within a particular time period.
The more successful DevOps implementations allow changes to be deployed very frequently. The objective of DevOps is to increase engineering throughput without compromising quality. Regularly releasing code to customers signals that this aim is being achieved.
A high deployment frequency is beneficial because you can respond to problems much more effectively when there's nothing in the way of a deployment. When a user reports a bug, you need to be able to send new code to production as quickly as possible.
The ideal deployment frequency is usually dependent on the type of product you're building. Web applications and APIs can often be deployed continuously, but native mobile apps producing large binary outputs may need a different approach. Users won't want to be downloading multiple app updates a day.
Organizations building a software-as-a-service (SaaS) solution could be categorized as follows:
| Metric | Elite performers | High performers | Medium performers | Low performers |
|---|---|---|---|---|
| Deployment frequency | Continuous (as soon as code is integrated) | Daily or multiple times a week, on demand | Weekly or several times a month, on demand | Less frequently, such as monthly or quarterly, on demand |
The categorization could be adjusted as follows for companies creating native apps:
| Metric | Elite performers | High performers | Medium performers | Low performers |
|---|---|---|---|---|
| Deployment frequency | Daily | Weekly | Monthly | Less frequently |
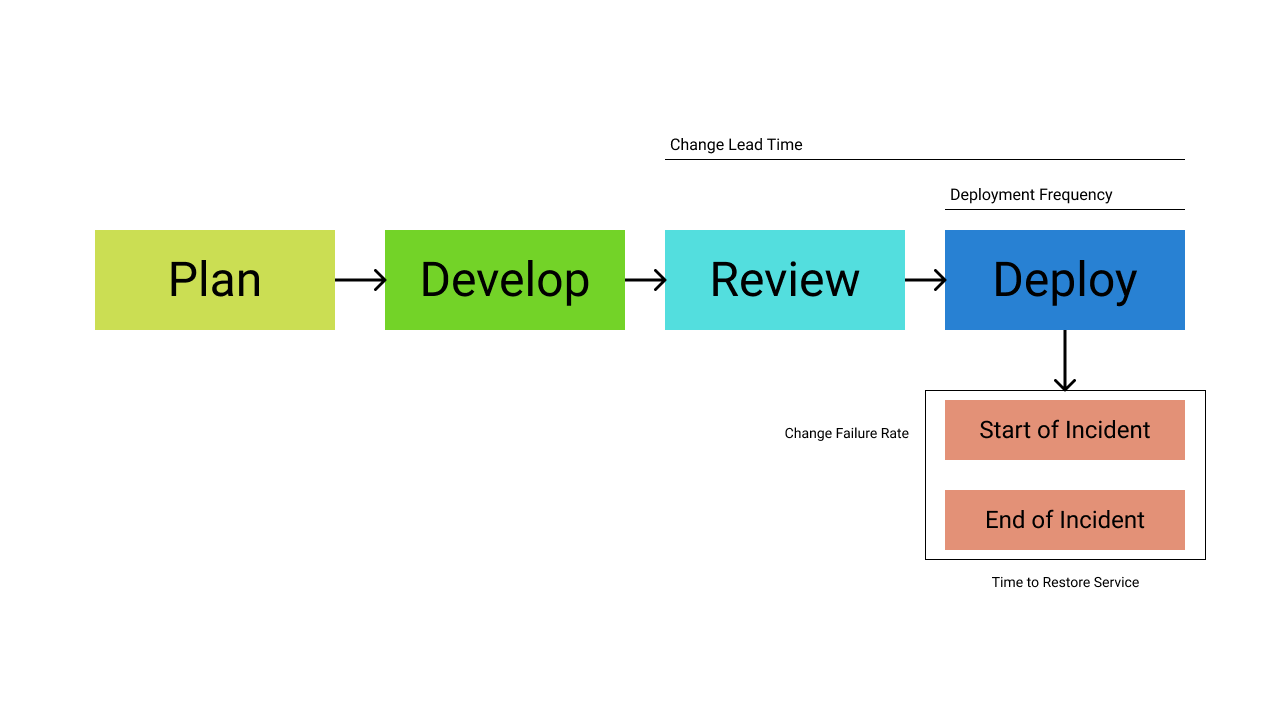
2. Lead Time for Changes
The lead time for changes measures the average amount of time required to deliver a revision to your users. This is usually taken as the time between code being committed and it being deployed into production.
The lead time for changes is easy to measure because the information is usually captured for you. The commit time will be recorded by your version control software. You can get the deployment time by using your CI platform to inspect the jobs run against the commit. Diffing the two times gives you that change's lead time.
High-performing organizations should aim for a low lead time. This indicates you've got a responsive process where changes can rapidly reach users. As lead time is measured from the commit, a high value usually means changes are getting delayed during code review or iteration. It can also be symptomatic of a poorly optimized delivery pipeline that's dependent on manual action. The DORA group suggests the following markers for high and low performers:
| Metric | Elite performers | High performers | Medium performers | Low performers |
|---|---|---|---|---|
| Lead time for changes | Under a day | A few days | A week or more | A month or more |
A change's lead time will always be impacted by the scope of the work involved. Bigger changes will naturally lead to longer lead times in most instances. For this reason, it's important to adhere to the broader DevOps principle of breaking work into compact tasks that are iterated upon to form bigger changes.
Keeping each work item to a similar size helps increase the metric's reliability. Lead time should be assessed as an average over a relatively extended time period, such as a month or quarter, to further iron out anomalies created by particularly large or small changes.
3. Change Failure Rate
Change failure rate is an important indication of software quality. It measures the percentage of production deployments that have caused an incident. A high change failure rate is undesirable as it means you're frequently shipping broken or unreliable features. This could eventually drive customers away from your solution. Constant failures also reduce the time you can spend building new capabilities, further increasing the risk you'll lose business to competitors.
Determining this value requires two values to be collected:
- The number of production deployments initiated in a time period
- The number of those deployments that caused a failure, such as a bug, an outage, or a performance regression
Failures need to be accurately attributed to the deployments that caused them. You can do this by labeling incidents in your issue management system with the ID or SHA of the deployment. You can then determine the change failure rate by retrieving the incident list and resolving the links to your deployments.
A top-performing DevOps implementation will have a very low change failure rate, typically less than 15 percent. This can be achieved using automated testing, comprehensive code reviews, and deployment rehearsals in staging environments to identify problems before code reaches users.
DORA's analysis of this metric found there was no significant difference between elite, high, and medium performers, while low performers had substantially poorer results:
| Metric | Elite performers | High performers | Medium performers | Low performers |
|---|---|---|---|---|
| Change failure rate | 0-15% | 0-15% | 0-15% | 46-60% |
4. Time to Restore Service
The fourth DORA metric considers how effectively your team responds to service outages. It's accepted that the change failure rate will never quite be 0 percent and that all services will eventually encounter a problem. Time to restore service measures the time that elapses between an incident beginning and normal operation resuming.
The data for this metric is usually derived from your incident management system. These platforms automatically capture the time at which an incident was reported and the time at which it was marked as resolved. The two values are sufficient for determining service restoration time, provided you don't resolve an incident until its fix has been verified in production.
Lower values are always desirable for time to restore service. Downtime is expensive, costing larger organizations up to $5,600 per minute. You can optimize recovery time by implementing automated incident management systems that identify problems and page the right teams. Having all the relevant information in one place lets you coordinate an effective response. The broader delivery process needs to be responsive as well, so that fixes can be rapidly developed, verified, and shipped to production.
DORA suggests the following baseline targets:
| Metric | Elite performers | High performers | Medium performers | Low performers |
|---|---|---|---|---|
| Time to restore service | Under an hour | Within a day | Within a day | Longer than a day, such as a week or month to restore the affected feature |
The Benefits of DORA Metrics
Measuring the DORA metrics is one of the most reliable ways to gain insights into your team's DevOps performance. The four pillars identified by DORA succinctly describe your ability to deliver reliable code under pressure and at high velocity.
You'll get the most utility from the metrics when you regularly reassess them. Trends in their values will highlight whether your DevOps processes are improving or falling away from the baseline. This gives you a chance to implement alterations before users start to feel the effects. The data lets you make informed decisions about how to resolve bottlenecks and overheads in your process.
DORA is also useful as a cross-team and cross-industry comparison tool. These standard metrics are applicable to all groups following DevOps principles. You can use them to benchmark your performance against your rivals, giving you a competitive edge.
One further DORA benefit is its ability to convert the abstract nature of DevOps processes into concrete measurements that present opportunities to improve. DORA is helping initiate a conceptual shift in how software is built, creating self-aware workflows defined by a virtuous cycle of efficiency improvements. Whereas the emphasis has previously been all about code and tools, high-performing DevOps teams also recognize the value of their process and look for opportunities to enhance it.
What about the Challenges?
Using DORA metrics is one of the best ways for DevOps teams to measure performance, but actually collecting and analyzing the data can be challenging. Here are some things to take into consideration:
- Raw data doesn't necessarily give the whole picture: Raw numbers can obscure the wider perspective, and it's important not to blindly follow the data. For example, a drop in deployment frequency is sometimes unavoidable. The team could be building a big new feature, waiting on other stakeholders, or even experiencing a capacity reduction due to staff illness and holidays. You'll need to put effort into collating different metrics, assessing their trends, and calculating their impact on your organization's specific KPIs. You should discuss observations with team members so you can understand the challenges they're experiencing.
- Standardization works best in theory: DORA metrics are designed to be applicable to all DevOps teams, but this doesn't always work in practice. It's difficult for teams working on different products and platforms to align around a single set of metrics. It's unfair to expect your native app developers to have the same deployment frequency as your API engineers, for example.
- The background context is important: DORA metrics are best analyzed collectively rather than as individual measurements. High performers should deliver quality software at high velocity, but each DORA metric only concerns one of these traits. Deployment frequency is a measure of velocity; change failure rate looks at quality. Only by combining measurements can you begin to infer causes. For example, a high change failure rate observed after a reduction in change lead time could imply quality has suffered as a result of shortening the code review period.
- All teams have their own challenges, KPIs, and circumstances: DevOps is successful when you implement processes that work for your team and your projects. DORA metrics are a good starting point for a broad range of organizations. However, the metrics are only a framework; you can customize them and change the measuring points. For example, your lead time could measure the time between a feature being added to your roadmap and its deployment. Because DORA metrics don't account for the specific context of your working environment, teams might appear to be low performers even though they're meeting all your organization's internal goals. DORA metrics are just one indicator of success, best used in conjunction with your organization's own business and technical aims.
Best Practices for Measuring DORA Metrics
DORA metrics can be difficult to collect and utilize if you're coming from a legacy process and are new to DevOps principles. At the beginning, most of the data required to establish your baseline performance. For long-term use, it's better to choose tools that can report DORA metrics for you.
The following are some best practices around using DORA metrics:
- Measure your deployment frequency: Count the number of days in each week or month where there's been a successful deployment. As an example, deploying on 20 days out of 31 in month 1, then 10 days out of 31 in month 2, results in a daily deployment frequency of 0.5 when measured across the entire two-month period. There are 62 days in total, of which 30 included a deployment. (30 / 62) = 0.48, which can be rounded to 0.5, indicating a deployment every other day.
- Measure your lead time for changes: This metric relies on you being able to correlate commits to the deployments they go out in. You can usually get this data from your source control and CI/CD platform, such as GitHub or GitLab. A commit made at 14:00 and deployed at 16:30 has a lead time of 2 hours and 30 minutes.
- Measure your change failure rate: You need to know the number of failed deployments made in a given time period. You can work this out by counting the number of incidents created as a consequence of deployed commits. Making ten deployments in a week and attributing three incidents to them results in a change failure rate of 30 percent.
- Measure your time to restore service: Start the timer rolling as soon as an incident is declared. Stop the timer once you've verified your fix and rolled it out to production. This gives you the time taken to restore service.
- Use DevOps performance tools to automate your measurements: Several platforms are available to aggregate all this data and expose DORA metrics for you. Faros and Sleuth are two examples of engineering operations platforms that surface and analyze data from multiple sources, including your issue backlog, source control system, and CI/CD pipelines. The GitLab source control and CI/CD system has integrated support for DORA as well, letting you collect measurements using your existing data. Last9's platform is another comprehensive solution, offering a reliability control center that unifies all your metrics into one platform. It also has incident detection and resolution capabilities for calculating your change failure rate and time to restore service.
- Regularly review your metrics: DORA metrics aren't meant to be measured once and then forgotten. Use your insights to make iterative improvements to your processes, then assess their effectiveness by repeating the measurements. You'll ideally observe a gradual increase in deployment frequency while lead time for changes, change failure rate, and time to restore service remain constant or decrease.
Conclusion
DORA metrics are four measurements standardized by DevOps Research and Assessment. Analyzing your deployment frequency, lead time for changes, change failure rate, and time to restore service provides actionable insights into DevOps success. The metrics reveal how quickly you're iterating, the quality of your deployments, and how effectively you can respond to outages.
Regularly reviewing trends in DORA metrics enables engineering teams and product managers to make informed decisions about future process optimizations. Using data to identify efficiencies makes it more likely that your changes will have the desired effect. Afterwards, you can measure the metrics again to see how they've changed before you implement any further adjustments.
Integrating DORA-compatible tooling into your process is the most reliable way to measure your metrics. Platforms such as Faros, Sleuth, and Last9 provide continuous analysis of engineering performance and production reliability, creating a single unified surface where you can assess DevOps success. This helps you establish an optimal DevOps pipeline that ships quality code more quickly.
Thanks to James Walker for contributing to the article.

