
Sometimes Docker behaves in ways that catch you off guard-containers don’t start as expected, images pause during pull, or networking takes longer than usual to respond.
In those moments, the Docker daemon logs are your best reference point.
These logs capture exactly what the Docker engine is doing at any given time. They give you a running account of system state, performance signals, and events that help you understand what’s happening beneath the surface.
In this blog, we talk about Docker Daemon Logs and how to read and use them for system health.
The Docker Daemon
Before we look at its logs, let's understand what the Docker daemon does.
What is the Docker Daemon?
The Docker daemon (dockerd) is the background process that makes Docker work. It listens for API requests and manages things like images, containers, networks, and volumes.
When you run a command such as docker run or docker build, the client talks to the daemon. From there, the daemon pulls images, starts containers, assigns resources, and keeps everything running. Without it, Docker doesn’t function.
Why Docker Daemon Logs are Important
Daemon logs are the running account of what Docker is doing. They give you:
- Troubleshooting clues – If a container won’t start or an image pull hangs, logs show where the issue began.
- Performance signals – Spikes or repeated warnings can point to bottlenecks before they cause bigger trouble.
- Security visibility – Image pulls, container creation, and other key actions are logged, giving you an audit trail.
- System health – Startup events, config changes, and runtime details tell you how Docker is behaving over time.
- Compliance coverage – For many teams, keeping these logs isn’t optional - they’re part of the record.
Daemon logs turn Docker from a black box into something you can observe and reason about.
Where to Find Docker Daemon Logs
Finding the Docker daemon logs is the first step in troubleshooting or monitoring Docker. The exact location depends on your OS and how Docker was installed, but there are clear defaults you can rely on.
Linux Systems
Most Linux distributions integrate Docker logs with the system’s logging service. Depending on your setup, you’ll either use journalctl (systemd) or check traditional log files.
Using journalctl (systemd-based distros: Ubuntu, Debian, Fedora, CentOS 7+):
The daemon logs are stored in the systemd journal.
# Show all daemon logs
journalctl -u docker.service

# Follow logs live (like tail -f)
journalctl -u docker.service -f

# Filter by time
journalctl -u docker.service --since "1 hour ago"
journalctl -u docker.service --since "2023-10-26 10:00:00" --until "2023-10-26 11:00:00"
You may need sudo privileges to run these commands.Using log files (rsyslog or older Linux):
Some older distributions, or custom installs, still write logs directly to files:
/var/log/docker.log/var/log/messages(mixed with system logs)/var/log/syslog(mixed with system logs)
Examples:
sudo tail -f /var/log/docker.log
sudo cat /var/log/syslog | grep dockerd
Windows Systems
On Windows, Docker integrates with the Event Viewer and Docker Desktop.
- Event Viewer:
- Open Event Viewer (
eventvwr.msc) - Navigate to Windows Logs → Application
- Filter by Source (
Dockerordockerd) to see events such as startup, shutdown, or critical errors
- Open Event Viewer (
- Docker Desktop Diagnostics:
- Click the Docker icon in the system tray
- Select Troubleshoot (bug icon) → Get logs
- This generates a diagnostics bundle that includes daemon logs plus other useful info
dockerd.exeoutput (development use):
Runningdockerd.exedirectly from a terminal stream logs to the console. Handy for debugging startup issues, but not something you’d rely on in production.
macOS Systems
Docker on macOS runs inside a lightweight Linux VM managed by Docker Desktop.
- Docker Desktop Diagnostics (recommended):
- Click the Docker whale icon in the macOS menu bar
- Go to Troubleshoot → Get logs
- This produces a bundle with daemon logs and other Docker Desktop components
- Accessing the VM directly (advanced):
Advanced users can log into the Linux VM created by Docker Desktop and usejournalctlfrom inside. This is rarely needed since the diagnostics tool covers most use cases.
A Quick Reference
| Platform | Default Method | Alternative |
|---|---|---|
| Linux (systemd) | journalctl -u docker.service |
Time filtering with --since / --until |
| Linux (older) | /var/log/docker.log |
/var/log/messages or /var/log/syslog |
| Windows | Event Viewer → Application logs | Docker Desktop → Troubleshoot → Get logs |
| macOS | Docker Desktop → Troubleshoot → Get logs | Advanced: VM access with journalctl |
How to Read Docker Daemon Logs Effectively
Once you know where the logs are, the next step is learning how to make sense of them. Docker daemon logs can look busy, but with the right approach, you can quickly spot the details that matter.
Log Levels: How to Prioritize
Docker logs are grouped by severity. These levels help you decide what to look at first:
- DEBUG – Very detailed output for tracing execution flow. You’ll use this when you need fine-grained insight into how the daemon is operating.
- INFO – Normal events: container start/stop, image pulls, network setup. These show you what’s happening under normal conditions.
- WARN – Signals something isn’t ideal, but Docker is still running. Examples include deprecated configs or resource pressure. These are worth reviewing before they turn into larger issues.
- ERROR – An operation failed, like a container that didn’t start or a registry connection that broke. These require action.
- FATAL – The daemon itself has stopped working. This is rare but critical to address right away.
A good habit is to start with ERROR and FATAL, then review WARN for additional context. Drop into INFO or DEBUG when you need a fuller picture.
Common Patterns You’ll See
As you work with the logs, you’ll notice certain entries appear often. Here are a few to recognize:
Container lifecycle
level=error msg="Error trying to remove container: remove <container_id>: container not found"Often happens when a script references containers that are already cleaned up.
Image handling
level=info msg="Pulling image: <image_name>"
level=error msg="Error pulling image: ... invalid reference format"
Shows both successful image pulls and errors from malformed image names or tags.
Socket or resource conflicts
level=error msg="failed to create listener on unix:///var/run/docker.sock: bind: address already in use"Suggests another process is holding the socket, or an older daemon instance hasn’t shut down.
Configuration or feature gaps
level=warning msg="Your kernel does not support cgroup blkio weight_device."Indicates a missing kernel feature. Not fatal, but it may limit performance.
Startup and readiness
level=info msg="Docker daemon" commit=... graphdriver=overlay2 version=...
level=info msg="Daemon has completed initialization"
Confirms the daemon is initialized and ready for API requests.
Tools That Make Analysis Easier
You don’t have to scan everything manually. A few tools help you zero in on what you need:
- less / more – Scroll and search through large logs interactively.
- Log management systems (Last9, ELK, or more) – Aggregate logs from multiple Docker hosts, run queries, visualize error rates, and set up alerts.
- jq – If your logs are in JSON,
jqlets you extract and format fields.
journalctl -u docker.service -o json | jq '.MESSAGE | select(contains("error"))'- grep / awk – Filter logs for keywords or error patterns.
journalctl -u docker.service | grep "level=error"Reading logs with this structure in mind - levels, patterns, and the right tools - helps you build a clear picture of how Docker is behaving and where your attention should go.
Troubleshooting Common Docker Issues
When something in Docker doesn’t behave as expected, the daemon logs often explain why. They give you specific details that point toward the root cause, saving you from guesswork.
Container startup failures
Sometimes a container shows Exited (1) or refuses to start. In these cases, the logs typically include error messages tied to resource allocation, port conflicts, or corrupted images.
Example:
failed to create containerd task: OCI runtime create failed: ...This points to a problem with the runtime, often due to resource limits or a malformed configuration.
Image pull failures
Pulling images from registries is a common place where errors show up. The daemon logs usually provide the exact reason - whether it’s a DNS issue, authentication error, or a malformed image tag.
For example,
level=error msg="Error pulling image: Get https://registry-1.docker.io/v2/: dial tcp: lookup registry-1.docker.io on 127.0.0.53:53: no such host"This is a DNS resolution failure that prevented the daemon from reaching Docker Hub.
Networking problems
If containers can’t reach each other or the outside world, daemon logs can highlight failed bridge creation, IP conflicts, or iptables rule issues. These entries help narrow down whether the problem lies in Docker’s networking layer or somewhere else.
Daemon crashes or unresponsiveness
When Docker itself stops responding, you’ll usually see a series of ERROR or FATAL entries leading up to the crash. On Linux, you can run:
journalctl -u docker.serviceOn Windows, you’d check Event Viewer. These logs often show stack traces, memory exhaustion messages, or config parsing errors that explain why the daemon went down.
Proactive Monitoring and Alerting
Docker daemon logs are also valuable when everything appears to be running smoothly. They provide signals you can use to anticipate problems, confirm changes, and automate alerts.
- Defining a baseline
INFOandWARNmessages during normal operation establish a picture of healthy activity. Later comparisons against this baseline make unusual patterns easier to spot. - Detecting configuration drift
Startup logs often include details about storage drivers, network settings, and other daemon options. Tracking these messages over time helps identify unexpected changes that could affect performance or stability. - Automating alerts
When integrated with platforms such as ELK, Splunk, Datadog, or Sumo Logic, daemon logs can drive automated responses. Typical alert conditions include:- Multiple
ERRORentries within a short period - A single
FATALevent indicating the daemon has stopped - Repeated warnings linked to critical resources like disk or memory
- Multiple
- Identifying resource exhaustion
Some warnings appear well before they cause failures. For example:
overlayfs: maximum amount of 500 inode warnings has been hitThis entry points to inode pressure, which, left unchecked, may prevent new containers from starting.
Security and Auditing
Every action the Docker daemon takes is recorded, which makes its logs a reliable source for auditing and security investigations. They provide both operational visibility and compliance coverage.
- Unauthorized access attempts
Failed authentication requests against registries or Docker APIs are written directly into the logs. These entries help identify misconfigured credentials or repeated login attempts from unrecognized sources. - Compliance verification
Many organizations must keep records of system operations for audit purposes. Docker daemon logs serve this role by providing an immutable record of actions such as image downloads, container startups, and configuration updates. - Post-incident analysis
In the event of a security issue, daemon logs act as a timeline of events. Entries related to container lifecycle, privilege escalations, or network changes help reconstruct what occurred and how far it spread. - Unusual activity patterns
A sudden increase in image pulls, unexpected container creations, or configuration changes can all show up clearly. For example:
level=info msg="Pulling image: ..."when repeated from a non-standard registry might signal unapproved activity.
These details in the daemon logs provide two layers of value: immediate visibility into daily activity and long-term records for audits and investigations. They help you track routine operations, meet compliance requirements, and reconstruct events if a security incident occurs.
Best Practices for Docker Daemon Log Management
With the right practices, you can make Docker daemon logs easier to manage, keep them secure, and turn them into a reliable source of insights. Here are a few approaches you can start with:
Log Rotation: Prevent Disk Issues
Docker daemon logs can grow quickly, especially on busy systems. If they aren’t rotated, they may fill up your disk and cause other services to fail. Rotation policies handle this automatically by archiving, compressing, or removing old entries.
- Linux (file-based logs): On systems using log files,
logrotateis standard. Configs in/etc/logrotate.d/dockerdefine how often logs rotate, how many copies to keep, and whether to compress them. - Windows/macOS: Docker Desktop rotates internally. You don’t usually configure it, but diagnostic bundles can become large, so cleaning them up or ensuring enough disk space is still important.
- Linux (systemd/journald): Journald manages rotation by default. Configure limits in
/etc/systemd/journald.conf, for example:
SystemMaxUse=10Gto cap the total log size at 10GB.
Recommendation: Keep a few weeks of logs in production. That’s usually enough to investigate issues without overwhelming disk space.
Centralized Logging: Make Analysis Easier
On a single host, reading daemon logs directly works fine. In larger setups, logging into each server is inefficient. Centralized logging pulls everything into one place, giving you a full view of your infrastructure.
Benefits include:
- Unified search: Query across all hosts instead of checking them one by one.
- Dashboards: Visualize trends in daemon health, errors, and resource usage.
- Alerts: Get notified about recurring errors or critical failures.
Tools like Filebeat, Fluentd, or Logstash-forwarder can collect logs and send them to platforms such as Last9, ELK, or Grafana Loki.
Retention Policies: Decide How Long to Keep Logs
Centralized logging solves access, but retention is another challenge. Keeping logs forever is expensive, while deleting them too quickly may leave you without a trail during investigations.
- Compliance: Some industries require logs for 90 days or longer.
- Troubleshooting: Keeping 30–90 days of “hot” searchable logs helps with diagnosing intermittent issues.
- Archiving: Older logs can be moved to cheaper storage like Amazon S3 Glacier or Azure Blob Archive.
Most logging systems support lifecycle policies, which automatically transition logs between storage classes or delete them once they expire.
Securing Logs: Protecting What They Contain
Logs often reveal sensitive details - configuration values, IP addresses, or even secrets. Protecting them is as important as protecting application data.
- Access control: Use RBAC and grant read-only permissions where possible. Restrict full access to administrators.
- Encryption: Always encrypt logs in transit (TLS/SSL) and at rest. Most LMS platforms provide this by default.
- Integrity checks: Use immutable storage or tamper detection to ensure logs haven’t been altered.
- Redaction: Strip out items like API keys or PII before forwarding logs to central storage.
Make Docker Daemon Logs Actionable with Last9
At Last9, we understand the critical role that comprehensive observability plays in maintaining the health and reliability of complex cloud-native environments, including those powered by Docker.
Docker daemon logs provide important insight, but they become more useful when integrated into a broader observability strategy.
Last9 ingests daemon logs alongside container logs, metrics, and traces, making them part of a complete observability workflow.
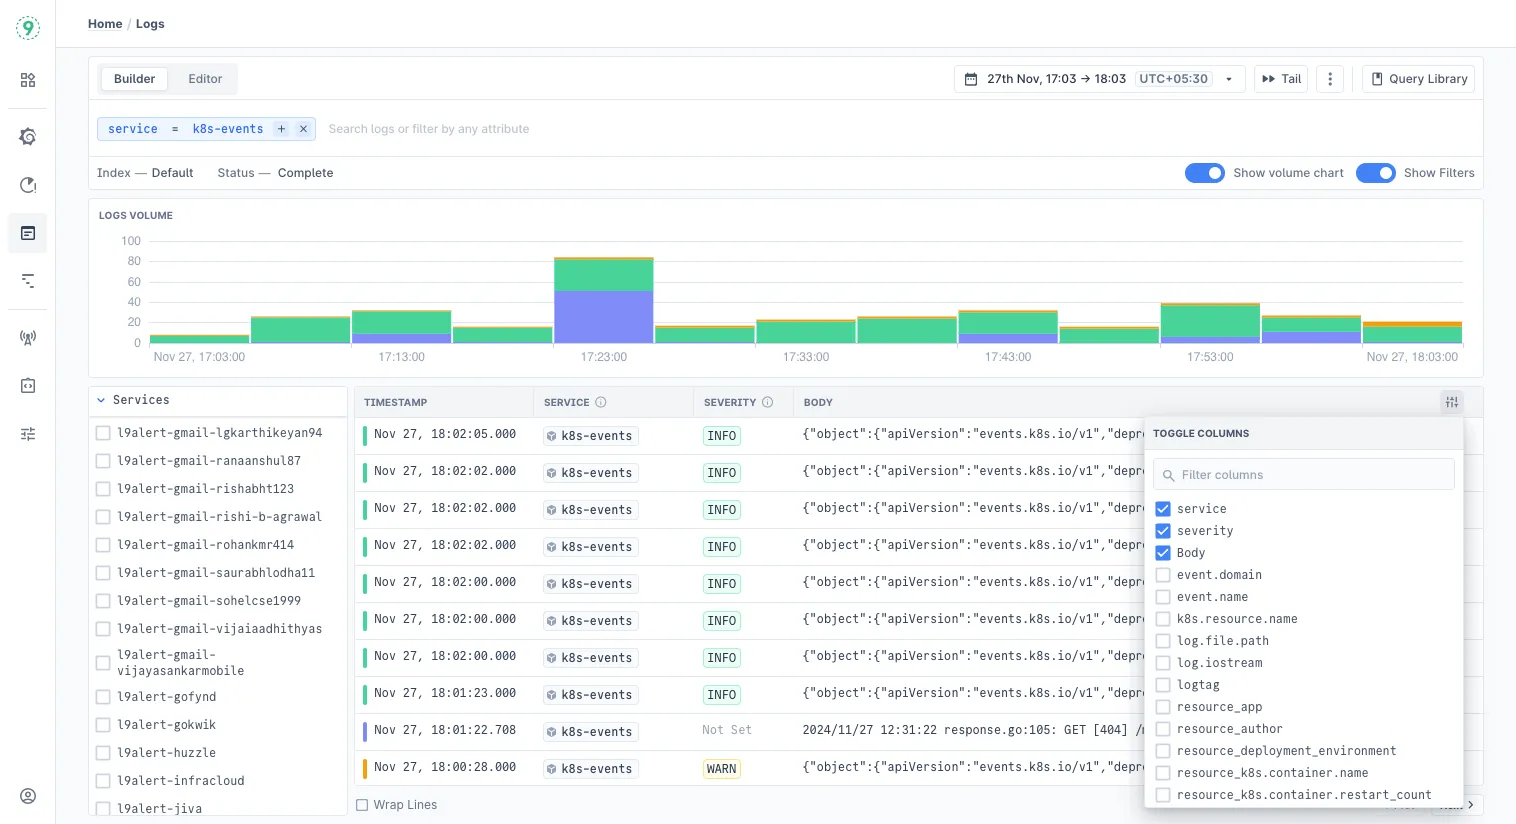
You can explore logs through the Logs Explorer in Last9. It lets you filter by log attributes and resource details, break down data across different dimensions, and view logs alongside correlated telemetry.
- Context across signals - Correlate daemon-level errors with container events, application traces, and infrastructure metrics to understand whether an issue stems from misconfiguration, resource limits, or code-level bugs.
- Efficient investigation - Instead of tailing log files per host, query logs in a centralized explorer with filtering and pattern matching. Cross-reference with traces to shorten root cause analysis.
- Proactive detection - Define log-based alerts on error spikes, repeated warnings, or daemon restarts. Early signals help prevent minor issues from escalating into downtime.
- Retention at scale - Keep recent logs in fast storage for day-to-day debugging, while older data is automatically archived to cost-effective storage tiers for compliance or trend analysis.
- Secure handling - Logs are encrypted in transit and at rest, with role-based access control and immutability features to maintain integrity.
With this approach, daemon logs shift from isolated files into structured, queryable data that links directly with metrics and traces-helping you maintain both operational reliability and long-term visibility.
Start for free today or talk to us to understand how it works with your stack!
FAQs
How do I check Docker logs?
There are two types of logs: container logs and daemon logs.
Daemon logs: On Linux (systemd-based), run:
journalctl -u docker.serviceThis shows events from the Docker daemon itself.
Container logs:
docker logs <container_id>Use this to see logs from a running or stopped container.
What is the difference between daemon logging and container logging?
Daemon logs capture the behavior of the Docker engine (dockerd): startup, configuration, networking, image pulls, crashes, etc.
- Container logs capture stdout/stderr from the processes inside a container.
Where are the Docker log files stored?
- On systemd-based Linux: stored in the systemd journal, accessible with
journalctl. - On older Linux or file-based setups:
/var/log/docker.log/var/log/syslogor/var/log/messages
- On Windows/macOS: managed through Docker Desktop, viewable in the Troubleshoot > Get Logs menu.
How to check the Docker daemon status?
Run:
systemctl status dockerThis shows whether the daemon is active and includes recent log entries.
How to check the last 100 logs in Docker?
For daemon logs (Linux, systemd):
journalctl -u docker.service -n 100For container logs:
docker logs --tail 100 <container_id>Where is the Docker daemon log?
- Linux (systemd): in the systemd journal (
journalctl -u docker.service). - Linux (non-systemd): often
/var/log/docker.log. - Windows/macOS: through Docker Desktop diagnostics.
How to expose a port on a live Docker container?
You can’t directly change port bindings of a running container. Instead:
- Stop and remove the container.
Re-run it with the -p flag:
docker run -d -p 8080:80 <image_name>Alternatively, use a reverse proxy (like NGINX) on the host to forward traffic to the container.
How to restart a single container with Docker Compose?
Run:
docker compose restart <service_name>This restarts only the specified service container.
How to list all containers running in a cluster?
If you’re running plain Docker:
docker psIn a Docker Swarm cluster:
docker node ps <node_name>In Kubernetes:
kubectl get pods -AHow to enable graceful node shutdown?
In Kubernetes (v1.21+), set the kubelet flags:
--shutdown-grace-period=30s
--shutdown-grace-period-critical-pods=10s
This ensures pods get time to terminate before the node shuts down.
Is there a way to filter those out to show only the dockerd logs?
Yes. On Linux (systemd):
journalctl -u docker.service | grep dockerdThis filters only the entries that come from the dockerd process.
How to enable audit logging in a PMK cluster?
In Platform9 Managed Kubernetes (PMK), you can enable audit logging by editing the API server flags in the cluster configuration. Example:
--audit-log-path=/var/log/kubernetes/audit.log
--audit-policy-file=/etc/kubernetes/audit-policy.yaml
How can I change the detach key combination for Kubernetes pods?
If you’re using kubectl attach, you can change the detach sequence with the --detach-keys flag. Example:
kubectl attach <pod_name> --detach-keys="ctrl-x"How can I view real-time Docker daemon logs?
On Linux:
journalctl -u docker.service -fThis works like tail -f and streams new log entries as they’re written.
How can I troubleshoot issues using Docker daemon logs?
- Start by looking for
ERRORorFATALentries. - Check for warnings about networking, cgroups, or storage drivers.
- Correlate the log timestamps with when the issue occurred (container crash, failed pull, etc.).
How can I view and analyze Docker daemon logs for troubleshooting?
For quick checks:
journalctl -u docker.serviceFor deeper analysis:
- Use
grepto filter specific errors. - Configure structured logging (JSON format) and process logs with
jq. - Forward logs to a centralized system (ELK, Datadog, Last9) for querying, visualization, and alerts.
How can I troubleshoot Docker daemon errors using logs?
- Identify the log level (
ERRORorFATAL). - Read the message to pinpoint the source - common issues include port conflicts, DNS failures, or insufficient resources.
- Combine daemon logs with container logs (
docker logs <container_id>) for full context.
If errors persist, restart the daemon:
sudo systemctl restart dockerand review new log entries.