

Database performance tuning is the process of identifying and fixing bottlenecks that slow down your database. Unlike one-time optimization, tuning is ongoing: new queries, growing data, and changing access patterns mean what worked last month may not work today.
This guide covers the tuning techniques that have the most impact in production, from connection management to memory configuration, with examples for PostgreSQL and MySQL.
What is database performance tuning?
Database performance tuning is the ongoing process of adjusting database configuration, queries, and maintenance schedules to reduce latency and increase throughput. The key areas are connection pooling (reducing connection overhead), memory configuration (maximizing cache hit ratios), write path optimization (WAL/redo log tuning), and vacuum/maintenance scheduling. Start by identifying the actual bottleneck with slow query logs and system metrics before changing any settings.
Start with the Bottleneck, Not the Config
The most common mistake in database tuning is tweaking configuration parameters without knowing what the actual problem is. Before changing anything, answer these questions:
- Which queries are slow? Check slow query logs or pg_stat_statements in PostgreSQL
- Is the bottleneck CPU, I/O, memory, or network? System metrics tell you where the database is spending time
- Is the load pattern read-heavy, write-heavy, or mixed? The tuning approach differs for each
Without this baseline, you are guessing. Ship your database metrics to an observability platform so you have the data to guide tuning decisions.
Connection Management
Database connections are expensive. Each connection consumes memory (typically 5-10MB in PostgreSQL), and too many connections cause context switching overhead that degrades performance for everyone.
Connection pooling
Use a connection pooler between your application and the database. PgBouncer for PostgreSQL and ProxySQL for MySQL are the standard choices.
# PgBouncer config (pgbouncer.ini)[databases]myapp = host=127.0.0.1 dbname=myapp
[pgbouncer]pool_mode = transaction    # release connection after each transactionmax_client_conn = 1000     # app can open up to 1000 connectionsdefault_pool_size = 50     # only 50 actual database connections
Without pooling, an application with 200 workers opening direct connections uses 200 database connections. With transaction-mode pooling, those same 200 workers share 20-50 actual connections.
Right-sizing max_connections
PostgreSQL’s default max_connections = 100 is a starting point, not a target. More connections does not mean more throughput. Beyond a certain point (often 200-300 for PostgreSQL), adding connections decreases performance due to lock contention and memory pressure.
-- Check current connection usageSELECT count(*) as total, count(*) FILTER (WHERE state = 'active') as active, count(*) FILTER (WHERE state = 'idle') as idleFROM pg_stat_activity;If most connections are idle, your pool size is too large.
Memory Configuration
Memory settings have the biggest impact on read performance. Get these wrong and every query hits disk unnecessarily.
PostgreSQL
# shared_buffers: 25% of system RAM is the standard starting pointshared_buffers = 8GB        # for a 32GB server
# effective_cache_size: tell the planner how much RAM is available for caching# Set to ~75% of system RAMeffective_cache_size = 24GB
# work_mem: memory per sort/hash operation per query# Start low, increase for specific workloadswork_mem = 64MB
# maintenance_work_mem: memory for VACUUM, CREATE INDEX, etc.maintenance_work_mem = 1GB
The most common mistake: setting shared_buffers too high. Beyond 25-30% of RAM, PostgreSQL fights with the OS page cache for the same memory, which hurts performance rather than helping.
MySQL (InnoDB)
# innodb_buffer_pool_size: the single most important MySQL setting# Set to 70-80% of system RAM on a dedicated database serverinnodb_buffer_pool_size = 24G    # for a 32GB server
# innodb_log_file_size: larger = better write performance, slower crash recoveryinnodb_log_file_size = 2G
# innodb_buffer_pool_instances: split the buffer pool to reduce contentioninnodb_buffer_pool_instances = 8
Monitor the buffer pool hit ratio. If it drops below 99%, you either need more memory or your working set has outgrown the server.
-- MySQL buffer pool hit ratioSHOW GLOBAL STATUS LIKE 'Innodb_buffer_pool_read%';-- hit ratio = 1 - (Innodb_buffer_pool_reads / Innodb_buffer_pool_read_requests)Write Performance Tuning
Write-heavy workloads have different bottlenecks than reads. The main levers are WAL/redo log configuration, checkpoint tuning, and index management.
Checkpoint tuning (PostgreSQL)
PostgreSQL writes dirty pages to disk during checkpoints. If checkpoints happen too frequently, they cause I/O spikes that slow down everything:
# Spread checkpoint I/O over more timecheckpoint_completion_target = 0.9
# Increase the interval between checkpointsmax_wal_size = 4GBmin_wal_size = 1GB
Monitor checkpoint frequency in the PostgreSQL logs. If you see checkpoints happening every few minutes during normal load, increase max_wal_size.
Batch operations
Individual inserts are slow. Batch them:
-- Slow: 10,000 individual inserts (10,000 transactions, 10,000 fsync calls)INSERT INTO events (user_id, type) VALUES (1, 'click');INSERT INTO events (user_id, type) VALUES (2, 'view');-- ... 9,998 more
-- Fast: one multi-row insert (1 transaction, 1 fsync)INSERT INTO events (user_id, type) VALUES  (1, 'click'),  (2, 'view'),  -- ... batch of 1000;
For bulk loads, disable indexes, load the data, then rebuild indexes. This can be 10-50x faster than inserting into an indexed table.
Vacuum and Maintenance
PostgreSQL’s MVCC architecture means deleted and updated rows leave behind dead tuples that bloat tables and indexes. Autovacuum cleans these up, but the defaults are conservative.
Tuning autovacuum for high-write tables
-- For a table with heavy updates (e.g., sessions, counters)ALTER TABLE sessions SET ( autovacuum_vacuum_scale_factor = 0.02, -- vacuum at 2% dead tuples (default 20%) autovacuum_analyze_scale_factor = 0.01, -- analyze at 1% changes autovacuum_vacuum_cost_delay = 2 -- less throttling);If a table grows to 100M rows, the default 20% threshold means autovacuum waits until 20M dead tuples accumulate. By then, the table is massively bloated and vacuum takes hours.
Monitoring bloat
-- Quick estimate of table bloat in PostgreSQLSELECT schemaname, tablename, pg_size_pretty(pg_total_relation_size(schemaname || '.' || tablename)) as total_size, n_dead_tup, n_live_tup, round(n_dead_tup::numeric / nullif(n_live_tup, 0) * 100, 1) as dead_pctFROM pg_stat_user_tablesWHERE n_dead_tup > 10000ORDER BY n_dead_tup DESC;Tables with more than 10-20% dead tuples need attention. Either autovacuum is not keeping up, or it is being blocked by long-running transactions.
Lock Contention
Locks become a bottleneck when multiple transactions compete for the same rows or tables. The symptoms are queries that are “fast” in isolation but slow under load.
Finding lock problems
-- PostgreSQL: find blocked queriesSELECT blocked_locks.pid AS blocked_pid, blocked_activity.query AS blocked_query, blocking_locks.pid AS blocking_pid, blocking_activity.query AS blocking_queryFROM pg_catalog.pg_locks blocked_locksJOIN pg_catalog.pg_locks blocking_locks ON blocking_locks.locktype = blocked_locks.locktype AND blocking_locks.relation = blocked_locks.relation AND blocking_locks.pid != blocked_locks.pidJOIN pg_catalog.pg_stat_activity blocked_activity ON blocked_activity.pid = blocked_locks.pidJOIN pg_catalog.pg_stat_activity blocking_activity ON blocking_activity.pid = blocking_locks.pidWHERE NOT blocked_locks.granted;Common fixes: keep transactions short, avoid SELECT ... FOR UPDATE when FOR SHARE is enough, and use SKIP LOCKED for queue-style workloads.
When to Scale vs When to Tune
Tuning has limits. If your database is CPU-bound after optimizing queries and configuration, you need more hardware. If it is I/O-bound after moving to SSDs, you need read replicas or caching.
Signs you have outgrown tuning:
- CPU consistently above 80% during normal load
- Buffer pool hit ratio below 98% with all available RAM allocated
- Replication lag growing despite optimized write path
- p99 latency spiking even with all queries optimized
At that point, consider read replicas for read scaling, caching (Redis/Memcached) for hot data, or sharding for write scaling.
For a broader view of database performance, see our database optimization guide. For index-specific tuning, see our guide on database indexing.
See Every Database in Your Cloud from One Place
Most teams run five or six different databases across dev, staging, and production, and nobody has a single view of all of them. When a query starts timing out, the first question is always “which database is this hitting?” followed by “who owns that service?”
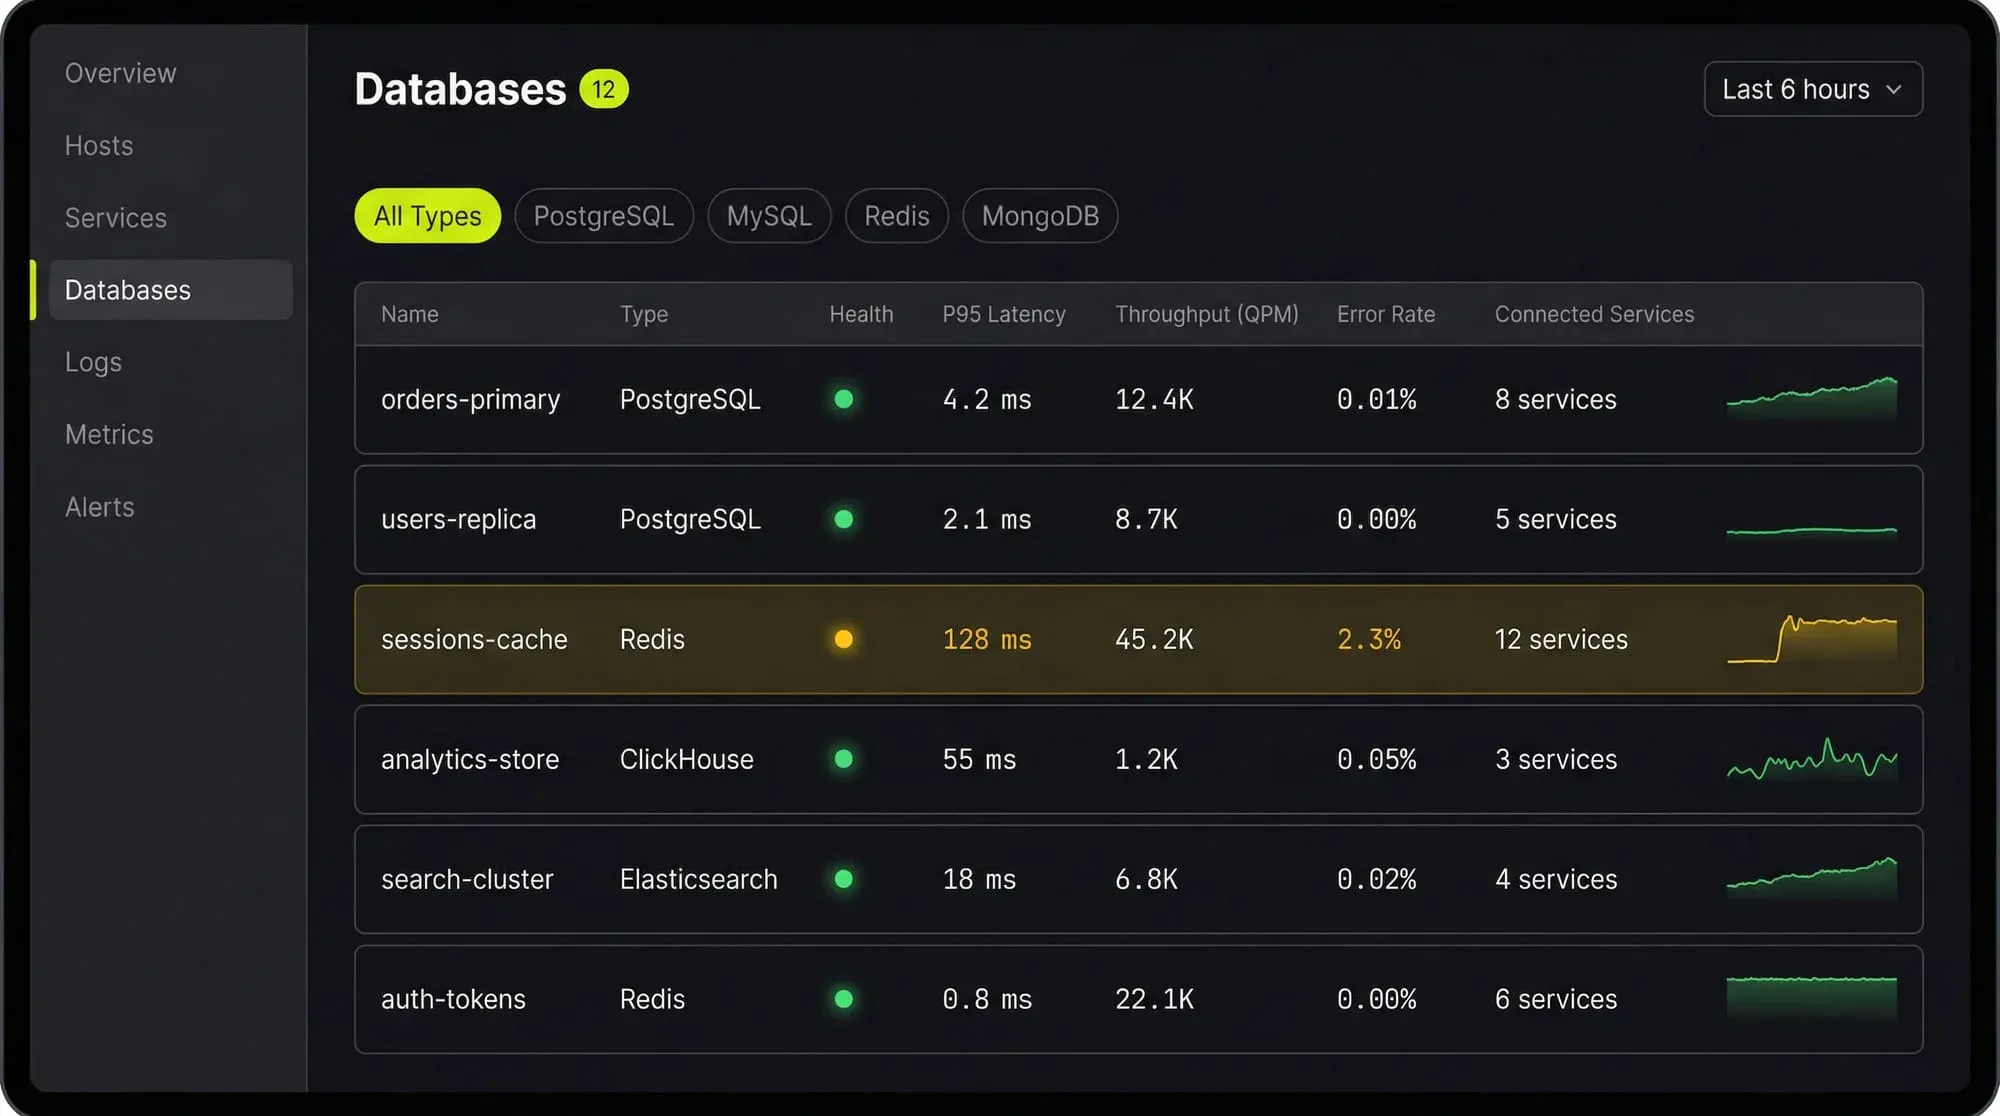
Last9’s Discover Databases gives you that single view. It automatically detects every database in your cloud (PostgreSQL, MySQL, MongoDB, Redis, Elasticsearch, and more) and shows them alongside the services that talk to them and the infrastructure they run on. You get:
- Every database, one screen: No more hunting through AWS consoles, Kubernetes dashboards, and team wikis to figure out what databases exist and who owns them
- Service-to-database mapping: See which services call which databases, so when a database is slow you immediately know the blast radius
- Infrastructure context: CPU, memory, disk, and connection pool metrics for the underlying host or pod, right next to query performance
- Traces to queries: Click from a slow API endpoint trace directly into the database query that caused the latency
If you are tuning databases by hand and correlating metrics across three different tools, Discover Databases puts everything in one place so you can find the bottleneck in minutes instead of hours.
FAQs
How do I know if my database needs tuning?
Check three things: slow query log frequency (are more queries exceeding your threshold?), CPU and I/O utilization (is the server under pressure?), and p99 latency trends (is tail latency growing over weeks?). If any of these are trending worse, it is time to tune.
Should I tune PostgreSQL or MySQL first?
Tune whichever is the bottleneck. Run your application under realistic load and check which database shows higher CPU, I/O, or lock contention. The tuning techniques overlap significantly.
How much RAM should I give to the database?
On a dedicated database server: 25% to shared_buffers (PostgreSQL) or 70-80% to innodb_buffer_pool_size (MySQL), with the rest available for OS cache and connections. On a shared server, scale down proportionally.
What is the most impactful single change?
For reads: adding a missing index. For writes: enabling connection pooling. For overall performance: fixing the one query that consumes the most total database time (find it with pg_stat_statements or performance_schema).
How often should I review database performance?
Check weekly during normal growth. Review immediately after schema changes, major releases, traffic spikes, or when alerting triggers on query latency or connection count thresholds.
Does database tuning reduce cloud costs?
Yes. A well-tuned database on a smaller instance often outperforms an untuned database on a larger one. Right-sizing after tuning is one of the easiest ways to cut cloud spend.

