
A common problem with OpenTelemetry is that a language has support for trace instrumentation, but metrics instrumentation support is in progress or not yet available. In such cases, you can use SpanConnector to convert spans generated by traces into metrics.
What is a Connector?
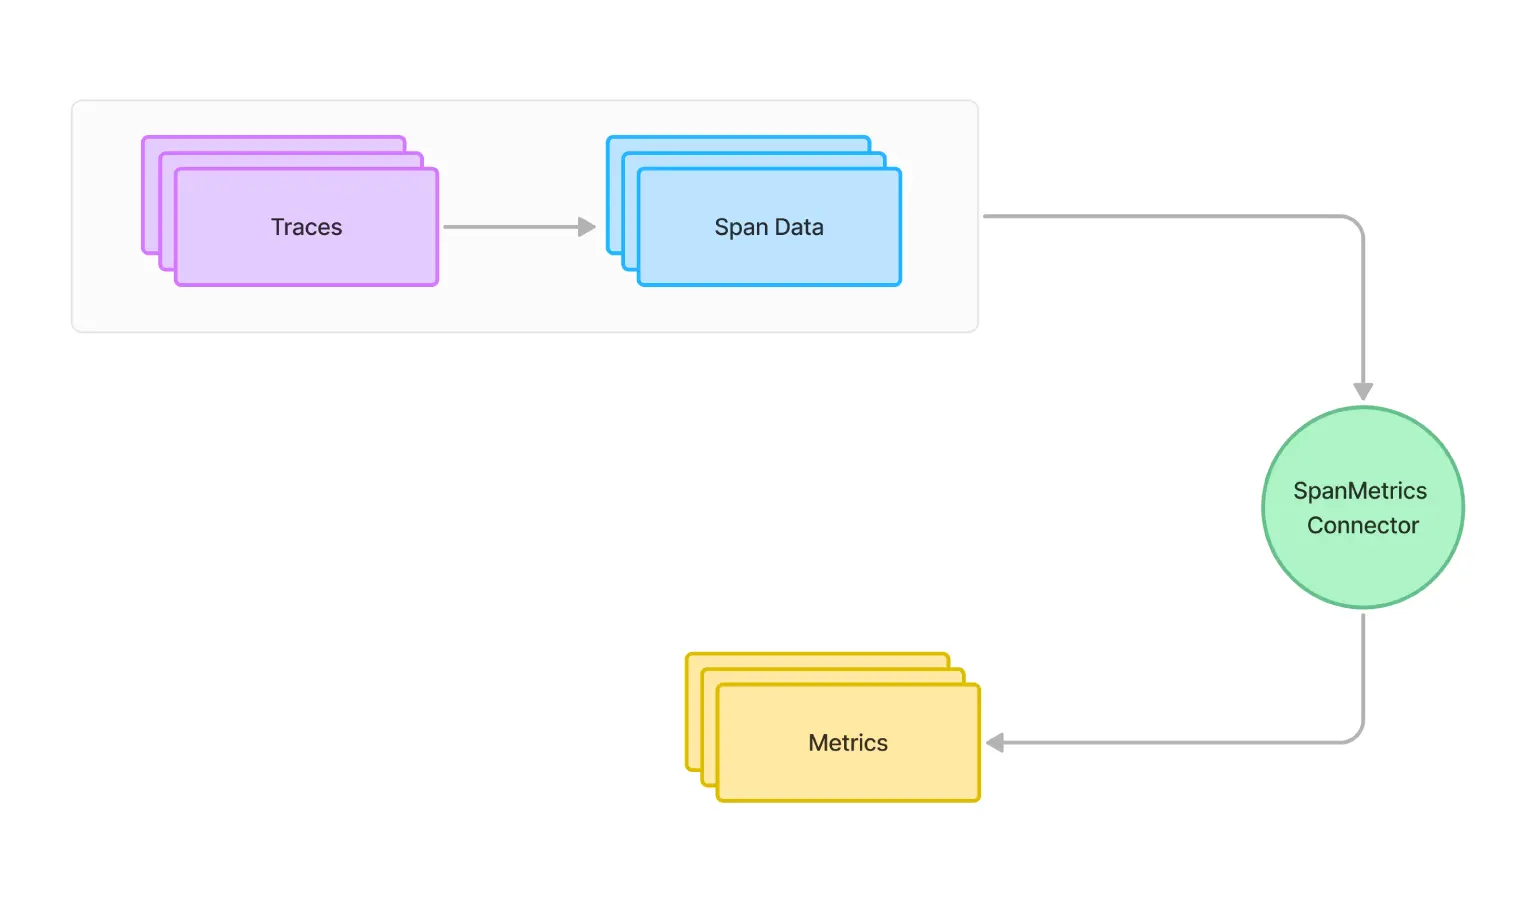
SpanConnector is a component in the OpenTelemetry Collector that allows you to derive metrics from span data. This is particularly useful when you have robust tracing but lack native metrics support in your language or framework.
Converting traces to metrics offers valuable insights into system performance and health without requiring separate instrumentation. This unified approach creates a more comprehensive observability picture and reduces the overhead of managing two distinct instrumentation systems.
SpanMetrics Configuration for Optimal OpenTelemetry Performance
Aggregates Request, Error, and Duration (R.E.D) OpenTelemetry metrics from span data.
connectors:
  spanmetrics:
    histogram:
      explicit:
        buckets: [100us, 1ms, 2ms, 6ms, 10ms, 100ms, 250ms]
    dimensions:
      - name: http.method
        default: GET
      - name: http.status_code
      - name: host.name
    exemplars:
      enabled: true
    dimensions_cache_size: 1000
    aggregation_temporality: "AGGREGATION_TEMPORALITY_CUMULATIVE"
    metrics_flush_interval: 15s
    metrics_expiration: 5m
    events:
      enabled: true
      dimensions:
        - name: exception.type
        - name: exception.message
    resource_metrics_key_attributes:
      - service.name
      - telemetry.sdk.language
      - telemetry.sdk.name
Understanding the SpanMetrics Configuration
Let's break down the critical components of this configuration:
-
Histogram Buckets: The histogram.explicit.buckets field defines the latency buckets for your metrics. This allows you to see the distribution of request durations.
-
Dimensions: These are the attributes from your spans that will be used to create labels for your metrics. In this example, we're using http.method, http.status_code, and host.name.
-
Exemplars: When enabled, you can link metrics back to specific trace exemplars, providing more context for your metrics.
-
Dimensions Cache: This sets the maximum number of unique dimension combinations to store. It helps manage memory usage.
-
Aggregation Temporality: This determines how metrics are aggregated over time. "CUMULATIVE" means metrics are accumulated from the start of the process.
-
Metrics Flush Interval: This sets how often metrics are emitted from the connector.
-
Metrics Expiration: This defines how long metrics are kept in memory before being discarded if not updated.
-
Events: When enabled, you can create metrics from span events, such as exceptions.
-
Resource Metrics Key Attributes: These attributes from the resource associated with the spans will be added as labels to all generated metrics.
Benefits of Using SpanMetrics Connector
- Unified Observability: Converting traces to metrics gives you a more complete picture of your system's performance without needing separate instrumentation for metrics.
- Consistency: Ensures that your metrics align perfectly with your traces derived from the same source.
- Reduced Overhead: Eliminates the need for dual instrumentation (traces and metrics) in your application code.
- Flexibility: You can generate custom metrics based on your needs and span attributes.
Step-by-Step Guide to Implementing SpanMetrics
- Set up OpenTelemetry Tracing: First, ensure your application is properly instrumented for tracing.
Here's a simple example using Python:
from opentelemetry import trace
from opentelemetry.sdk.trace import TracerProvider
from opentelemetry.sdk.trace.export import (
    ConsoleSpanExporter,
    BatchSpanProcessor,
)
from opentelemetry.exporter.otlp.proto.grpc.trace_exporter import OTLPSpanExporter

# Set up the tracer provider
trace.set_tracer_provider(TracerProvider())

# Create an OTLP exporter
otlp_exporter = OTLPSpanExporter(endpoint="http://localhost:4317", insecure=True)

# Create a BatchSpanProcessor and add the exporter to it
span_processor = BatchSpanProcessor(otlp_exporter)

# Add the span processor to the tracer provider
trace.get_tracer_provider().add_span_processor(span_processor)

# Get a tracer
tracer = trace.get_tracer(__name__)

# Use the tracer to create spans in your code
with tracer.start_as_current_span("main"):
    # Your application code here
pass- Install and Configure the OpenTelemetry Collector
a. Download the OpenTelemetry Collector:
curl -OL https://github.com/open-telemetry/opentelemetry-collector-releases/releases/download/v0.81.0/otelcol-contrib_0.81.0_linux_amd64.tar.gz
tar xzf otelcol-contrib_0.81.0_linux_amd64.tar.gz
b. Create a configuration file named otel-collector-config.yaml:
receivers:
  otlp:
    protocols:
      grpc:
      http:

processors:
  batch:

connectors:
  spanmetrics:
    histogram:
      explicit:
        buckets: [100us, 1ms, 2ms, 6ms, 10ms, 100ms, 250ms]
    dimensions:
      - name: http.method
        default: GET
      - name: http.status_code
      - name: host.name
    exemplars:
      enabled: true
    dimensions_cache_size: 1000
    aggregation_temporality: "AGGREGATION_TEMPORALITY_CUMULATIVE"
    metrics_flush_interval: 15s
    metrics_expiration: 5m
    events:
      enabled: true
      dimensions:
        - name: exception.type
        - name: exception.message
    resource_metrics_key_attributes:
      - service.name
      - telemetry.sdk.language
      - telemetry.sdk.name

exporters:
  prometheus:
    endpoint: "0.0.0.0:8889"
  logging:
    verbosity: detailed

service:
  pipelines:
    traces:
      receivers: [otlp]
      processors: [batch]
      exporters: [logging, spanmetrics]
    metrics:
      receivers: [spanmetrics]
      exporters: [logging, prometheus]
3. Start the OpenTelemetry Collector
Run the collector with your configuration:
./otelcol-contrib --config otel-collector-config.yaml4. Send Traces to the Collector
Modify your application to send traces to the collector. If you're using the Python example from step 1, you're already set up to send traces to http://localhost:4317.
5. View the Generated Metrics
a. The Prometheus exporter in the collector configuration will expose metrics on http://localhost:8889/metrics. You can curl this endpoint to see the raw metrics:
curl http://localhost:8889/metricsb. For a more user-friendly view, you can set up Prometheus to scrape these metrics:
Create a prometheus.yml file:
global:
  scrape_interval: 15s

scrape_configs:
  - job_name: 'otel-collector'
    static_configs:
      - targets: ['localhost:8889']
Start Prometheus (assuming you've downloaded it):
./prometheus --config.file=prometheus.ymlYou can now access the Prometheus UI at http://localhost:9090 to query and visualize your metrics.
SpanConnector is a powerful tool in the OpenTelemetry ecosystem that bridges the gap between tracing and metrics.
You can enhance your observability strategy without additional instrumentation overhead by leveraging your existing trace data to generate meaningful metrics. This approach is particularly valuable for teams transitioning to OpenTelemetry or working with languages with limited metrics support.
Last9 supports this through its Control panel and it's a breeze to configure through a UI experience.