
Modern applications rely on microservices, making it tough to track issues across services. Distributed tracing helps by mapping a request’s journey and pinpointing latency, failures, and dependencies.
Unlike traditional monitoring, tracing connects the dots between services, offering deeper visibility. But implementing it isn’t easy—it brings high data volumes, performance overhead, and complexity.
In this blog, we’ll break down these challenges and how to tackle them so that tracing stays a solution, not a headache.
What is Distributed Tracing?
Ever spent hours chasing down a bug or performance issue in a microservices-based app, only to realize you have no idea where the request is getting stuck? That’s exactly where distributed tracing comes in.
In a monolithic system, debugging is relatively simple—you check the logs, follow the stack trace, and usually, you can spot the issue. But in a microservices architecture, a single user request can flow through multiple services, each logging its own piece of the puzzle. Without a way to connect these logs across services, it’s nearly impossible to figure out where things went wrong.
Distributed tracing solves this by:
- Tagging each request with a unique trace ID that follows it across all services.
- Recording each service’s work as a span, which is a small unit of work in the trace.
- Reconstructing the entire journey of the request, from the frontend, through the various services, and back.
With this approach, you can:
- Pinpoint slow services and identify performance bottlenecks.
- Detect failures faster by tracing the request across all affected services.
- Get a complete view of your system’s behavior in production, enabling faster troubleshooting.
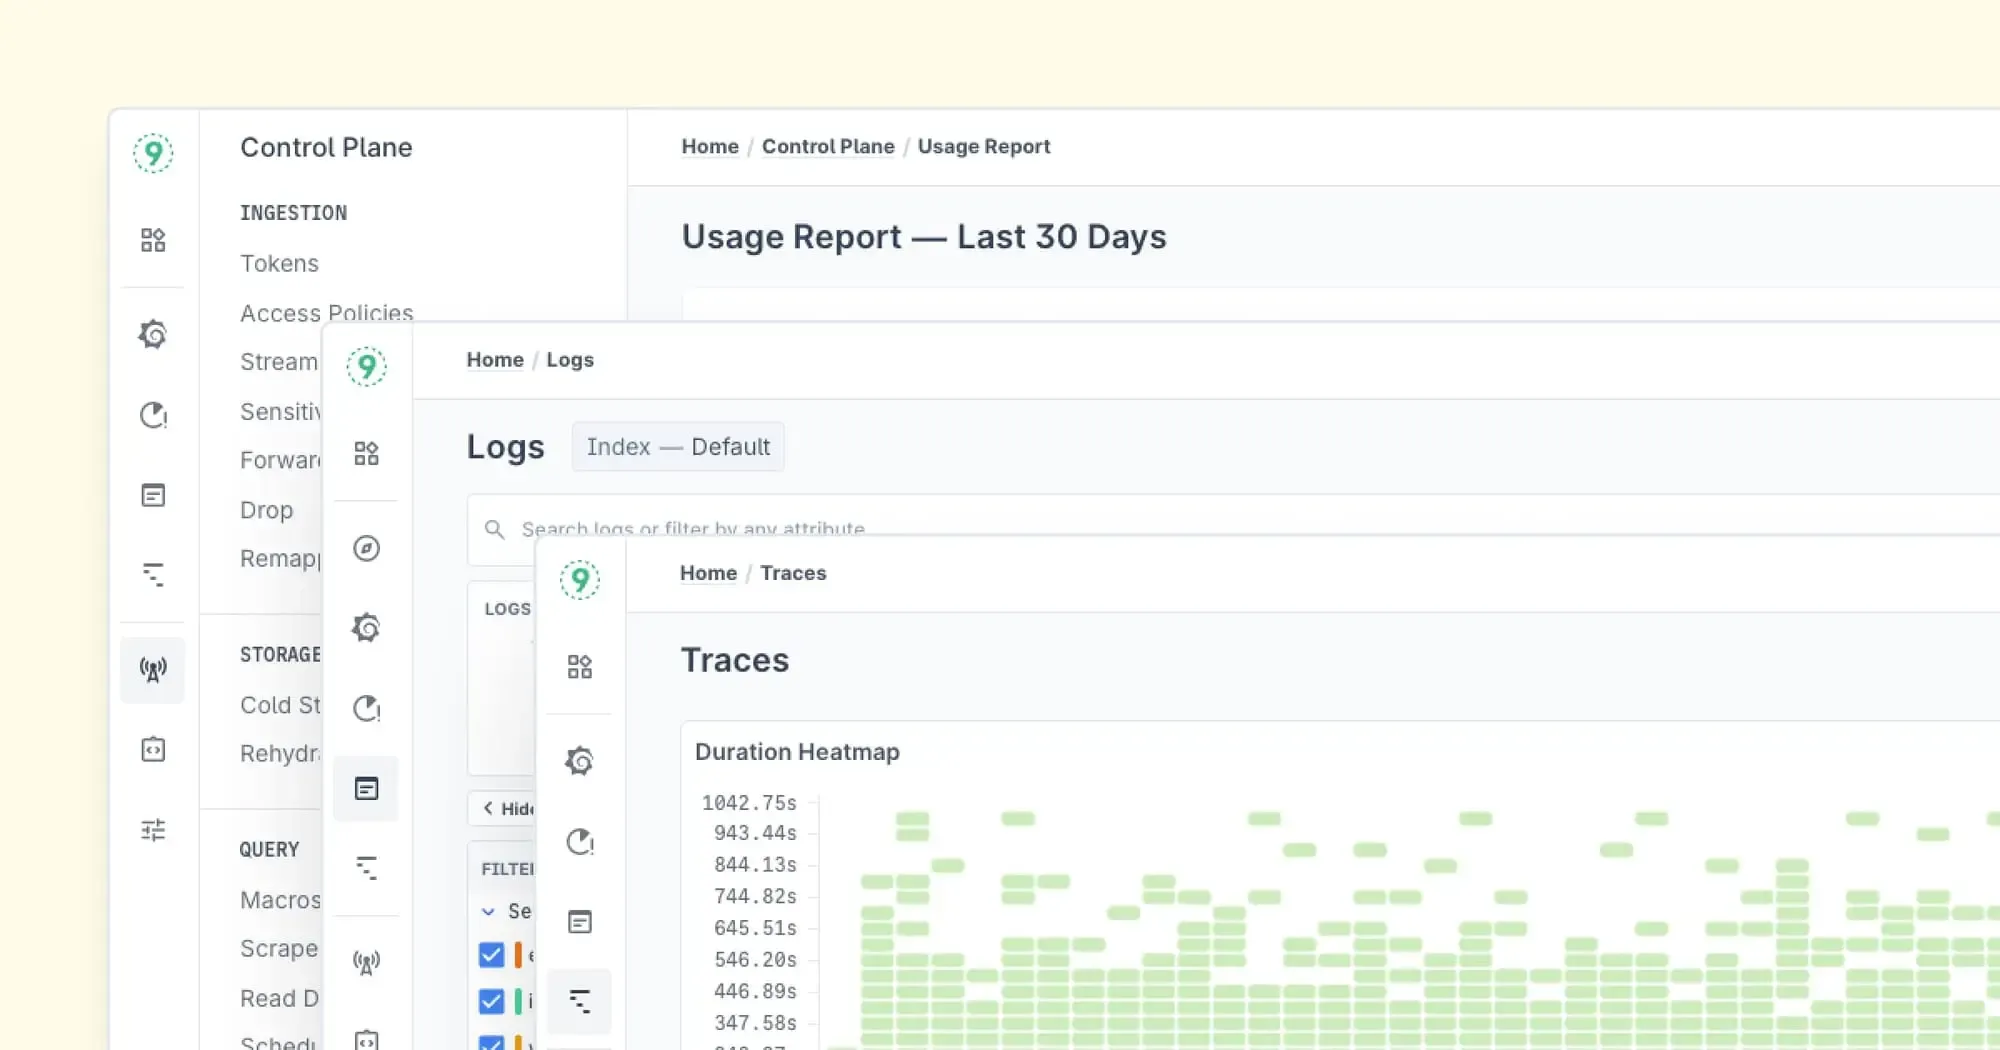
Tools like OpenTelemetry and Last9 provide the ability to collect, visualize, and analyze trace data, making it easier to understand and optimize how your system behaves at scale.
If you’re curious about how monolithic and microservices architectures stack up, take a look at our Monolithic vs. Microservices post for more insights.
How Requests Flow in a Distributed System
When a user makes a request—whether it’s loading a webpage, making a payment, or fetching data from an API—the request doesn’t just pass through a single server. In a microservices architecture, it moves through multiple services, databases, and external APIs before returning a response.
Without a way to track these requests end to end, debugging issues becomes guesswork. This is where distributed tracing comes in.
Traces:
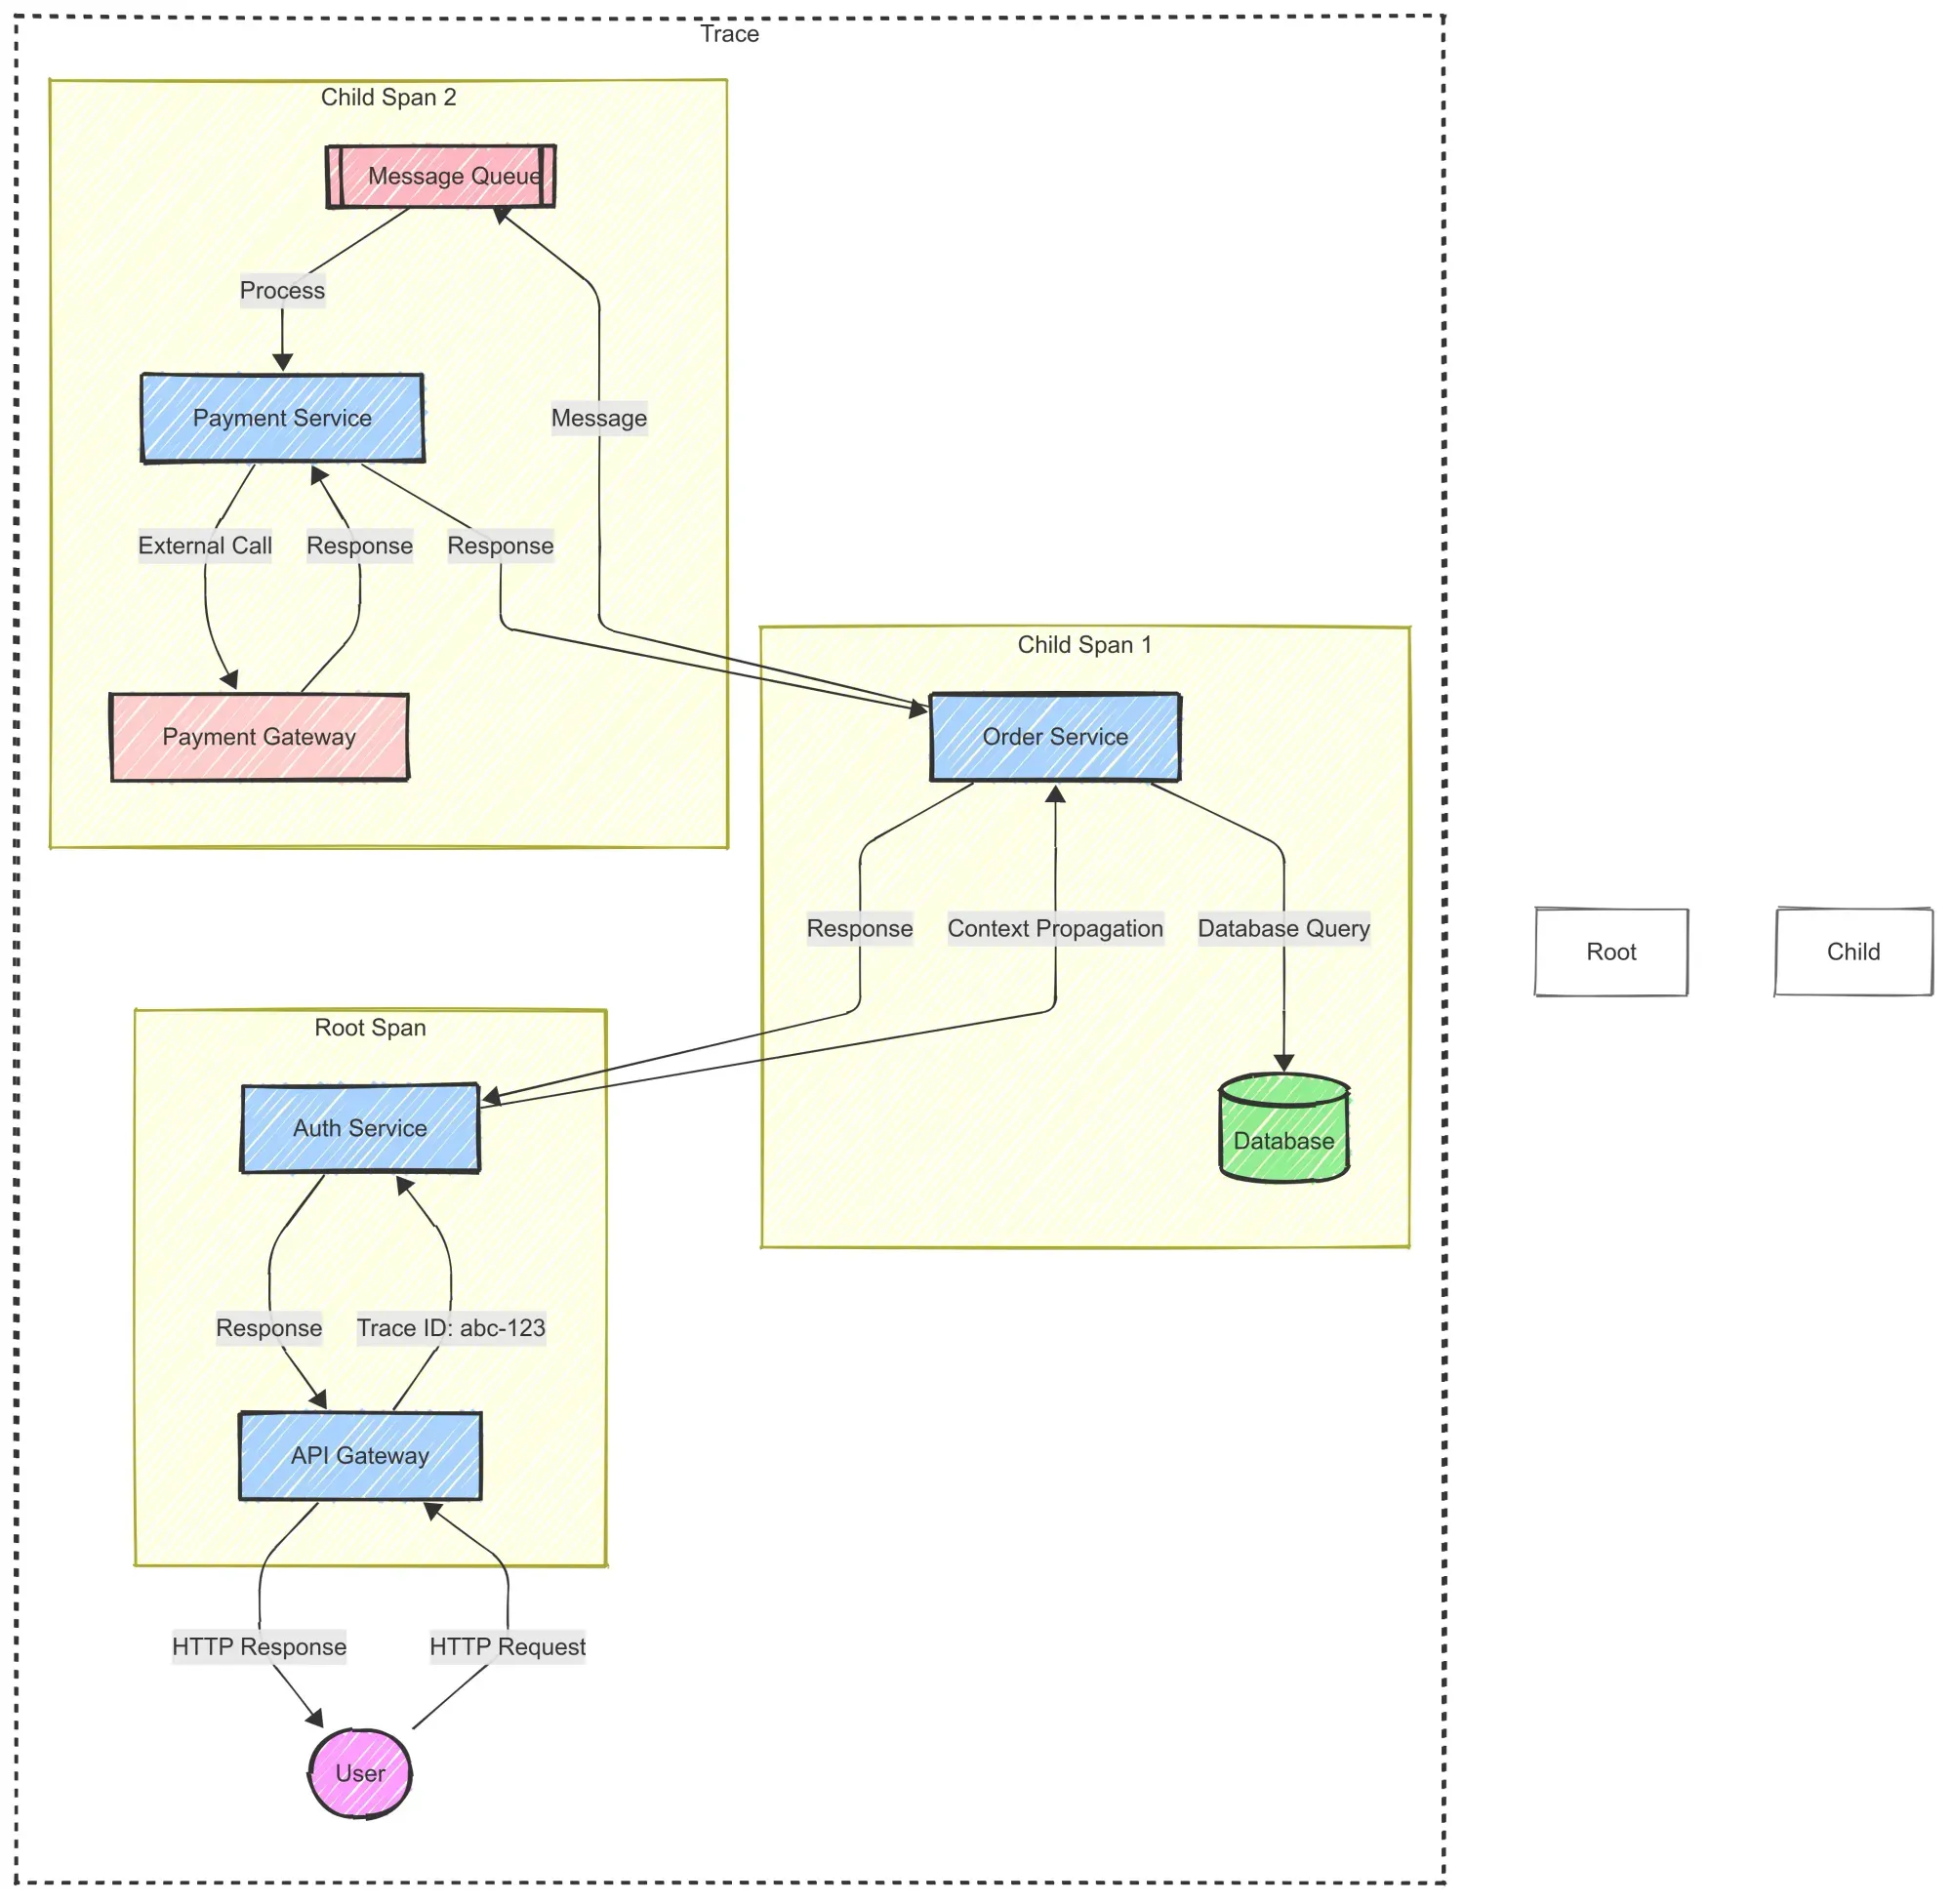
A trace represents the entire journey of a request across different services. Think of it like tracking a package as it moves through various shipping hubs before reaching its final destination. Each interaction along the way is recorded, helping engineers understand how the system processes a request.
Spans:
A span represents a single operation within a trace. It could be an API call, a database query, or a message queue interaction. Spans include metadata such as execution time, status, and any associated errors.
A trace consists of multiple spans linked together. The first span, known as the root span, represents where the request enters the system, while child spans capture subsequent operations.
Context Propagation:
For distributed tracing to work, trace context—containing the trace ID, span ID, and other metadata—must be passed along as the request moves through different services. This process, known as context propagation, ensures that all spans remain linked under a single trace.
Without context propagation, each service would generate its independent traces, making it difficult to piece together the full request flow. OpenTelemetry simplifies this by automatically injecting and extracting trace context across HTTP requests, gRPC calls, and messaging systems.
To learn more about the key pillars of observability—metrics, events, logs, and traces—check out our Understanding Metrics, Events, Logs, and Traces post.
Why Distributed Tracing Matters
As applications scale, debugging across multiple services becomes harder. Logs and metrics help, but they don’t show the full picture of a request’s path. This is where distributed tracing shines.
Tracing helps teams:
- Detect bottlenecks by showing where requests slow down.
- Debug issues faster by identifying failing services.
- Improve user experience by optimizing response times.
Without tracing, teams are blind to how microservices interact, making troubleshooting slow and inefficient.
5 Common Challenges of Distributed Tracing
While distributed tracing is powerful, implementing it at scale introduces several hurdles:
- High Data Volume – Every request generates trace data, leading to massive storage and processing demands.
- Performance Overhead – Collecting and exporting trace data can slow down applications if not optimized properly.
- Sampling Complexity – Capturing every request isn’t feasible, requiring smart sampling strategies to maintain visibility without overwhelming storage.
- Context Propagation Issues – Traces rely on passing context across services, but inconsistent implementations can break this flow.
- Correlation with Logs & Metrics – Tracing alone isn’t enough; it must integrate with logs and metrics to provide a complete picture.
How to Implement Distributed Tracing
Setting up distributed tracing requires three key steps: instrumentation, context propagation, and exporting traces to a backend like Last9, Jaeger, or Zipkin. Let’s walk through it.
1. Choose a Tracing Tool
To capture and analyze traces, you need a backend to store and visualize the data. Popular options include:
- OpenTelemetry – The open-source standard for collecting and exporting traces, logs, and metrics.
- Last9 – An OpenTelemetry-native observability platform built for scale, helping teams query, store, and analyze high-cardinality telemetry data.
- Jaeger / Zipkin – Open-source trace storage and visualization tools.
- AWS X-Ray / Google Cloud Trace – Managed tracing solutions by cloud providers.
For OpenTelemetry-native observability at scale, Last9 is a great choice, as it helps ingest, store, and analyze distributed traces efficiently.
If you’re looking to understand high cardinality in simpler terms, check out our High Cardinality for Dummies (ELI5) post.
2. Instrument Your Application with OpenTelemetry
Instrumentation is the process of adding tracing capabilities to your application. OpenTelemetry provides SDKs for various languages, including Python, Go, Java, and Node.js.
Example: Instrumenting a Python Flask App
Install OpenTelemetry dependencies:
pip install opentelemetry-sdk opentelemetry-exporter-otlpSet up tracing in your app:
from flask import Flaskfrom opentelemetry.sdk.trace import TracerProviderfrom opentelemetry.sdk.trace.export import BatchSpanProcessorfrom opentelemetry.exporter.otlp.proto.grpc.trace_exporter import OTLPSpanExporterfrom opentelemetry.trace import get_tracer_provider, set_tracer_provider
# Initialize OpenTelemetry Tracertrace_provider = TracerProvider()otlp_exporter = OTLPSpanExporter(endpoint="http://localhost:4317")  # Replace with Last9 OTLP endpointtrace_provider.add_span_processor(BatchSpanProcessor(otlp_exporter))set_tracer_provider(trace_provider)
tracer = get_tracer_provider().get_tracer(__name__)
app = Flask(__name__)
@app.route("/")def home():    with tracer.start_as_current_span("home-route"):        return "Hello, Tracing!"
if __name__ == "__main__":    app.run(debug=True)
What this does:
- Creates a tracer using OpenTelemetry.
- Sends traces to an OTLP endpoint (replace with Last9’s OTLP ingestion endpoint).
- Wraps a Flask route in a span so that requests are traced.
3. Ensure Proper Context Propagation
Tracing only works if the trace context (trace ID, span ID, baggage) is passed between services. OpenTelemetry provides automatic context propagation for popular protocols like HTTP and gRPC.
Example: Passing Trace Context Between Microservices (Python Requests Library)
import requestsfrom opentelemetry.trace.propagation.tracecontext import TraceContextTextMapPropagatorfrom opentelemetry.context import attach, detach
tracer = get_tracer_provider().get_tracer(__name__)
with tracer.start_as_current_span("client-request") as span:    headers = {}    TraceContextTextMapPropagator().inject(headers)  # Injects trace context into headers    response = requests.get("http://service-b:5000", headers=headers)
Why this matters:
- Ensures all microservices are aware of the same trace ID so traces don’t get fragmented.
4. Implement Smart Sampling
Tracing every request isn’t feasible for high-traffic applications. Instead, sampling strategies help control the volume of collected traces.
Types of Sampling:
- Head-based sampling (default) – Decides upfront whether to sample a request.
- Tail-based sampling (more accurate) – Decides after seeing the full request flow.
Example: Setting Head-Based Sampling in OpenTelemetry (Python)
from opentelemetry.sdk.trace.sampling import TraceIdRatioBased
# Sample only 10% of tracestrace_provider.sampler = TraceIdRatioBased(0.1)
Pro tip: For large-scale systems, tail-based sampling (supported by Last9) is a better approach, as it allows capturing only high-latency or error traces.
5. Export Traces to a Backend (e.g., Last9, Jaeger, Zipkin)
By default, traces remain in memory. You need an exporter to send them to a backend like Last9 for visualization.
Example: Sending Traces to Last9 using OpenTelemetry OTLP Exporter (Python)
from opentelemetry.exporter.otlp.proto.grpc.trace_exporter import OTLPSpanExporter
otlp_exporter = OTLPSpanExporter(endpoint="https://ingest.last9.io/v1/traces", insecure=False)trace_provider.add_span_processor(BatchSpanProcessor(otlp_exporter))
Why Last9?
- Otel-native – No vendor lock-in, full OpenTelemetry support.
- Scales effortlessly – Handles high-cardinality telemetry data without slowdowns.
- Unified observability – Correlates tracing with metrics and logs.
6. Correlate Tracing with Logs & Metrics
Traces alone aren’t enough. To get the full picture, you need to connect tracing with logs and metrics. OpenTelemetry provides libraries for this:
- Logs – Link logs to traces by including
trace_idin log statements. - Metrics – Use tracing data to detect performance bottlenecks.
Example: Adding Trace Context to Logs (Python + OpenTelemetry)
import loggingfrom opentelemetry.trace import get_current_span
logger = logging.getLogger(__name__)
def log_with_trace(message):    span = get_current_span()    trace_id = span.get_span_context().trace_id if span else "unknown"    logger.info(f"{message} | trace_id={trace_id}")
log_with_trace("Processing user request")
Why this helps:
- Lets you search logs by trace ID to debug faster.
- Enables correlation between traces, logs, and metrics for full observability.
Distributed Tracing Use Case: IoMT Blood Pressure Meter
Imagine a patient using a blood pressure (BP) meter within an Internet of Medical Things (IoMT) platform. The meter records blood pressure readings and sends an alert to the patient’s caregiver if the readings fall below a certain threshold. If the patient misses more than two readings, the system reminds them to take a new reading.
Here’s how the system works:
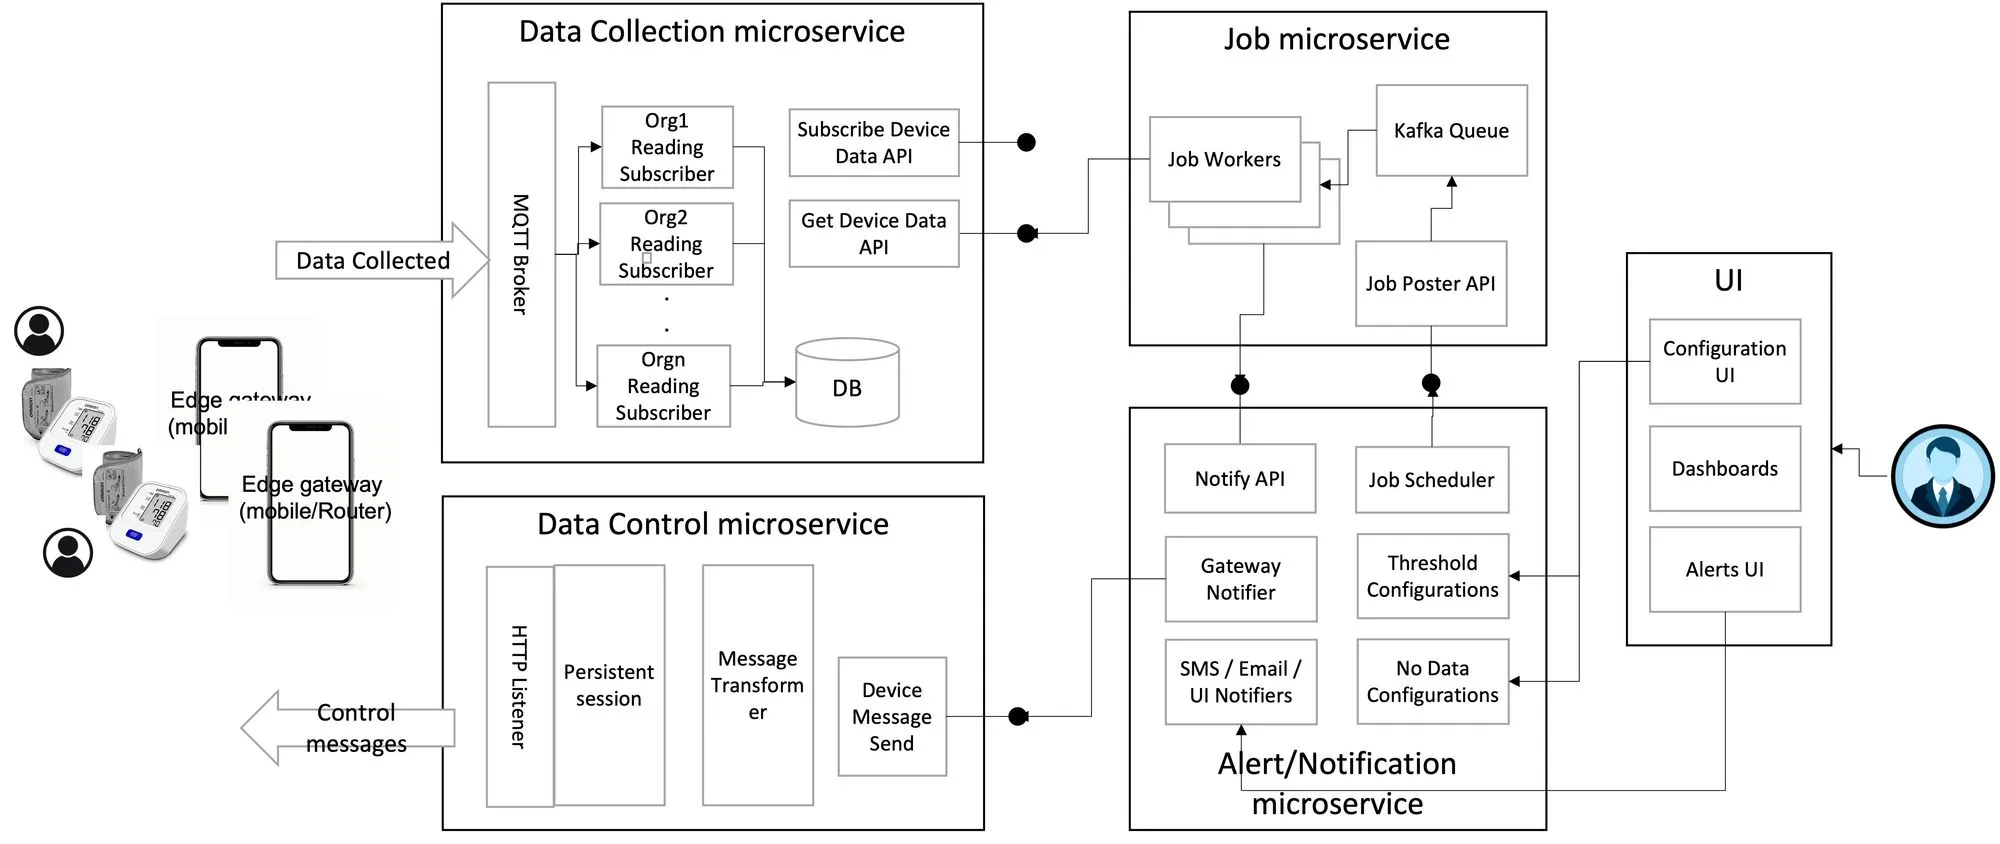
- Data Collection: The BP meter (along with other IoMT devices like thermometers or weighing scales) sends periodic readings to the cloud.
- Watchdog Service: A watchdog monitors the readings, checking for any that exceed the threshold. If a threshold is exceeded, it sends a notification to the caregiver. It also tracks missed readings and instructs the gateway to request a new reading from the patient.
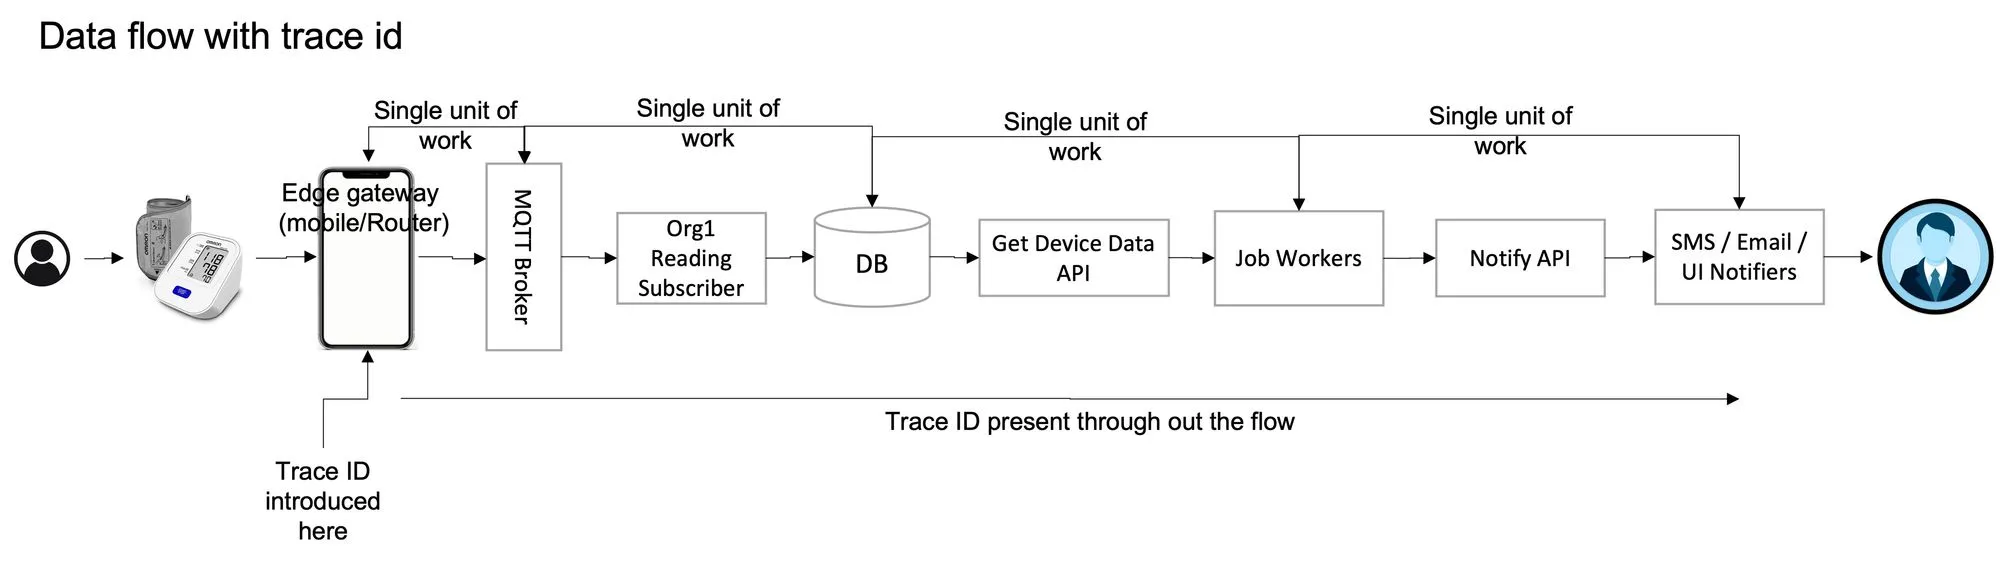
The flow of data in this system is as follows:
Device → Gateway → Data Collection Microservice → Job Microservice → Notification Microservice
In this setup, distributed tracing helps track the request from the device to the final notification, providing visibility into each step and pinpointing any issues along the way.
In this system, the data from the sensor (such as a BP meter, thermometer, and weighing scale) that needs to be collected and sent to the caretaker passes from:
The device to the gateway — to the data collection microservice — to the job microservice — to the notification microservice.
Root Cause Analysis Difficulties
Even in a simplified version of the IoMT use case, troubleshooting issues in a microservices architecture can be a daunting task.
For example, if a notification isn’t sent when a patient’s blood pressure falls below the threshold, determining where the problem occurred is far from straightforward.
The issue could arise from any point along the data pipeline:
- The device could have failed to send the data.
- The gateway might not have forwarded it properly.
- The cloud service could have encountered an error in processing.
- The notification system may have failed to trigger the alert.
To debug this problem, you’d need to trace the data flow across all these components—from the device to the notification system.
If you’re trying to figure out whether OpenTelemetry or Jaeger is the better fit for your needs, take a look at our OpenTelemetry vs. Jaeger: Which Should You Pick? post for a breakdown of the differences.
Manual Debugging: A Complex Approach
Tracing the issue manually by relying on logs is one of the most challenging ways to troubleshoot.
Here’s why:
- Logs from multiple services (gateway, cloud, notification system) must be collected and analyzed.
- These logs are often stored in systems like Elasticsearch and OpenSearch, and you can search by timestamps and patient IDs to match logs from different sources.
- However, without distributed tracing, it’s nearly impossible to correlate the logs efficiently and trace the flow of the problematic data across services.
The root cause could lie in one of many steps in the asynchronous, distributed process, making it difficult to pinpoint the issue using logs alone. Distributed tracing makes this much easier by providing a single trace that connects all services involved, letting you track exactly where the breakdown occurred.
Using Distributed Tracing to Find the Problem
To troubleshoot the missing notification, we need to connect the log entries from various systems. This is done using trace IDs.
When the data is first collected from the BP meter, a trace ID is created at the gateway. This trace ID follows the data through the system—across the database, job microservice, and notification microservice.
By searching for the trace ID, we can track the data flow and pinpoint where the breakdown happened. For example, we can start by looking up the trace ID in the database for BP values exceeding the threshold and trace the flow backward to the gateway or forward to the notification service. This simplifies the troubleshooting process.
Anatomy of a Trace
A trace consists of multiple spans, each representing a unit of work, with metadata such as:
- The API call made
- The time taken for the call
- The start and end time of execution
These spans are linked by the trace ID, which allows us to follow the data across microservices.
Benefits of Distributed Tracing
Distributed tracing provides several advantages over traditional logging:
- Faster detection and response: It provides visibility across your system, reducing Mean Time to Detect (MTTD) and Mean Time to Respond (MTTR).
- Performance insights: It highlights which services are slow, helping to optimize performance.
- Improved SLAs: Support teams can track the request flow and respond faster to issues.
- Proactive troubleshooting: With full visibility, support teams can resolve issues before they impact users.
3 Implementation Challenges of Distributed Tracing
1. Instrumentation: Manual vs. Auto
The first challenge is deciding how to implement tracing. There are two main approaches:
- Manual Instrumentation: This requires coding to manually record activities and events. It offers complete control over what gets traced but increases development time and complexity.
- Auto-Instrumentation: This reduces coding requirements by automatically recording trace data, but it comes with trade-offs. It may capture too much detail (recording every API call) or not enough (only capturing entry/exit points). OpenTelemetry is one example of a tool that offers auto-instrumentation, but it still requires careful tuning to ensure the right level of detail.
2. Data Volume and Storage Costs
The second challenge arises from the sheer volume of data that can be generated by distributed tracing. SaaS applications typically handle high volumes of transactions, and introducing a trace ID for each transaction can lead to an exponential increase in data.
This surge in data comes with storage costs. While distributed tracing can improve MTTD and MTTR, the cost of storing this data can be high.
Tracing all transactions may only be justified if the system has frequent issues, as the business needs to ensure that problems are identified quickly. However, if everything is running smoothly, tracing may not be necessary for every transaction.
3. Optimizing Data Collection
To optimize storage and reduce costs, it’s important to selectively collect trace data. This can be done through:
- Head-Based Decision: A decision made at the start of the transaction to determine if it should be traced. This allows you to target critical transactions, but if an issue occurs in a non-critical transaction, no trace data will be available.
- Tail-Based Decision: A decision made at the end of the transaction, where trace data is collected only if a problem is detected. This offers better visibility for problem transactions but requires more computation to identify issues.
Conclusion
As we’ve seen, distributed tracing offers valuable insights but comes with its own set of challenges. It’s a key part of the observability toolkit, but it’s most effective when combined with a solid foundation of infrastructure and application metrics.
Last9 is a great place to kick off your observability journey. Trusted by companies like Disney+ Hotstar, Games24x7, CleverTap, and Replit, we help you optimize cloud-native monitoring with the right balance of performance, cost, and user experience.
We integrate smoothly with OpenTelemetry, Prometheus, and more, bringing together metrics, logs, and traces while efficiently managing high-cardinality data. With smart alerting and real-time metrics, Last9 gives your team the insights needed to stay on top of observability and operational intelligence.
Talk to us here to know more, or if you’d like to explore on your own, start for free!

