

PHP powers a large swath of the web - from blogs to storefronts to APIs. But with microservices, third-party dependencies, and scaling complexity, performance can slip in subtle ways. Your app might mostly work, but small-noted delays, occasional spikes, or hidden bottlenecks build up.
An APM tool helps you see inside the black box: which functions are slow, which DB queries are hogging time, which external calls are failing or stalling. It doesn’t just alert you-it gives you context so you can act.
We’ve picked PHP APM tools that give you the right trade-off - deep performance data without runaway costs.
Why APM is Crucial for PHP Applications
Performance issues in PHP apps are often subtle. A request that feels fast in staging can turn into a slow query chain in production once traffic scales. Sometimes it’s a blocking API call; other times, it’s an unindexed query or a cache miss. Without proper visibility, it’s hard to tell what’s really happening between code, database, and infrastructure.
APM tools give that visibility. They instrument your PHP runtime, frameworks, and external calls - showing how each request moves through the stack and where time is spent. You get transaction-level data that ties together metrics, traces, and logs for clear cause-and-effect.
Take a high-traffic Laravel app. If checkout requests start timing out, APM traces show whether latency builds up in the application layer, database, or an upstream dependency. Instead of tuning components with assumptions, you can see exactly where performance drops off.
APM tools help you:
- Catch performance drift early: Monitor critical routes and jobs for rising latency or error rates.
- Shorten debugging loops: Use correlated traces and logs to identify bottlenecks faster.
- Use resources efficiently: Find endpoints consuming more CPU, memory, or DB connections than expected.
- Improve reliability: Track p95/p99 response times and set SLOs around real user behavior.
- Make scaling predictable: Use data to guide caching, query optimization, and autoscaling strategies.
To understand which metrics actually matter once you start using an APM tool, check out Key APM Metrics You Must Track.
Top 15 PHP APM Tools for 2025
PHP APM tools differ in how they collect, store, and visualize telemetry. Some emphasize OpenTelemetry compatibility, others focus on built-in profiling or infrastructure metrics. The key is to understand what each one offers and how it fits your application’s performance needs.
This list brings together tools that PHP teams can rely on in 2025 - from open observability platforms to enterprise-grade monitoring systems - highlighting their capabilities, trade-offs, and where they make the most sense.
1. Last9
We designed Last9 around OpenTelemetry from the start. Every signal-metrics, traces, and logs-flows through open, vendor-neutral standards. For PHP teams, this means you can instrument once using the OpenTelemetry PHP SDK or auto-instrumentation and send that data directly to us through OTLP, without wrapping code in custom APIs.
Our platform is built to handle high-cardinality telemetry at scale. You can filter metrics by dimensions like endpoint, tenant_id, or region-even when those values run into the millions. Queries stay fast because we process data through streaming aggregation, pre-computing metrics as spans arrive instead of running heavy queries later.
Here’s what that means for engineering teams:
- OpenTelemetry-native pipeline: We ingest data as-is from any OTel SDK, Collector, or sidecar-no format loss or translation layers.
- Streaming Aggregations: You can turn traces into metrics on the fly-for instance, generate a
checkout_latencymetric directly from trace data. - Cardinality controls: Set budgets, drop rules, or forward policies to prevent metric explosion before it affects storage or query performance.
- SLO management: Define and monitor SLOs from the same dataset you use for traces and metrics.
- Transparent cost model: Costs align with telemetry volume, so scaling instrumentation doesn’t bring hidden surprises.
We built this for teams running PHP workloads that generate dense telemetry-multi-tenant apps, large e-commerce systems, or distributed services where every request carries meaningful attributes.
Pricing starts with a free tier (100M events/month) and a Pro plan at $850/month, scaling with usage.
2. Blackfire
Blackfire is built specifically for PHP profiling and performance testing. It gives developers detailed visibility into code execution, memory usage, and I/O behavior, making it easier to locate inefficient functions or resource-heavy routines.
Unlike general-purpose APM tools, Blackfire focuses on code-level insights. It instruments function calls, measures execution time, and generates detailed flame graphs that highlight where performance issues originate. This makes it ideal for identifying costly loops, redundant calls, or blocking I/O within PHP applications.
It integrates smoothly with CI/CD pipelines, enabling continuous performance validation. Developers can run automated profiling jobs, compare results across commits, and prevent regressions before code is deployed.
Key capabilities
- Granular profiling: Measure CPU, memory, and I/O usage per function or route.
- Continuous testing: Automate profiling in build and deploy workflows.
- Comparative analysis: Track performance deltas between versions or branches.
- Flexible deployment: Supports local, staging, and production environments.
Pricing
Blackfire offers a free tier for basic profiling in development environments.
Paid plans start at $39 per month per user (Profiler) and go up to $159 per month per user (Premium), which includes advanced features such as automated test scenarios, CI integration, and organization-level dashboards.
Blackfire works best for teams focused on application-level optimization - developers who need deep profiling visibility before scaling or tuning infrastructure.
3. Sentry
Sentry started as an error monitoring tool but has grown into a capable APM solution. It tracks application performance, highlights slow transactions, and ties them directly to user sessions. This makes it easier for developers to see not just that something is slow, but who it affects and under what conditions.
For PHP teams, Sentry provides a unified view of errors, traces, and performance metrics in one place. It helps identify underperforming endpoints, inefficient database queries, or heavy external API calls - all correlated with stack traces and request details.
Sentry’s real strength lies in context. When a slowdown occurs, developers can see the trace, the error, and the user impact side by side - helping prioritize what needs fixing first.
Key capabilities
- Transaction tracing: Track request latency, database queries, and external calls across your PHP stack.
- Error correlation: Link performance issues directly with the errors causing them.
- User impact visibility: Understand which slowdowns affect which users or sessions.
- Flexible setup: Works with Laravel, Symfony, and other popular PHP frameworks through official SDKs.
Pricing
Sentry offers a free plan for small projects with limited event volume.
Paid plans start at $26 per month and scale based on the number of transactions and error events processed. Usage-based pricing means teams can start small and expand as traffic grows.
Sentry is best suited for teams that want to connect performance data with real user impact - blending traditional error monitoring with modern APM visibility.
Learn how request tracing connects services and pinpoints bottlenecks in What Is APM Tracing.
4. Scouter
Scouter is an open-source APM tool originally built for Java but extendable to other languages, including PHP, through its agent-based architecture. It focuses on real-time monitoring of application performance, system resource usage, and user transactions - giving you visibility without relying on commercial vendors.
For PHP applications, you can use Scouter to collect transaction traces, track request latency, and visualize how services interact. Its dependency maps help you see relationships between components in a distributed setup. The dashboard shows active sessions, request throughput, and response times, making it easier to spot performance anomalies as they occur.
Setup takes more effort than most hosted tools, but if you prefer full control over your monitoring stack, Scouter gives you that flexibility.
Key capabilities
- Real-time monitoring: Continuously track transactions, requests, and resource metrics.
- Service dependency mapping: Visualize how your PHP services connect and interact.
- Custom agent support: Extend data collection using community or self-built agents.
- Fully open source: Modify, host, and scale it on your own terms.
Pricing
Scouter is free and open source under the Apache 2.0 license. The only costs are the infrastructure and time needed to deploy and maintain it - the collector, storage, and UI components all run within your environment.
If you want a self-hosted APM solution that gives you real-time visibility and full ownership of your telemetry data, Scouter is a solid choice.
5. Zend Z-Ray
Zend Z-Ray gives you real-time visibility into what’s happening inside your PHP application while you develop or test it. Instead of jumping between logs and dashboards, Z-Ray overlays detailed performance data - queries, function calls, errors, and execution time - right in your browser.
It’s part of the Zend Server suite and is especially useful during local development or QA cycles. You can see exactly which SQL queries ran for a specific request, how long each took, and what function or file triggered them. This in-context feedback helps you fix performance issues and inefficient code paths before they ever reach production.
Because it’s integrated directly into the PHP runtime, Z-Ray offers accurate insights without the noise that comes from sampling or post-processing. It’s not a full-scale APM for distributed systems, but as a developer-focused performance companion, it’s incredibly effective.
Key capabilities
- Browser-based feedback: View performance metrics directly in your browser during development.
- Detailed execution insight: Track functions, queries, and errors for each PHP request.
- Instant profiling: Measure execution time and memory usage in real time.
- Zend Server integration: Works natively with Zend Server for deeper diagnostics and deployment features.
Pricing
Zend Z-Ray comes bundled with Zend Server, which offers a free trial and paid plans starting around $240 per year per server for commercial use. The full suite includes Z-Ray, application monitoring, caching tools, and deployment automation.
If you want to debug and optimize PHP code as you write it, Zend Z-Ray is one of the most efficient tools you can add to your local or staging environment.
6. Sematext
Sematext APM gives you end-to-end visibility into your PHP applications, combining metrics, traces, logs, and infrastructure data in one managed platform. It’s built around OpenTelemetry support, so you can instrument your PHP services once and send telemetry without using a proprietary agent.
Once your PHP app starts sending traces, you can view request latency, throughput, and error rates in real time. Sematext links trace data with host metrics and logs, so you can immediately see if performance issues come from application code or underlying infrastructure.
The platform also includes alerting, anomaly detection, and SLO tracking, making it easier to spot performance regressions early and correlate them with deployments or configuration changes.
Key capabilities
- OpenTelemetry-based ingestion: Works seamlessly with PHP OTel SDKs and collectors.
- Full-stack observability: Correlate application traces with logs, infrastructure, and uptime data.
- Distributed tracing: Track latency across services, external APIs, and database calls.
- Smart alerting: Set thresholds for latency, throughput, or error budgets.
- Managed dashboards: No backend setup or storage maintenance needed.
Pricing
Sematext APM offers a 30-day free trial. Paid plans start at $2 per host per hour or $89 per month per agent, depending on your environment size and retention.
If you’re looking for a managed, OpenTelemetry-compatible APM for PHP that integrates tracing, logging, and infrastructure metrics without the operational overhead, Sematext APM is a solid option.
See how APM principles translate across languages in Python APM: Monitoring & Performance.
7. MiniProfiler (Stackify)
MiniProfiler is a lightweight profiling tool that helps you understand where your PHP application spends time during each request. It captures execution times for database queries, external HTTP calls, and code segments, giving you a clear view of how efficiently your app handles each transaction.
On its own, MiniProfiler is great for local debugging and development profiling - a quick way to see if a page is slow because of a specific query or a function. When you integrate it with Stackify Retrace, you get full APM-level visibility, including error tracking, logs, and distributed traces. This combination makes it easier to connect low-level performance metrics with application-wide behavior.
MiniProfiler’s simplicity is its strength. You don’t need a heavy agent or complex setup - just instrument your PHP code and view results directly in your browser or app.
Key capabilities
- Lightweight profiling: Measure execution time for functions, database queries, and API calls.
- In-browser performance view: See detailed timings for each request in real time.
- Retrace integration: Combine profiling data with error tracking and APM metrics.
- Minimal overhead: Designed for development and staging use without performance penalties.
Pricing
MiniProfiler itself is free and open source, licensed under Apache 2.0.
If you choose to integrate it with Stackify Retrace, plans start at around $79 per month per server, which adds log management, tracing, and deeper monitoring capabilities.
If you want a simple, transparent way to profile PHP applications and optionally connect them to a broader APM platform, MiniProfiler gives you that flexibility.
8. Pinpoint
Pinpoint is an open-source APM tool built for monitoring large, distributed systems. Originally designed for Java, it now supports PHP, along with several other runtimes, through agent-based instrumentation. It’s a strong choice if you’re running a microservices architecture and need to understand how transactions flow across multiple services.
Once installed, Pinpoint automatically traces requests end-to-end, mapping every service call, external dependency, and database query involved in a transaction. You can visualize your entire system’s topology, see latency between services, and drill down into detailed call stacks for performance bottlenecks.
Because it’s designed for scale, Pinpoint uses a collector-based model where agents send data to dedicated backends - keeping overhead low even in high-throughput environments. The UI provides both high-level overviews and granular trace views, making it useful for both operations and development teams.
Key capabilities
- Distributed tracing: Follow transactions across multiple PHP services and dependencies.
- Service topology maps: Visualize interactions between services in real time.
- Detailed call stacks: Identify slow methods, APIs, or external integrations.
- Scalable architecture: Collector-based design suited for large deployments.
- Multi-language support: Works with PHP, Java, Python, Node.js, and more.
Pricing
Pinpoint is free and open source, released under the Apache 2.0 license. You’ll need to manage your own infrastructure for the collector, storage, and web UI components, which can increase operational effort compared to hosted tools.
If you’re managing distributed PHP services and want to trace requests across boundaries without vendor lock-in, Pinpoint gives you that flexibility with full control over your telemetry data.
Check out how logs complement traces and speed up debugging in APM Logs for Faster Debugging.
9. Performance Co-Pilot (PCP)
Performance Co-Pilot (PCP) is an open-source performance monitoring toolkit designed for collecting and analyzing metrics across entire systems - from operating system resources to application-level data. While it isn’t a traditional APM built specifically for PHP, you can use it to gain deep visibility into the infrastructure that supports your PHP applications.
PCP excels at high-resolution performance analysis. It gathers data from CPUs, memory, disk I/O, network interfaces, containers, and even application runtimes if properly instrumented. With the right setup, you can integrate PHP-level metrics through exporters or custom agents, then visualize everything through Grafana or PCP’s native dashboards.
It’s particularly useful when you want to understand how your PHP application interacts with the underlying system - for example, when latency stems from I/O contention, process scheduling, or system-level resource exhaustion.
Key capabilities
- System-wide monitoring: Track OS, network, and application performance metrics together.
- Extensible architecture: Add PHP or web server instrumentation using plugins or PMDAs (Performance Metrics Domain Agents).
- Time-series storage: Store high-frequency data for historical and comparative analysis.
- Grafana integration: Visualize metrics alongside other observability data sources.
- Lightweight collectors: Low overhead even when monitoring large infrastructures.
Pricing
PCP is free and open source, available under the LGPL license. The main investment lies in setup and integration - configuring PMDAs, exporters, and dashboards for PHP-specific insights.
If you want low-level control over performance telemetry and prefer building your own monitoring pipeline instead of relying on managed APMs, PCP gives you the tools to do it.
10. Datadog APM
Datadog APM gives you end-to-end visibility into how your PHP applications perform across services and infrastructure. Once you install the Datadog PHP tracer, you can follow each request from the web layer through databases, caches, queues, and external APIs - helping you see exactly where latency or errors originate.
Datadog’s strength lies in its distributed tracing and how seamlessly it connects APM data with logs, metrics, and infrastructure monitoring. You can visualize trace waterfalls, check database query timings, and set up alerts based on latency or error rate thresholds. Its out-of-the-box integrations with frameworks like Laravel and Symfony make it easy to start capturing detailed traces without extensive manual setup.
Custom dashboards and advanced filtering let you zoom out to view system-wide performance or zoom in to specific endpoints, hosts, or tags. You can also correlate traces with container metrics, CI/CD events, and even frontend RUM data for a complete view of request flow.
Key capabilities
- Distributed tracing: Trace PHP requests across services, APIs, and infrastructure layers.
- Error and latency tracking: Measure performance using real-time spans and trace data.
- Framework integrations: Native support for Laravel, Symfony, and Slim.
- Custom dashboards and alerts: Build SLO-based alerts and team-specific performance views.
- Unified telemetry: Correlate APM traces with logs, metrics, and network data.
Pricing
Datadog APM offers a 14-day free trial. Paid plans start at $31 per host per month for APM and distributed tracing. Additional costs apply for log ingestion, RUM, and advanced analytics, depending on data volume.
If you want a managed, all-in-one observability platform with strong PHP tracing support and integrations across your stack, Datadog APM remains one of the most comprehensive options.
Understand how to monitor cron tasks, queue workers, and async pipelines in Background Job Observability.
11. Stagemonitor
Stagemonitor is an open-source APM tool originally built for Java, but you can extend it to PHP with some custom instrumentation. It’s particularly good at combining real user monitoring (RUM) with backend request tracing, giving you a complete view of how your application performs - from the user’s browser to your backend services.
In PHP environments, Stagemonitor can be configured to collect key metrics like request latency, database query duration, and error rates. You can also capture frontend metrics such as page load times, DOM processing, and network latency, which helps you understand the full impact of backend performance on user experience.
Because it’s self-hosted, you’ll need to handle configuration and integration yourself, but that also means you retain full control over data and storage. For smaller teams or developers experimenting with RUM and tracing together, Stagemonitor offers a flexible way to bridge both sides of performance monitoring.
Key capabilities
- Real user monitoring: Track page load times, rendering delays, and frontend performance metrics.
- Distributed tracing: Trace transactions across backend services with detailed latency breakdowns.
- Custom instrumentation: Extend support for PHP through community agents or custom code.
- Self-hosted flexibility: Deploy and manage your own storage and dashboards.
- Combined visibility: Connect frontend experience with backend performance data.
Pricing
Stagemonitor is free and open source, licensed under the Apache 2.0 license. The main cost is operational - maintaining storage, configuring collectors, and instrumenting PHP applications for full trace coverage.
If you want a self-managed APM solution that brings together real user metrics and backend traces, Stagemonitor gives you the building blocks to do it your way.
12. AppSignal
AppSignal is a managed APM and error tracking platform that supports PHP, Ruby, Elixir, Node.js, and other runtimes. It’s designed for teams that want a hosted APM solution with minimal setup effort and predictable pricing.
Once you install the PHP agent, AppSignal automatically instruments frameworks like Laravel, Symfony, and Slim to capture transaction traces, database queries, and external HTTP calls. You get a clean dashboard showing response times, throughput, error rates, and memory usage. Each trace links directly to the corresponding error, log, or user session, so you can see how issues affect real users.
AppSignal also provides host metrics and custom instrumentation, letting you track queue latency, cache performance, or specific function execution times. The UI emphasizes clarity - graphs are simple to read, with minimal configuration required.
Key capabilities
- Automatic instrumentation: Native PHP support for Laravel, Symfony, Slim, and custom frameworks.
- Error and trace correlation: Connect slow traces directly with related errors or exceptions.
- Custom metrics: Send your own performance data alongside built-in APM metrics.
- Team dashboards and alerts: Set thresholds for latency, error rates, and Apdex scores.
- Managed service: Hosted and maintained by AppSignal - no infrastructure management needed.
Pricing
AppSignal offers a 30-day free trial. Paid plans start at $19 per month, scaling with data volume and retention. Pricing is straightforward and includes APM, error tracking, and host metrics under one plan.
If you want a simple, hosted APM solution for PHP that’s easy to maintain and doesn’t require a large setup, AppSignal is a great middle ground between open-source tools and enterprise platforms.
See how Kubernetes service routing and discovery tie into observability in Kubernetes Service Discovery.
13. Raygun APM
Raygun APM is a managed performance monitoring solution that focuses on application speed, error tracking, and user experience. While it’s not as widely used as Datadog or New Relic, it offers solid support for PHP through its lightweight agent and clear visualizations that help you pinpoint slow transactions.
With Raygun APM, you can trace requests end-to-end, see where time is spent inside your application, and identify slow database queries or external calls. It also links each trace to specific users and errors, so you can quickly tell which issues have the biggest impact on your customers.
The dashboard design is one of Raygun’s strengths - fast, clean, and built around actionable data rather than endless graphs. You can filter by endpoint, environment, or deployment version to find regressions introduced in specific releases.
Key capabilities
- Transaction tracing: Follow PHP requests through code, queries, and external dependencies.
- Error correlation: Connect performance bottlenecks directly with runtime errors.
- Deployment tracking: Measure how each new release affects latency and stability.
- Custom metrics: Define and visualize your own metrics alongside built-in telemetry.
- User impact analysis: Prioritize fixes based on who is affected and how often.
Pricing
Raygun APM offers a 14-day free trial. Paid plans start at $8 per 10,000 traces per month, with additional charges for error tracking and real user monitoring.
If you’re looking for a managed APM that’s simple to deploy and gives clear visibility into PHP performance, Raygun APM strikes a good balance between capability and ease of use.
14. Site24x7 APM Insight
Site24x7 APM Insight is a managed APM platform from Zoho, built to monitor web applications across languages, including PHP, Java, .NET, and Node.js. It’s designed for teams that want full-stack visibility - from application performance and infrastructure metrics to end-user experience - without running their own monitoring backend.
Once you install the PHP agent, APM Insight starts tracking transactions, database queries, external calls, and memory usage in real time. Each transaction trace breaks down execution paths so you can identify which function, query, or third-party dependency is adding latency.
You can view response times, throughput, and error rates across your PHP services, correlate them with infrastructure metrics, and set up alerts for performance anomalies. Site24x7 also includes synthetic monitoring and RUM (Real User Monitoring), giving you visibility into how real users experience your application.
Key capabilities
- Full-stack visibility: Monitor PHP apps, servers, and external services in one place.
- Detailed transaction traces: Identify slow requests, database queries, and external APIs.
- Error analytics: Pinpoint exceptions and stack traces tied to performance drops.
- User experience monitoring: Combine APM data with RUM and synthetic checks.
- Managed service: Fully hosted solution with dashboards, alerting, and integrations.
Pricing
Site24x7 APM Insight offers a 30-day free trial. Paid plans start at $35 per month per host, including application, server, and infrastructure monitoring. Additional tiers include RUM and log analytics for broader observability.
If you’re looking for a managed PHP APM that integrates backend metrics with real user data, Site24x7 APM Insight provides strong coverage without the setup complexity of larger enterprise platforms.
15. Atatus
Atatus is a fully managed APM and observability platform that supports PHP, Node.js, Python, Java, and several other languages. It gives you complete visibility into how your PHP applications perform - from slow transactions and database queries to frontend user experience.
Once you install the PHP agent, Atatus automatically starts capturing traces, errors, and performance metrics. You can see transaction-level breakdowns, pinpoint slow database queries or external API calls, and set up alerts based on response times or error rates.
Atatus also includes Real User Monitoring (RUM) and infrastructure monitoring, so you can connect backend performance with actual user experience. The UI is straightforward, with timeline-based views and clear trace waterfalls that make debugging performance issues quick and intuitive.
Key capabilities
- Full-stack observability: APM, logs, RUM, and infrastructure metrics in one place.
- Automatic instrumentation: Works with popular PHP frameworks like Laravel, Symfony, and CodeIgniter.
- Error tracking and alerting: Get notified when exceptions or latency exceed thresholds.
- Custom dashboards: Build views tailored to your services and SLOs.
- Managed platform: No infrastructure setup or maintenance required.
Pricing
Atatus offers a 14-day free trial. Paid plans start at $24 per host per month for APM, with higher tiers including logs and infrastructure monitoring.
If you’re looking for a managed APM platform for PHP that combines performance, error, and user monitoring in one clean interface, Atatus is a practical alternative to the big observability vendors.
Understand how to track tasks outside web requests with detailed insight from What Is Asynchronous Job Monitoring.
How to Evaluate PHP APM Tools That Work for You
PHP systems have their own challenges: blocking I/O, database-heavy workloads, and frameworks that abstract too much until something breaks.
Here’s how to evaluate tools based on how they behave under load:
1. Real-Time Monitoring and Alerting
The value of monitoring comes down to how quickly you can detect and confirm an issue. Look for tools that stream metrics and traces in near real time - ideally, sub-minute intervals.
You’ll want:
- Granular alert conditions (e.g., 95th percentile latency per endpoint, not global averages).
- Event correlation between alerts, traces, and logs - so you know why an alert fired, not just that it did.
- Webhook integrations for systems like Slack, PagerDuty, or Opsgenie that don’t rely on polling dashboards.
If your APM sends alerts every 5 minutes, it’s already too late.
2. Distributed Tracing That’s Actually Traceable
For PHP microservices, tracing should follow a single request across databases, caches, APIs, and background workers.
Check whether the tool:
- Supports W3C Trace Context or OpenTelemetry - anything else locks you in.
- Captures spans automatically for frameworks (Laravel, Symfony) and common libraries (PDO, Guzzle, Redis).
- Let’s you view latency breakdowns per span and add custom attributes (e.g.,
customer_id,order_id) for correlation.
If traces get sampled too aggressively or can’t cross service boundaries, you’ll lose the context that matters.
3. Code-Level Profiling
A good APM doesn’t just tell you a request was slow - it shows you which function caused it.
Look for:
- Function- or line-level timing data (similar to Xdebug but production-safe).
- CPU and memory profiling per transaction.
- Low instrumentation overhead, especially for frameworks with autoload-heavy structures.
You should be able to identify whether a slowdown came from PHP logic, an ORM query, or a blocking call - in one trace.
4. Database Query Intelligence
Database latency is usually the real bottleneck in PHP systems. An APM should let you:
- Trace query timings, frequency, and parameter patterns.
- Detect N+1 query patterns and unindexed lookups.
- Correlate query performance with application traces - not in a separate dashboard.
- Inspect execution plans or explain output directly from the interface (Datadog and New Relic offer this).
If the tool doesn’t tell you which request fired which query, it’s not helping you tune performance.
5. Error Tracking with Context
Error logs alone aren’t enough - you need errors tied to the requests that caused them.
Choose an APM that:
- Aggregates errors with stack traces, HTTP context, and user/session metadata.
- Differentiates between handled and unhandled exceptions.
- Groups similar errors to reduce noise, but keeps the raw trace data accessible.
- Connects with source maps or Git commits to link directly to the line of code.
The best APMs let you click from an alert to the code that broke - without changing tools.
6. Infrastructure Correlation
Performance issues often trace back to CPU saturation, PHP-FPM pool limits, or container memory pressure.
Look for APMs that:
- Pull infrastructure metrics (CPU, memory, disk, network) alongside traces.
- Overlay application latency vs. resource usage in a single view.
- Support integrations with Prometheus, CloudWatch, or OpenTelemetry Metrics for extended telemetry.
If infrastructure and application graphs live in separate tools, you’ll waste time during incidents connecting the dots manually.
7. Real User Monitoring (RUM)
For web apps, backend performance means little if the frontend is sluggish.
RUM adds browser-side metrics - page load, Core Web Vitals, and JS errors - tied back to the same trace or user session.
Check that the APM:
- Correlates frontend spans with backend traces via headers (like
traceparent). - Captures slow resources and frontend exceptions.
- Can visualize time-to-first-byte (TTFB) and DOM processing time for PHP-generated pages.
That’s how you know if users actually feel the latency your traces reveal.
8. Scalability and Overhead
Agent overhead matters. PHP is synchronous by nature, and any blocking agent will hurt throughput.
Evaluate:
- Agent performance under concurrency - does it fork, block, or buffer asynchronously?
- Sampling control - can you dynamically adjust trace sampling rates per environment?
- Compatibility with your PHP runtime (FPM, Swoole, RoadRunner).
Your APM should scale with your traffic, not throttle it.
9. Cost and Data Control
The pricing model affects what you monitor. If your tool charges by host or data volume, it’s easy to under-instrument to stay within budget.
Focus on:
- Cost per telemetry type - metrics, traces, logs, and RUM are often billed separately.
- Retention control - can you downsample old data or export to S3?
- Vendor lock-in - if it’s not OpenTelemetry-compatible, you can’t take your data elsewhere.
The best APM for you is the one you can afford to leave running - all the time.
Instrument Once, Observe Everything with Last9
When you’re running PHP applications at scale, observability shouldn’t stop at traces and metrics. You need to know what’s running, where it’s running, and how it’s performing - right now. That’s where we built the Last9 Discover suite to help you move from reactive debugging to proactive performance understanding.
Discover Services
With Discover Services, you don’t have to manually maintain a service catalog. As soon as your PHP application sends OpenTelemetry traces, services automatically appear in the dashboard.
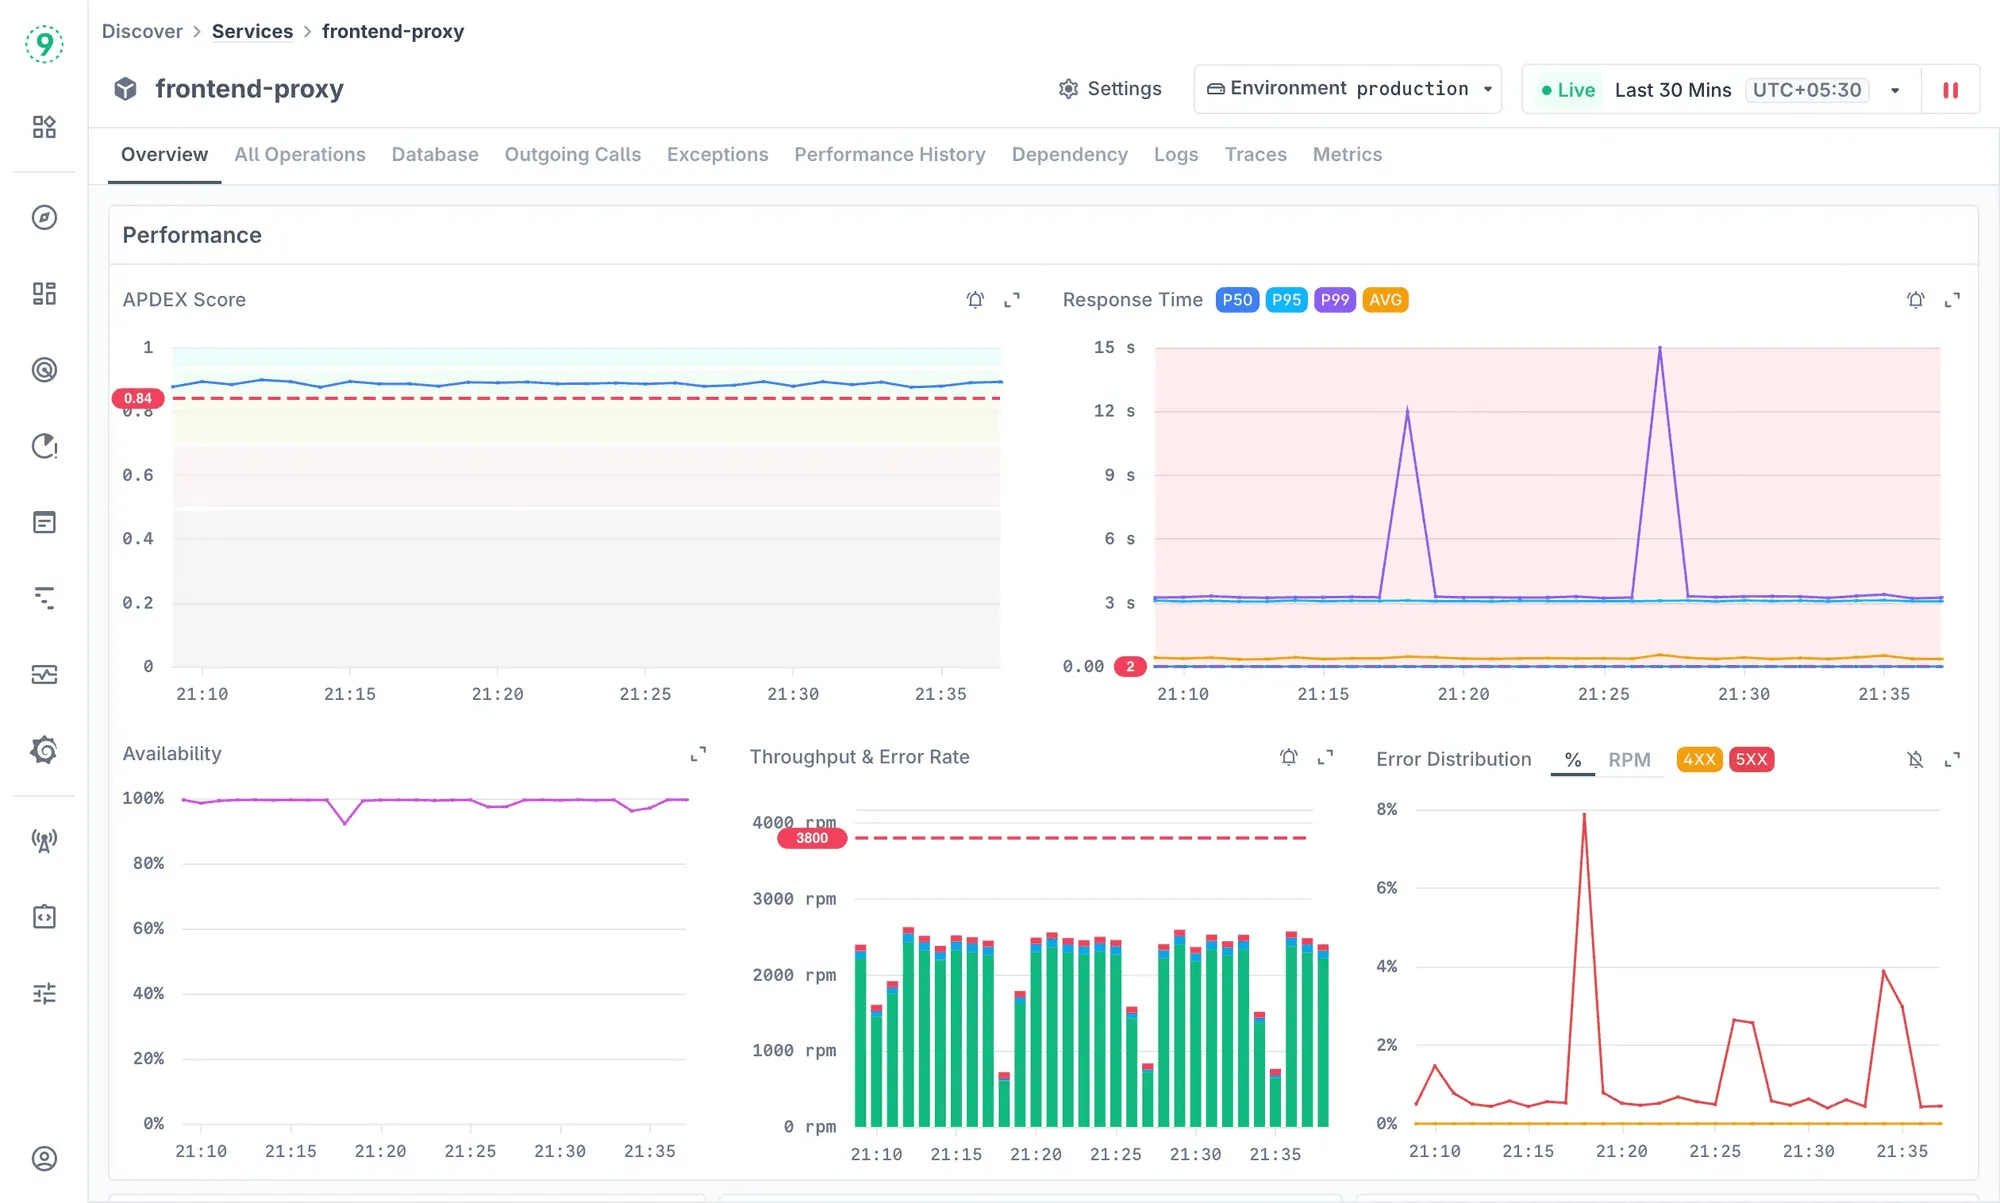
You can:
- View request rates, error counts, and latency percentiles for each service.
- Understand service-to-service dependencies - for example, which upstream calls are slowing down your API.
- Compare performance across environments or regions.
It’s the simplest way to know what’s running and how it’s behaving, without relying on tribal knowledge or outdated configs.
Discover Jobs
If you’re running background jobs, queue workers, or cron tasks in your PHP stack, Discover Jobs helps you keep them accountable.
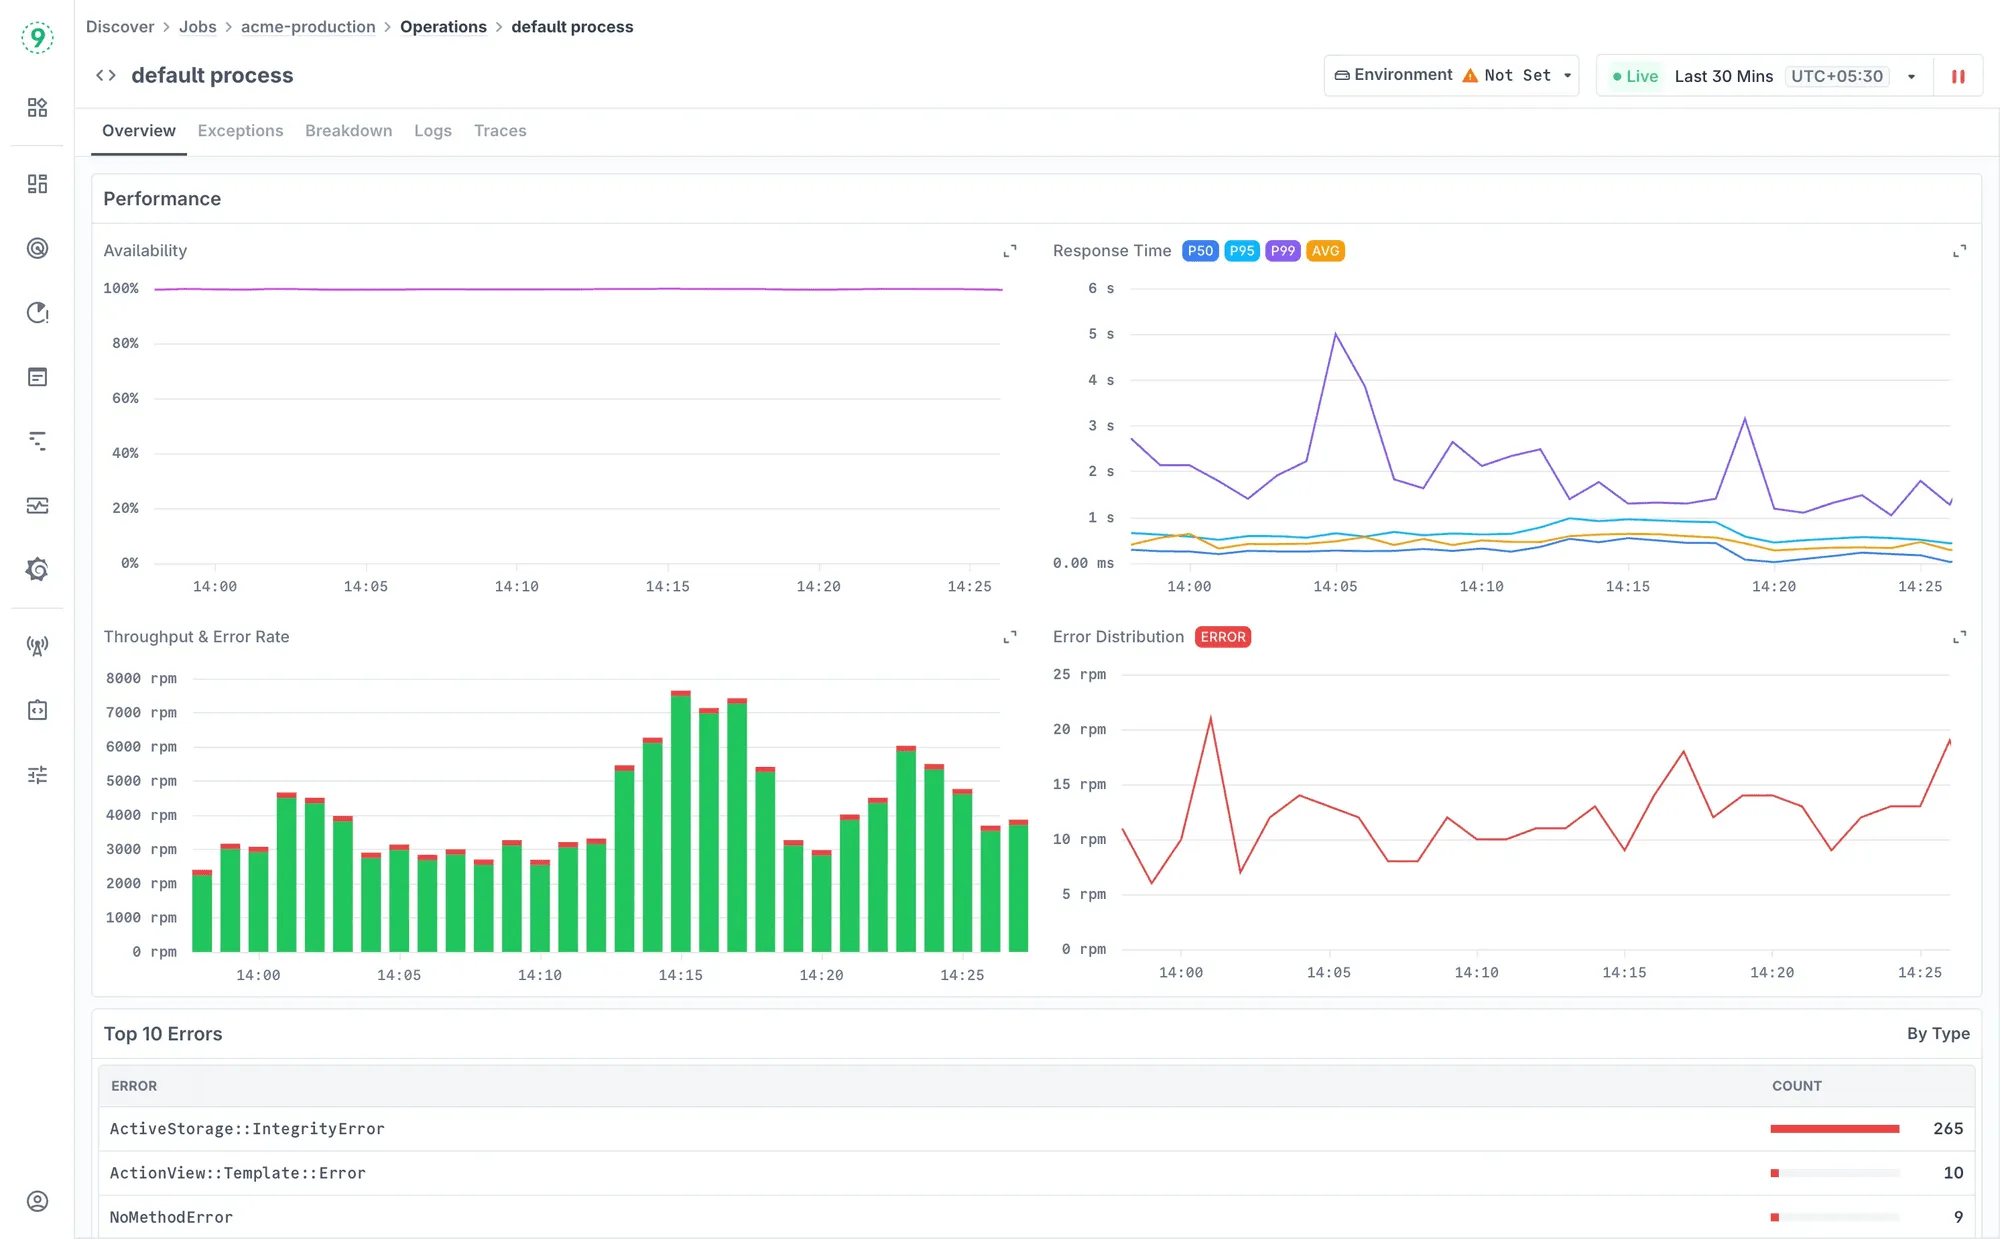
You can:
- Track execution time, throughput, and failure rates for each job.
- Identify slow or failing jobs and drill into trace-level details.
- Spot performance regressions that build up over deployments.
Instead of waiting for job alerts or customer reports, you can see which processes are slowing down and fix them before they start stacking up.
Discover Hosts
Every performance issue eventually ties back to infrastructure - CPU saturation, memory leaks, disk I/O bottlenecks. Discover Hosts shows you that layer clearly.
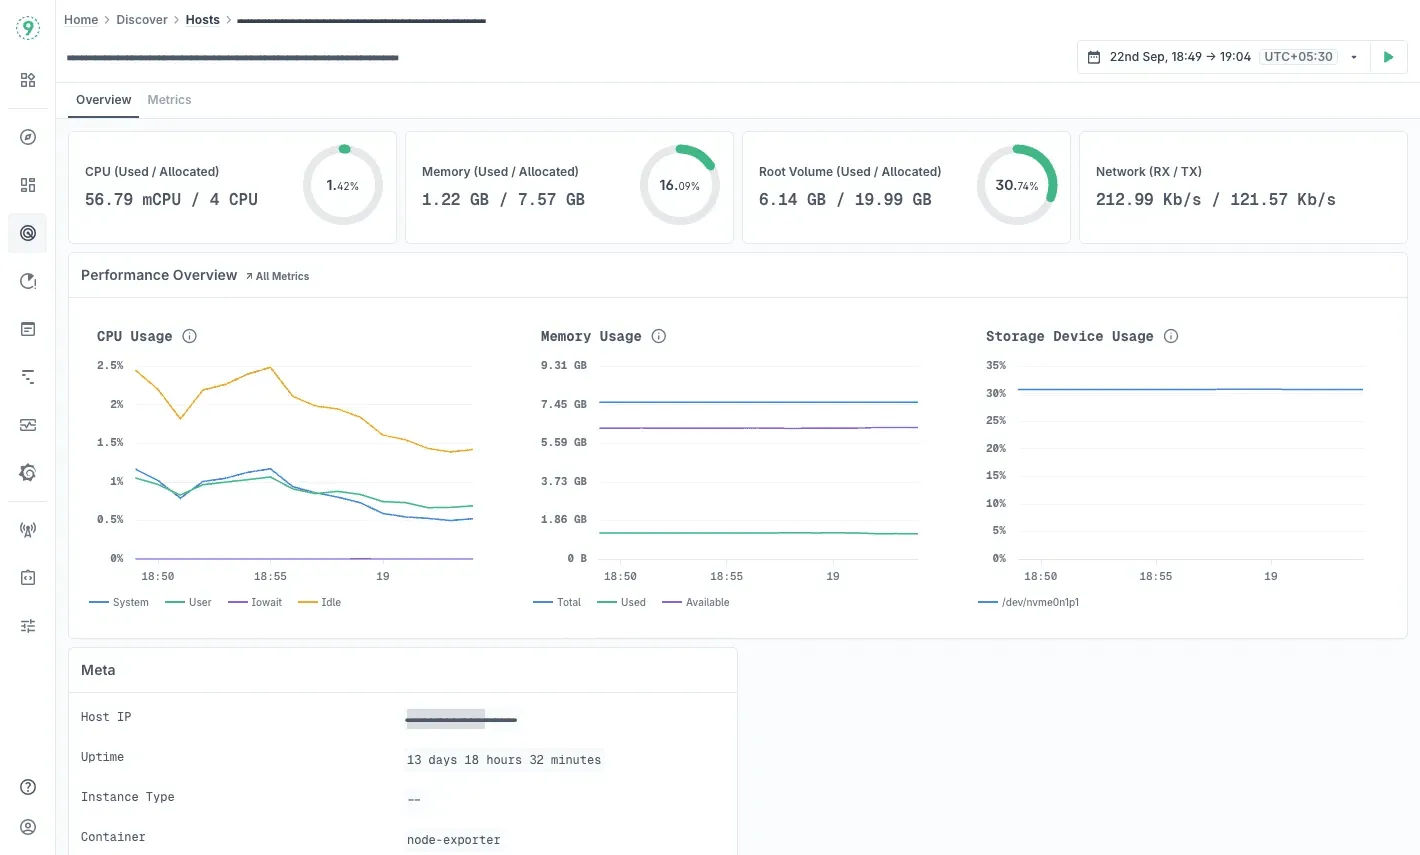
You can:
- Monitor CPU, memory, disk, and network metrics per host.
- Correlate resource pressure with application latency or job failures.
- Drill down into specific hosts to analyze long-term usage patterns.
It’s your bridge between application-level telemetry and host-level performance - the visibility you need to see exactly where your PHP workloads are constrained.
With Last9, you get end-to-end observability for your PHP applications - from services and background jobs to the hosts they run on. You can instrument once with OpenTelemetry and get a unified view of your entire system, without juggling multiple tools.
Try Last9 for free, or schedule a quick walkthrough to see how it fits into your setup!
FAQs
1. What is an APM tool, and why does PHP need one?
An Application Performance Monitoring (APM) tool tracks how your PHP code executes in production - requests, database queries, API calls, and resource usage. PHP apps are often I/O-heavy and rely on external dependencies, so APM helps you identify bottlenecks that traditional logs or metrics alone can’t explain.
2. What’s the difference between APM and profiling?
Profiling measures performance in development - function call times, CPU, and memory. APM runs in production, continuously collecting traces, metrics, and logs to show how real traffic behaves. Profiling is local and diagnostic; APM is ongoing and operational.
3. Can I use OpenTelemetry with PHP?
Yes. The OpenTelemetry PHP SDK supports tracing and metrics collection. You can instrument frameworks like Laravel, Symfony, or Slim and export telemetry to OTLP-compatible backends such as Last9, SigNoz, or Datadog.
4. Which PHP frameworks have the best APM integration?
Laravel and Symfony have the broadest APM agent support. Tools like New Relic, Datadog, and AppSignal offer native auto-instrumentation, while open solutions like Last9 accept OpenTelemetry traces from any PHP framework with minimal setup.
5. How does APM affect PHP performance?
Most APM agents add between 2–5% overhead in production. Lightweight or OTLP-based agents minimize impact by batching traces and sending asynchronously. Tools like Last9 or Sematext avoid proprietary wrappers that typically slow down PHP-FPM workers.
6. What kind of data does a PHP APM collect?
APM tools collect request latency, transaction traces, database timings, memory and CPU usage, exceptions, and external call durations. Some also include Real User Monitoring (RUM) for frontend metrics and host-level telemetry for CPU, memory, and disk I/O.
7. Are there open-source APM options for PHP?
Tools like Scouter, Pinpoint, Stagemonitor, and Performance Co-Pilot (PCP) are open source. They require self-hosting but give you full control over data and configuration.
8. What’s the difference between self-hosted and managed APM solutions?
Self-hosted tools like Scouter or PCP run entirely in your environment - ideal if you need data privacy or deep customization. Managed platforms like Last9, Datadog, and AppSignal handle storage, dashboards, and maintenance for you, reducing operational overhead.
9. How do I monitor database performance in PHP APM?
Most APMs trace queries and display their latency and frequency. Some, like Blackfire or Zend Z-Ray, go deeper, showing query parameters and query plans. In OpenTelemetry setups, you can add semantic attributes (e.g., db.statement, db.system) for granular analysis.
10. How does Last9 handle PHP observability differently?
Last9 is built entirely on OpenTelemetry. Instead of relying on custom agents, it ingests raw OTLP traces and metrics, preserving all attributes. You can use Discover Services, Discover Jobs, and Discover Hosts to view service dependencies, background job performance, and infrastructure metrics - all in real time.
11. What’s the best PHP APM for small teams?
If you’re already instrumenting your applications with OpenTelemetry or want to start cleanly, Last9 is the most developer-friendly choice. It’s built around OTLP, so you can send telemetry directly without installing heavy agents, and use tools like Discover Services, Discover Jobs, and Discover Hosts to track everything from service latency to background job health.
If you prefer managed simplicity, AppSignal, Atatus, and Site24x7 also provide solid PHP support with minimal setup. If you need a self-hosted option, Pinpoint or Performance Co-Pilot (PCP) offer flexibility and full data control.

