

Background jobs handle the critical work that happens outside the request path: processing payments, sending emails, generating reports, syncing data. They keep applications running smoothly, but the signals they produce look different from API endpoints.
Most teams start with queue metrics-how many jobs are waiting and how quickly they complete. These metrics provide the foundation, but job health extends beyond throughput. Execution patterns, resource consumption, retry behavior, and dependency relationships complete the picture.
In this blog, we talk about the key signals that make background jobs observable, how distributed tracing reveals job execution phases, and how to structure alerts that catch real issues without noise.
Signals That Define Job Health
Success and failure counts form the baseline of job observability. To understand how jobs really behave under load, you need signals that capture execution patterns, resource use, dependency behavior, and error context. Together, these dimensions provide the visibility needed to explain why jobs slow down or fail.
Execution Patterns
Duration histograms and percentile latencies (P95, P99) highlight whether most jobs finish consistently or if a subset runs much longer than expected. Queue metrics add another layer: depth shows how many jobs are waiting, while age shows how long they’ve been stuck in the backlog. Retry counts help distinguish between short-lived issues and patterns worth closer attention.
job_duration_seconds{job_type="email_sender", status="completed"} 2.3job_duration_seconds{job_type="report_generator", status="completed"} 45.2How to capture this: use an OpenTelemetry histogram to record job durations with labels for job.type and status. For Prometheus setups, instrument workers to expose these metrics on an endpoint and let the collector scrape them. Queue age can be tracked by recording the enqueue timestamp and subtracting it at execution.
Resource Usage
Job performance often correlates with how memory, CPU, and file descriptors are consumed. Tracking memory and CPU per job type makes it clear when specific workloads demand more resources, or when usage trends upward over time. File descriptors show whether sockets or connections are being closed properly, preventing silent leaks that degrade throughput.
# Example: recording memory usage per job with OpenTelemetrymemory_used.record(end - start, {"job.type": "batch_processor", "job.id": batch_id})For this, you can wrap job execution logic with resource probes (e.g., psutil in Python) and feed those values into an OpenTelemetry gauge. Exporters like OTLP or Prometheus Remote Write can push these metrics into Last9 for correlation with traces.
Dependencies
Jobs depend on services like databases, APIs, and message queues. Connection pool wait times, API response codes, and queue backpressure often explain slowdowns or retries. Capturing these metrics from within job workers ties dependency health directly to job performance.
job.external.duration{service="user_service", endpoint="/api/users"} 150msjob.external.status{service="payment_api", status_code="429"} 1_H_ere, you can instrument client libraries (HTTP, gRPC, DB drivers) with OpenTelemetry to emit latency and status metrics. In Last9, these can be filtered by both job.type and service to explain dependency-driven slowdowns.
Error Context
Not all failures are the same. Tagging errors with types (e.g., timeout, validation, rate limit) and including retry counts, dependencies, and input size makes debugging faster. This context turns raw error counts into actionable signals by separating transient conditions from persistent failures.
{ "job.id": "job_12345", "job.type": "payment_processor", "error.type": "external_api_timeout", "retry.count": 2, "dependency": "payment_gateway"}You can wrap error handling logic so that exceptions are logged with structured fields. Forward these as spans or logs via OpenTelemetry exporters. With Last9, errors align automatically with traces and metrics using job.id or trace_id
Trace Multi-Phase Jobs
Background jobs often span multiple phases: validating input, fetching data, calling an API, and updating a database. Metrics can show overall duration, but they don’t reveal which step is slowing the job down.
Distributed tracing closes this gap. A parent span represents the job itself, while child spans represent individual phases. Attributes like job.id, job.type, and phase keep each span queryable by job context. The result is a waterfall view that shows exactly where time is spent.
def process_payment(job_id, amount):    with tracer.start_as_current_span("job.execute", attributes={"job.id": job_id, "job.type": "payment_processor"}):
        with tracer.start_as_current_span("phase.validate"):            validate_payment(amount)
        with tracer.start_as_current_span("phase.external_api", attributes={"service": "payment_gateway"}):            call_payment_api(amount)
        with tracer.start_as_current_span("phase.persist"):            update_ledger(job_id, amount)
In this example:
job.executeis the parent span, representing the full job.- Each phase is a child span, showing where time is spent.
- Attributes tie the spans to job identity and dependencies.
You can export spans with an OTLP exporter and send them either directly to Last9 or through a collector like the OpenTelemetry Collector, Jaeger, or Tempo. In Last9, these traces render as waterfall views where you can filter by job.type, phase, or service to see which step consistently drives job latency.
You can trace how background jobs connect across services by applying the same principles of APM tracing.
Context Propagation Across Services
A user request might enqueue a job, the job calls an API, and that API triggers additional work. Without context propagation, each part looks disconnected.
OpenTelemetry provides standard context propagation. When enqueueing a job, the trace context gets serialized into the job payload. The worker extracts this context, linking job spans back to the originating request.
# Producer: attach trace context when enqueuingfrom opentelemetry.trace.propagation.tracecontext import TraceContextTextMapPropagator
carrier = {}TraceContextTextMapPropagator().inject(carrier)enqueue_job(payload, headers=carrier)
# Consumer: restore context in workerctx = TraceContextTextMapPropagator().extract(job.headers)with tracer.start_as_current_span("job.execute", context=ctx):    process_job(job.payload)
This creates unified traces showing how user actions, background jobs, and dependencies connect. When investigating a slow checkout flow, you can see if it correlates with retries in specific background job types.
Rules for Reliable Job Alerts
Alerts for background jobs need to balance sensitivity with precision. Simple thresholds often create noise, while ignoring subtle patterns lets real issues slip through. The most effective rules combine multiple signals and account for job scheduling behavior.
Failure and Throughput Together
A single failure-rate threshold often over-fires during dependency hiccups. Combining signals gives better precision - for example, flagging only when failures rise and throughput drops.
- alert: BackgroundJobsUnhealthy expr: | ( rate(jobs_failed_total[5m]) / rate(jobs_total[5m]) > 0.1 and rate(jobs_completed_total[5m]) < 10 ) for: 2mDuration Drift
Jobs that consistently take longer than baseline are early warnings of resource contention or dependency lag. Watching P95 or P99 latency relative to historical values surfaces these changes before they become full-outages.
Retry Spikes
A rising retry count signals either transient downstream issues or systematic failures. Tagging retries with dependency and error type makes it possible to distinguish between “noisy but safe” retries and retries that mask deeper problems.
Scheduled Job Pulses
Not all jobs run continuously - many are scheduled. Their metrics look like pulses: bursts of activity followed by idle periods. Key signals include:
- Expected cadence (every minute, hour, day)
- Missed runs (jobs not appearing on schedule)
- Overdue jobs (execution exceeding the expected window)
- Skew (one shard running late while others are on time)
job.schedule.expected_interval_seconds{job="daily_report"} 86400job.schedule.last_run_timestamp{job="daily_report"} 1726425600job.schedule.overdue{job="daily_report"} 1How to put this into practice: define alerts in Prometheus or via the Last9 Alert Studio, where high-cardinality filters remain usable. For example, you can scope alerts to job.type="payment_processor" or tenant="enterprise" without flattening those attributes. This keeps alerts focused on the jobs that matter most while avoiding unnecessary noise.
See how logs add context to performance signals in APM Logs for Faster Debugging.
Final Thoughts
Most teams track success and failure rates, but the harder part is tying jobs to the right signals - latency, retries, resource use, and dependency health.
Last9 makes this easier with the Discover → Jobs view, where you can see throughput, error rates, latency percentiles, and queue metrics in one place.
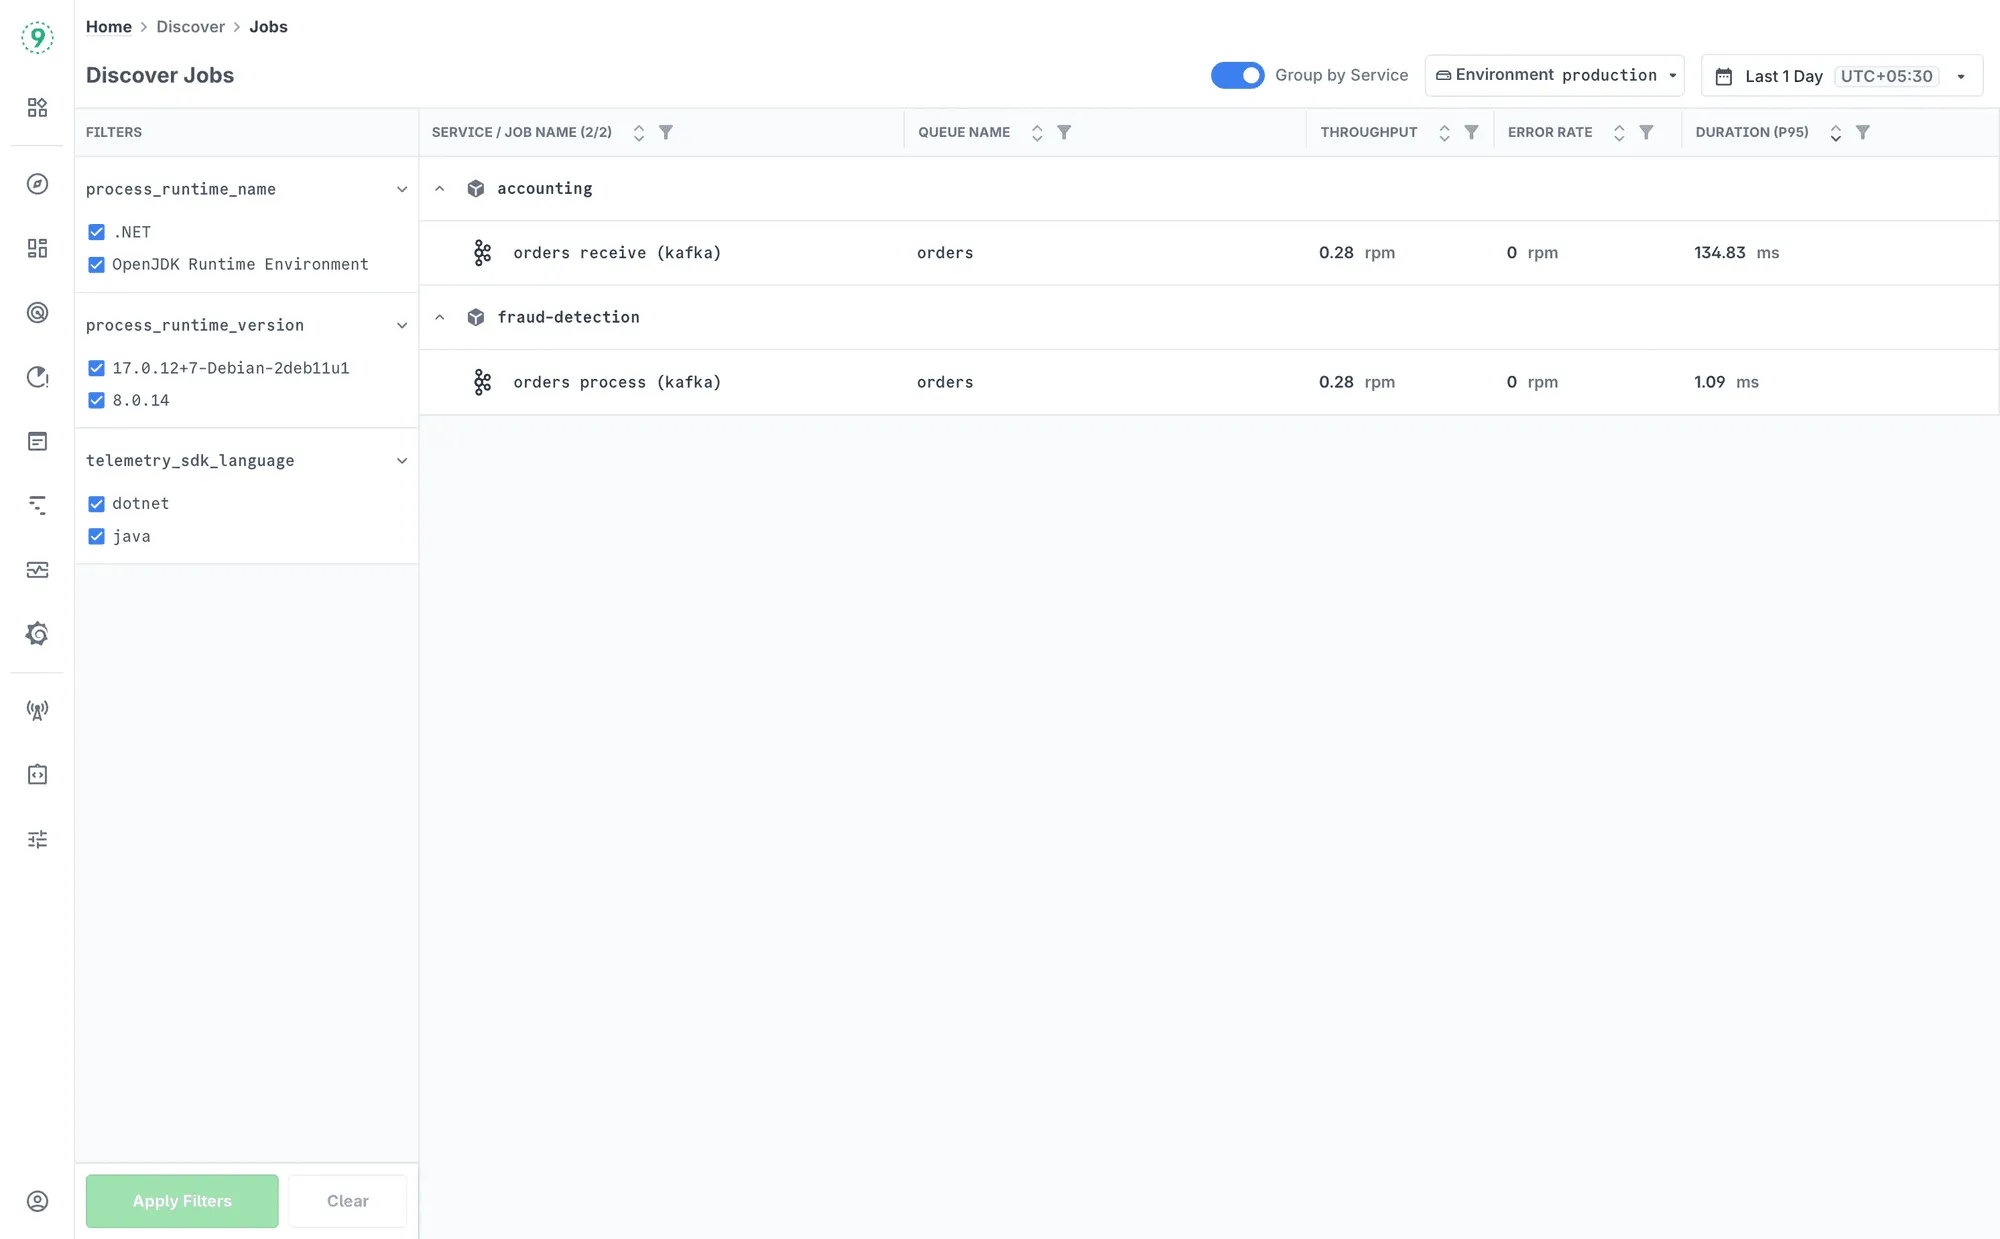
You can group jobs by service, version, or job type, drill into exceptions and slow operations, and pivot directly into related logs and traces without stitching context yourself. High-cardinality filters like job version or runtime stay queryable, so patterns remain visible instead of being flattened away.
If you’re looking to improve job observability without adding monitoring sprawl, check out how Last9’s job views connect performance, resource use, and failure patterns in real time.
FAQs
Q: How do I avoid metric explosion when monitoring hundreds of different job types?
A: Use tag-based metrics with job_type as a dimension rather than creating separate metrics for each job. Observability platforms like Last9 handle high cardinality efficiently, but you can also aggregate less-critical job types under broader categories.
Q: Should I monitor every background job or focus on critical ones?
A: Start with jobs that directly impact user experience-payment processing, email delivery, and report generation. Then expand to jobs that affect other systems or have complex resource requirements.
Q: What’s the difference between job observability and general application monitoring?
A: Job observability focuses on asynchronous, batch-oriented work patterns. You’re tracking queue behavior, batch processing efficiency, and resource usage over time rather than request/response patterns.
Q: How do I handle job monitoring across multiple worker processes or containers?
A: Use process-level metrics aggregated by job type and worker instance. Container orchestration platforms like Kubernetes make it easier to collect metrics from ephemeral job workers.
Q: What job metrics should trigger immediate alerts vs. longer-term analysis?
A: Alert on sustained high failure rates, jobs stuck for unusually long periods, and resource exhaustion. Use longer-term analysis for performance trends, optimization opportunities, and capacity planning.
Q: How do I correlate job performance with infrastructure changes or deployments?
A: Tag your job metrics with deployment version or infrastructure change timestamps. Most observability platforms let you overlay deployment markers on metric dashboards to spot correlations.
Q: How do I trace background jobs that spawn across multiple services or containers?
A: Use OpenTelemetry’s context propagation to maintain trace continuity. Pass trace context through message queues, HTTP headers, or job metadata. This creates unified traces even when job phases run in different processes or services.
Q: Should job observability include business metrics or just technical ones?
A: Include business context where relevant-emails sent, payments processed, reports generated. Adding business identifiers like user_id, account_id, or transaction_amount as trace attributes helps correlate technical issues with business impact and makes debugging more targeted.

