

When a Node.js app slows down, you don’t get a clear picture right away. One service stalls, another spikes in CPU, and somewhere in between, requests start piling up. You can’t fix what you can’t see.
Application Performance Monitoring (APM) tools close that gap. They capture request traces, latency, and errors across your stack - showing you what’s running slow and why.
This blog looks at what matters in a Node.js APM setup and some of the best tools that make monitoring faster and less painful.
Key Features to Look for in a Node.js APM Tool
Choosing an APM tool for Node.js means focusing on what helps you understand event-loop behavior, async workloads, and dependency latency.
Real-time Monitoring
Node.js is single-threaded, so CPU or memory spikes can block the event loop quickly. Real-time metrics - CPU, heap usage, active handles, and request throughput - help teams notice when the loop is stalling or garbage collection runs too long.
Distributed Tracing
Async calls often jump across services and queues. Distributed tracing connects those hops, showing where a request slows - inside the Node.js app, during I/O waits, or downstream in another microservice. It’s essential when debugging async chains that span multiple layers.
Error Tracking and Reporting
Uncaught exceptions, promise rejections, and slow middleware are common pain points. A good APM tool captures these automatically, groups similar errors, and surfaces stack traces with runtime context like memory and CPU state at the time of failure.
Database and External Service Monitoring
Node.js apps rely heavily on databases and external APIs. Monitoring query duration, connection pool saturation, and API response latency helps confirm whether slow responses come from the app itself or from dependencies.
Custom Metrics and Dashboards
Some issues are app-specific - queue backlogs, socket timeouts, or worker thread utilization. Custom metrics let you monitor these signals and track business-level performance without instrumenting every function manually.
Alerting and Notifications
Real-time alerts based on latency percentiles or error-rate thresholds keep feedback loops short. When the event loop delay exceeds a set limit or error rates spike, alerts through Slack or PagerDuty help teams act before it becomes a customer issue.
Top 9 APM Tools for Node.js Applications
A multitude of APM solutions exist, each offering distinct advantages. Which tools stand out for their comprehensive support of Node.js environments?
1. Last9
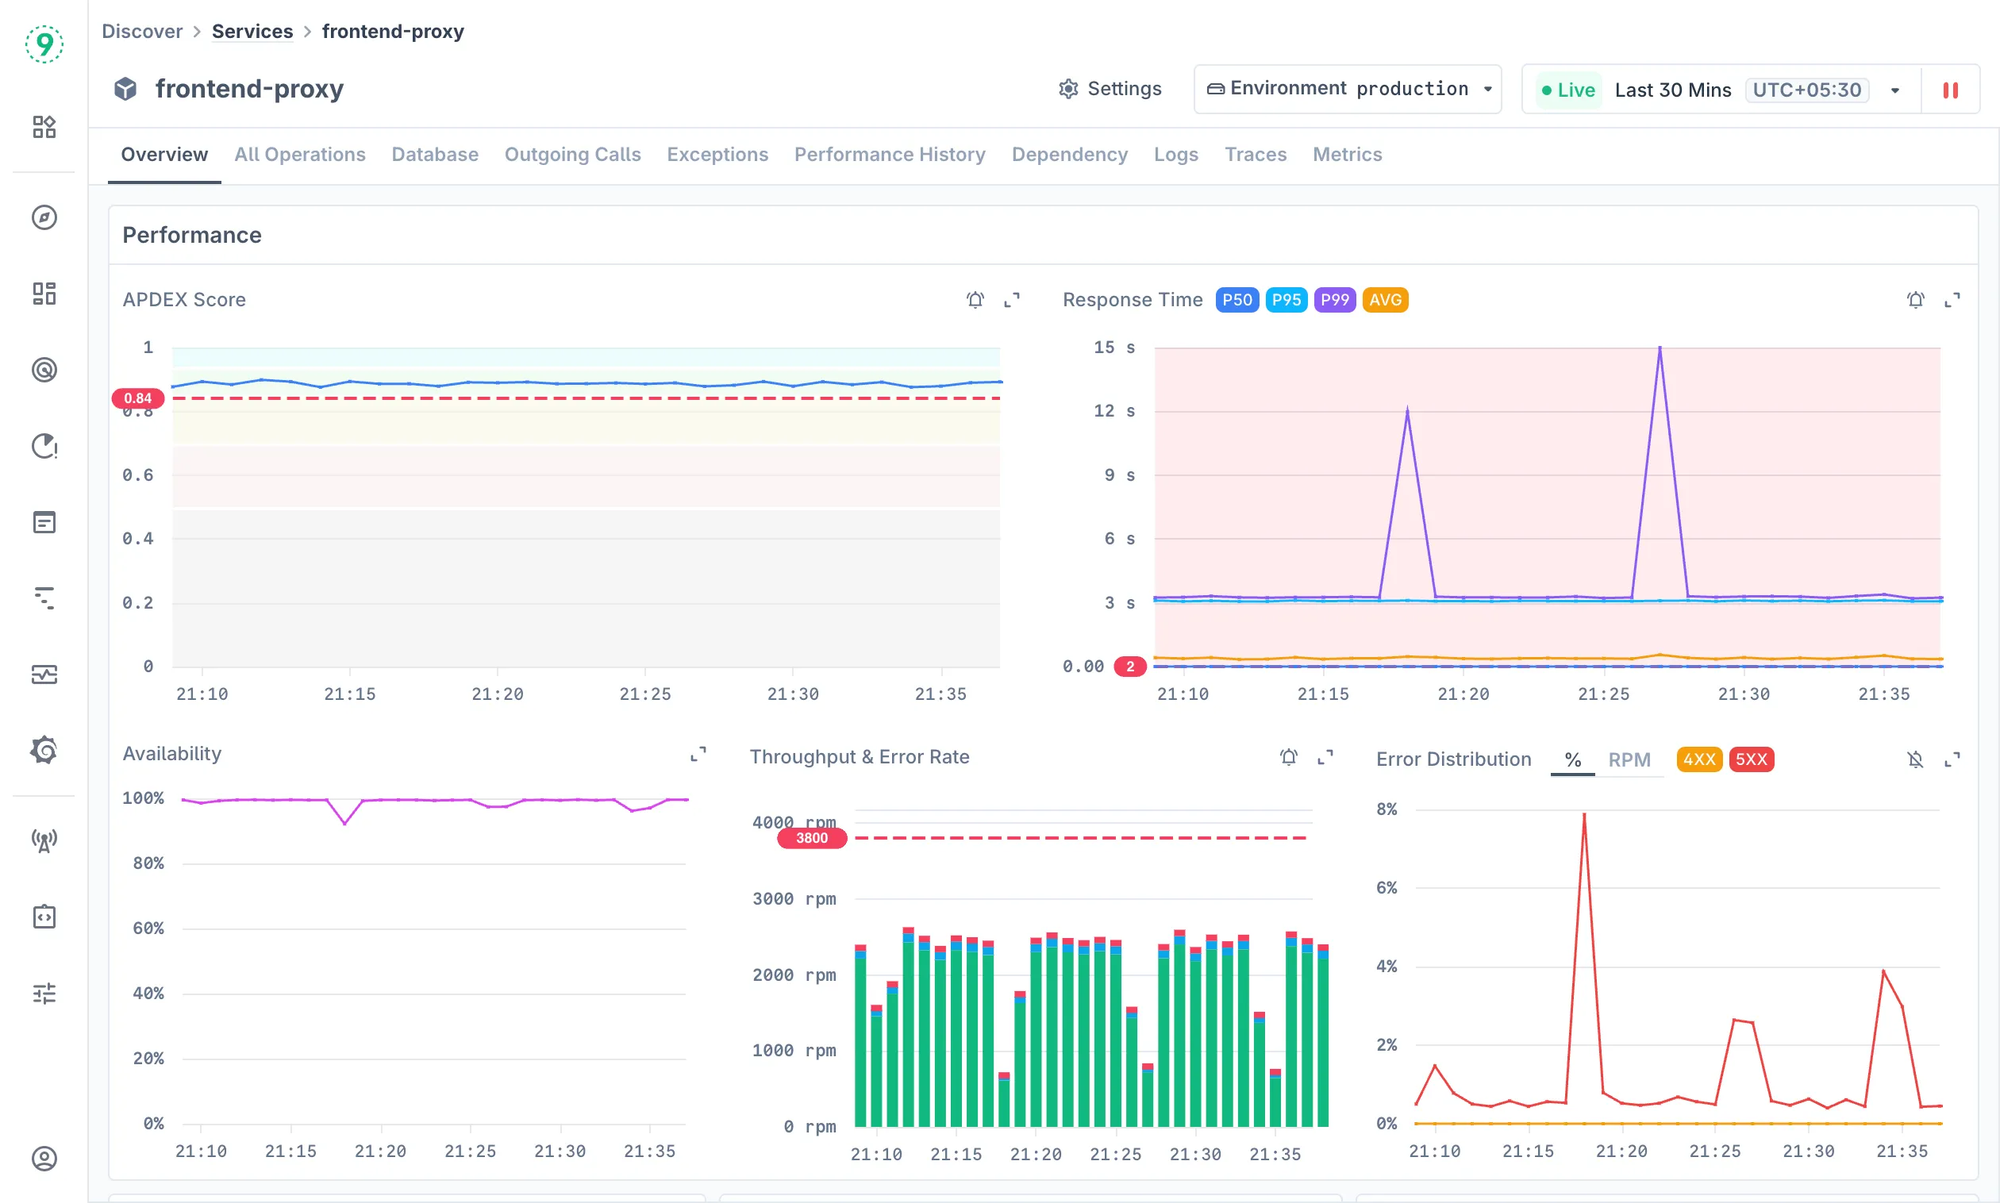
We built Last9 APM to make it easier for engineering teams to understand how their services behave - without adding more tools or dashboards. At its core is Discover Services, our APM layer that automatically detects services, dependencies, and performance metrics from OpenTelemetry traces.
For Node.js teams, this means every route, middleware, and external call becomes visible - from async queue delays to slow API endpoints. You can see throughput, error rates, and latency for each service, then trace an issue down to the exact operation causing it.
Key Strengths
- Auto-discovered topology: Node.js services appear automatically as traces start flowing in - no YAML configs or catalog maintenance.
- Event-loop visibility: Track latency, error rates, and CPU/memory correlation to spot blocked loops or uneven async workloads.
- Unified context: Logs, metrics, and traces live together - helping you connect an application slowdown with the infrastructure event behind it.
- Streaming aggregation: Handles high-cardinality metrics at scale, perfect for Node.js services emitting granular telemetry.
- Cost transparency: No per-host or per-user billing. You pay for what you ingest, not for how many containers or developers you have.
Pricing
Pricing starts with a free plan (100M events, 7-day retention, 5 users), followed by a Pro plan at $850/month, and custom enterprise options with BYOC deployment and extended retention.
Last9 APM is built for teams who need performance visibility without the overhead - especially when Node.js services run at massive scale and every millisecond matters.

2. Sentry
Sentry helps developers monitor how their Node.js applications behave in production by automatically tracking exceptions, performance issues, and slow transactions. It gives full context around each event - including stack traces, release versions, and user sessions - so developers can identify what went wrong and where.
- Sentry fits naturally into developer workflows and connects directly with tools like GitHub, Jira, and Slack, so issues appear where teams already collaborate.
- The
@sentry/nodeSDK makes setup straightforward, requiring only a few lines of code to begin collecting data. - It supports popular Node.js frameworks such as Express, Fastify, and NestJS, providing wide coverage across typical service stacks.
- Once running, it tracks event loop delays, slow API endpoints, and database query latency that standard metrics often miss.
- The release health view helps teams catch performance regressions soon after deployment and measure how code changes affect response times.
Pricing
A free plan is available for small projects. Paid plans start at $29/month, offering higher event limits, detailed transaction data, and advanced alerting.
3. AppDynamics
If you’re managing Node.js applications that run across several services or hybrid environments, AppDynamics helps you keep track of how everything connects. It gives you deep visibility into requests as they move through APIs, databases, and external systems - so when something slows down, you can pinpoint exactly where.
- You can trace a request from a Node.js API endpoint through a database query and into an external payment service, seeing how much time each step adds.
- Code-level diagnostics highlight blocking calls, unoptimized queries, and event loop delays that affect response times.
- AppDynamics automatically maps dependencies between services, giving you a live view of how your application topology changes with each release.
- Built-in baselining uses machine learning to detect anomalies - for instance, if checkout latency suddenly doubles after a new deployment.
- Business transaction tracking connects performance data to user flows, so you can see how a slow endpoint affects conversions or in-app actions.
Pricing
A 15-day free trial is available. Paid plans start around $60 per CPU core per month, with enterprise options for larger or hybrid deployments.
4. Instana
If you want APM that just works out of the box, Instana is worth a look. It automatically discovers every Node.js service in your environment and maps how they connect - no manual configuration needed. You can see metrics, traces, and dependencies update in real time as your application scales or redeploys.
- Instana automatically detects new Node.js containers, services, or APIs the moment they start running, so you don’t have to instrument each one manually.
- You can trace individual requests through multiple layers - for example, from an Express route to a PostgreSQL query and back - and instantly spot where latency builds up.
- Its AI-assisted root cause engine helps you identify which component actually triggered a performance issue, even when several metrics change at once.
- The dashboard updates every second, giving you near real-time insights into CPU usage, garbage collection pauses, and memory trends.
- You can set up smart alerts that learn normal performance patterns, helping you avoid false positives in dynamic environments.
Pricing
Instana offers a 14-day free trial, with paid plans starting at around $75 per host per month. Enterprise pricing is available for large-scale or multi-cloud environments.
5. Grafana Tempo
If you’re already using Grafana for dashboards, Tempo fits right in. It’s an open-source distributed tracing backend built for scale - perfect when your Node.js applications generate high volumes of trace data. Unlike full-stack APMs, Tempo focuses on trace storage and retrieval, keeping costs predictable even at large ingestion rates.
- You can send OpenTelemetry traces from your Node.js services to Tempo and visualize them directly in Grafana alongside metrics and logs.
- It integrates naturally with Loki for logs and Prometheus for metrics, creating a complete observability stack that stays open-source end to end.
- Tempo doesn’t require an external database; traces are stored efficiently using object storage like S3 or GCS, which makes it easy to scale.
- For example, if an Express API starts slowing down, you can search traces in Grafana, filter by endpoint or latency, and pinpoint which downstream call is responsible.
- It’s ideal for teams who want to manage tracing infrastructure themselves without vendor lock-in.
Pricing
Grafana Tempo is open-source and free to use. Managed plans are available through Grafana Cloud, starting around $49/month with usage-based storage and retention.
6. AppSignal
AppSignal keeps APM simple - it’s built for developers who want insights without wrestling with setup or complex dashboards. It brings performance monitoring, error tracking, and host metrics together in one clean interface, making it easy to understand how your Node.js applications behave in production.
- You can track request throughput, memory usage, and response times for each route, and quickly identify slow transactions or frequent errors.
- It automatically instruments popular Node.js frameworks like Express, Koa, and Next.js, so you get meaningful data right after installation.
- The dashboard surfaces actionable insights - for example, showing how a new deployment increased response time for a specific API endpoint.
- Built-in host monitoring lets you correlate application performance with system metrics such as CPU load, memory, and disk usage.
- AppSignal’s focus on usability makes it a good choice if you want APM that “just works” without custom configuration.
Pricing
AppSignal offers a 30-day free trial, with paid plans starting at $19/month per app, scaling based on data volume and retention.
7. Datadog APM
Datadog APM is built for teams that want everything - metrics, traces, logs, and infrastructure - in one place. For Node.js applications, it offers detailed distributed tracing, automatic instrumentation, and deep dependency mapping that connects application performance to underlying infrastructure.
- You can trace requests through your Node.js APIs, queues, and databases, and see how each dependency contributes to overall latency.
- The Datadog agent automatically instruments common frameworks like Express, Fastify, and NestJS, capturing traces with minimal setup.
- You can create custom metrics - for example, tracking queue wait time or cache hit rates - and visualize them alongside system metrics like CPU or network throughput.
- Service maps make it easy to see how Node.js services interact with external systems, helping you spot bottlenecks across microservices.
- Integration with logs and infrastructure monitoring means you can move from an application trace to container stats or host metrics in a single click.
Pricing
Datadog APM offers a free trial, with paid plans starting at $31 per host per month. Pricing scales based on data volume and retention, with additional costs for logs and infrastructure monitoring.
8. Apache SkyWalking
Apache SkyWalking is a powerful open-source APM and observability platform that helps you monitor distributed systems without relying on vendor-managed infrastructure. It works well with Node.js applications running in microservice or service mesh environments, providing end-to-end tracing, metrics, and topology visualization.
- You can instrument your Node.js services using the SkyWalking Node.js agent, which automatically captures spans, service calls, and errors.
- It visualizes service dependencies in real time, helping you understand how requests flow between APIs, databases, and third-party services.
- SkyWalking supports service mesh telemetry, so if you’re running Node.js workloads on Istio or Linkerd, you can correlate service-level metrics with trace data.
- The built-in analysis tools help identify slow operations, high-latency routes, or sudden error spikes across distributed services.
- Because it’s open-source, you can self-host SkyWalking and customize storage backends, retention, and integrations to fit your observability stack.
Pricing
Apache SkyWalking is free and open-source, licensed under Apache 2.0. Commercial support is available through partners, but most teams use it as part of their in-house observability setup.
9. Elastic APM
If you’re already using the Elastic Stack, Elastic APM extends it into a full observability layer for your Node.js applications. It collects traces, metrics, and logs, storing them in Elasticsearch so you can query, analyze, and visualize everything in one place through Kibana.
- You can instrument your Node.js apps using the Elastic APM Agent, which automatically tracks request latency, database queries, and external API calls.
- The integration with Elasticsearch lets you run detailed queries - for example, comparing response times between API versions or checking error trends after a deployment.
- Distributed tracing connects requests across services, giving you a clear view of how each Node.js component fits into the bigger system.
- Elastic APM’s error logging captures stack traces and contextual metadata, helping you debug without switching between tools.
- When combined with Kibana and Beats, it forms a complete, open-source observability pipeline - from data ingestion to visualization.
Pricing
Elastic APM is free and open-source as part of the Elastic Stack. Managed plans are available via Elastic Cloud, starting around $95/month for small deployments, with scaling based on data volume and retention.
Choose the Right APM Tool for Your Node.js Environment
The right tool depends on how your applications are built, how your team works, and what kind of visibility you actually need.
If you’re running a monolithic Node.js application, you’ll want detailed, code-level visibility. Tools like AppSignal, Sentry, or AppDynamics help track what’s happening inside the event loop, measure request latency, and capture exceptions with context. These tools are ideal when your bottlenecks live within the code itself - a slow middleware, an N+1 query, or a blocking I/O call.
For microservices or event-driven architectures, distributed tracing matters more than line-level debugging. You need to see how a single request travels across services, APIs, and queues. Tools such as Last9, Datadog, or Apache SkyWalking help you do that by stitching together spans from different services into one coherent trace.
- Example: When a checkout request spikes to 4 seconds, tracing helps you see that 3.2 seconds were spent waiting on a payment API - not inside your Node.js app.
- What to look for: Service maps, request flow visualization, and latency attribution across dependencies.
If your team already has a monitoring stack, lean on that foundation.
- Using Grafana, Prometheus, or Loki? Add Grafana Tempo for tracing - it keeps everything open-source and in one place.
- Running Elasticsearch and Kibana? Elastic APM extends the same ecosystem, letting you visualize traces alongside logs and metrics.
- Need something quick to set up with sensible defaults? Instana and AppSignal deliver value fast without deep configuration.
Scale is another deciding factor. Node.js applications often emit high-cardinality telemetry - labels like user IDs, version tags, or regions. Not every tool handles that gracefully.
- Last9 handles high-cardinality metrics natively, so you can slice by dimension without losing resolution.
- Enterprise tools like AppDynamics or Datadog handle complex governance and compliance requirements when you’re operating at scale.
Finally, match the tool to your team’s workflow:
- If developers own performance and releases, choose something lightweight like Sentry or AppSignal.
- If observability spans SREs, platform, and product teams, Last9, Tempo, or Datadog will scale better with shared ownership.
The right APM doesn’t just visualize metrics - it helps you reason about behavior. Choose the one that helps you connect slow endpoints to the underlying cause, whether that’s a blocked event loop, an external API delay, or an overloaded worker queue.
Bring Clarity to Your Node.js Performance with Last9
Last9 gives you complete visibility into how your Node.js applications perform in production - from event loop behavior and API latency to cross-service dependencies. Our platform is built for modern, distributed environments where services scale fast and data volume grows even faster.
With our SRE-focused approach, you can track key reliability metrics, analyze service health, and correlate performance across metrics, logs, and traces - all in one place.
Discover Services automatically detects your Node.js workloads, maps dependencies, and highlights what’s slowing down requests, so you can focus on improving performance instead of chasing symptoms.
Start for free today, or book some time with us to see how Last9 fits your stack.
FAQs
What is an APM node?
An APM node refers to an application instance or service being monitored by an Application Performance Monitoring (APM) tool. In the context of Node.js, it’s typically your running Node.js process or container that the APM agent instruments to collect metrics, traces, and logs.
What is Node.js PPA?
Node.js PPA (Personal Package Archive) is an Ubuntu repository that provides official Node.js binaries and updates. It’s managed by NodeSource and allows you to install specific Node.js versions on Debian-based systems using apt.
What are some affordable Node.js APM monitoring services comparable to Dynatrace and New Relic?
If you’re looking for cost-effective alternatives, consider:
- Last9 – usage-based pricing, built for high-cardinality and distributed environments.
- Uptrace – open-source tracing and metrics platform with hosted options.
- AppSignal – developer-friendly, starting at $19/month per app.
- Elastic APM – free and open-source, with optional managed plans.
How to determine the Connector JAR file version?
For Java-based agents (e.g., JDBC monitoring), you can check the connector version in your Node.js project’s dependency tree or by inspecting the JAR file name - for example, mysql-connector-java-8.0.32.jar. The version is usually embedded in the filename.
How to overwrite the recommended set of metrics?
Most APM agents (including OpenTelemetry) allow metric customization through configuration files or environment variables. You can enable or disable specific metrics, define your own instruments, and export only what’s relevant to your system to reduce overhead.
What are some high-quality open-source Node app / API examples?
A few solid references include:
- Ghost – a modern Node.js-based CMS.
- Strapi – an open-source headless CMS with a REST and GraphQL API.
- NestJS RealWorld Example App – a production-grade reference for scalable API design.
- Fastify Example APIs – minimal, high-performance setups for microservices.
What setup are you using for async job processing with queues with Node.js and AWS?
A common approach is to use BullMQ or RabbitMQ for job queues and Amazon SQS as the managed queue service. You can run workers in ECS or Lambda to process jobs asynchronously, using Redis or DynamoDB to store state.
Why monitor Node.js applications?
Monitoring helps you understand how your app behaves under load - tracking event loop delays, slow API endpoints, or failed async calls before they impact users. Node.js is single-threaded, so even minor issues in CPU or memory usage can block the entire process.
How can I implement APM in a Node.js application?
Install an APM agent (like OpenTelemetry, Sentry, or Datadog), configure it to start before your application code, and point it to your APM backend. For example:
npm install @opentelemetry/sdk-node
node -r @opentelemetry/auto-instrumentations-node/register app.js
This setup captures metrics, traces, and spans automatically from popular frameworks like Express or Fastify.
How does APM work with Node.js to monitor application performance?
APM agents hook into your Node.js runtime and instrument functions, frameworks, and libraries. They capture metrics such as request latency, throughput, and error rates, then export this data to a backend for visualization and analysis.

