

Message queues quietly take care of a lot—buffering workloads, smoothing traffic spikes, and keeping services connected. But they don’t always get much attention until something feels off.
Amazon SQS offers a solid set of metrics to help you understand how your queues are doing, whether you’re scaling well or nearing limits.
This blog breaks down the key SQS metrics: where to find them, what they mean, and how to respond when things start to shift.
What is Amazon SQS?
Amazon Simple Queue Service (SQS) is a fully managed message queuing service from AWS. It’s designed to let systems communicate asynchronously by sending, storing, and receiving messages between services, without needing tight coupling or manual infrastructure management.
SQS helps solve three common problems in distributed systems:
- Asynchronous processing – Offload tasks to background workers so your main application stays responsive.
- Load leveling – Absorb traffic bursts and prevent downstream services from being overwhelmed.
- Service decoupling – Let services interact without relying on each other’s availability or implementation details.
In AWS, SQS acts as a managed buffer between components. It handles message durability, retries, and horizontal scaling automatically, with no need to maintain brokers or manage failover logic. Everything runs across multiple availability zones for resilience by default.
For a closer look at how custom metrics work across AWS services, including setup and examples, check out this detailed guide on CloudWatch custom metrics.
Core Components of SQS
To effectively utilize SQS, understanding its core components is essential:
- Queues: SQS queues are the fundamental containers for messages. There are two types:
- Standard Queues: Offer best-effort ordering (messages are generally delivered in the order they were sent) and at-least-once delivery (messages might be delivered more than once). They provide high throughput.
- FIFO (First-In-First-Out) Queues: Guarantee that messages are delivered exactly once, in the exact order they were sent. They have lower throughput compared to standard queues. FIFO queues must have the
.fifosuffix in their name.
- Messages: The data transmitted between services. Messages can contain up to 256 KB of text in any format (XML, JSON, unformatted text, etc.).
- Producers: Services or applications that send messages to the queue.
- Consumers: Services or applications that receive messages from the queue and process them.
How SQS Works
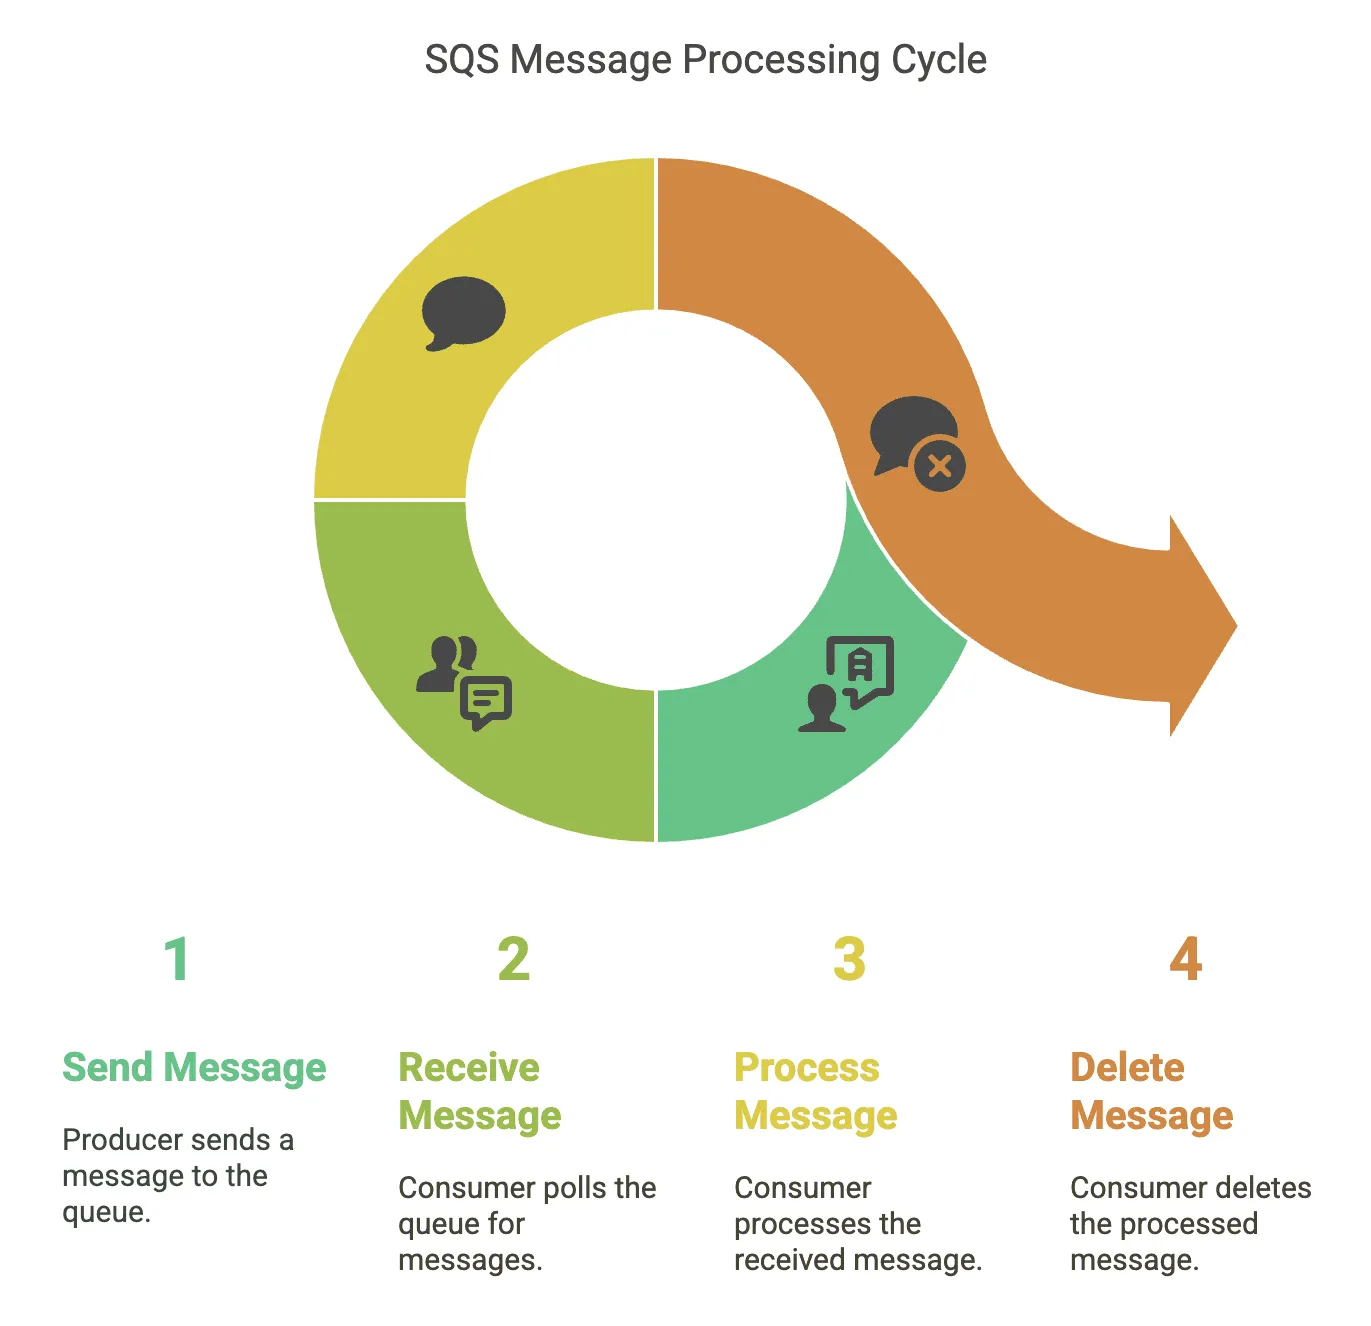
The basic workflow of SQS is as follows:
- Message Sending: A producer sends a message to an SQS queue using the
SendMessageAPI. The message is stored durably within the queue. - Message Receiving: A consumer polls the SQS queue using the
ReceiveMessageAPI. SQS returns one or more messages (up to the configured maximum). - Message Processing: The consumer processes the received message.
- Message Deletion: After successfully processing the message, the consumer deletes it from the queue using the
DeleteMessageAPI. This prevents the message from being processed again.
Key CloudWatch Metrics for SQS
CloudWatch gives you visibility into how your SQS queues are behaving over time. Instead of relying on guesswork or logs scattered across services, these metrics help you answer: Is the queue growing? Are consumers falling behind? Is something silently failing?
For most day-to-day operations, a few metrics do the heavy lifting:
NumberOfMessagesSenttracks how many messages are entering the queue. It’s a good way to spot changes in workload. A sudden drop might hint at upstream failures, while a spike could mean it’s time to scale out consumers.ApproximateNumberOfMessagesVisibleshows how many messages are waiting to be picked up. If this number stays above zero for too long, your consumers likely aren’t keeping up.ApproximateNumberOfMessagesNotVisibletells you how many messages are currently being processed but not yet deleted. High values here could mean consumers are slow, stuck, or not deleting messages properly.NumberOfMessagesReceivedshows how often consumers are polling and retrieving messages. Compare it withNumberOfMessagesSentto understand if your system is processing messages fast enough.NumberOfMessagesDeletedrepresents successfully processed messages. Ideally, this should closely follow the received count; if not, something’s breaking down after retrieval.
For deeper debugging, two metrics stand out:
ApproximateAgeOfOldestMessageis the canary. If this keeps climbing, messages are sitting in the queue too long, likely because processing can’t keep up.NumberOfEmptyReceivesmeasures how often consumers poll and find nothing. This usually means consumers are over-polling or aren’t in sync with actual traffic.
Does SQS Have CloudWatch Logs?
SQS doesn’t push log data into CloudWatch Logs by default like Lambda or API Gateway, but it does integrate tightly with CloudWatch Metrics, which cover most of what you’ll need for queue visibility.
Out of the box, every SQS queue sends key metrics to CloudWatch, with:
- One-minute granularity
- 15 months of historical retention
- Support for alarms and dashboards
That means you can track queue depth, message throughput, and processing lag without setting anything up.
If you need more precision or alerts, CloudWatch gives you options:
- Enable detailed monitoring for more granular data
- Set alarms on metrics like
ApproximateNumberOfMessagesVisibleorApproximateAgeOfOldestMessage - Use CloudWatch Logs Insights if you’re pulling in logs from consumers or related services and want to correlate patterns across queues.
Here’s an example of a simple alarm to notify you when the queue depth crosses a threshold:
aws cloudwatch put-metric-alarm \ --alarm-name "SQS-HighQueueDepth" \ --alarm-description "Alert when queue depth exceeds threshold" \ --metric-name ApproximateNumberOfMessagesVisible \ --namespace AWS/SQS \ --statistic Average \ --period 300 \ --threshold 100 \ --comparison-operator GreaterThanThreshold \ --dimensions Name=QueueName,Value=my-processing-queueThis kind of alarm helps you catch slow consumers before the backlog becomes a problem.
If you’re looking to understand how CloudWatch metrics behave, including features, pricing, and usage patterns, this CloudWatch metrics guide is a good place to start.
How to Check Messages in SQS
There are two ways to inspect messages in an SQS queue: through the AWS Console or programmatically via the SDK.
AWS Console (for quick inspection)
The console is useful for debugging or development:
- Go to the SQS section in the AWS Console.
- Select your queue.
- Click “Send and receive messages.”
- Use “Poll for messages” to retrieve visible messages.
- Click any message to view its content and metadata.
This is not intended for production monitoring, but it works well for spot checks.
Programmatic Access (recommended for production use)
Using the AWS SDK lets you process messages as part of your application. Here’s a Python example using boto3:
import boto3
sqs = boto3.client('sqs', region_name='us-east-1')queue_url = 'https://sqs.us-east-1.amazonaws.com/123456789012/my-queue'
response = sqs.receive_message(    QueueUrl=queue_url,    MaxNumberOfMessages=10,    WaitTimeSeconds=20  # Long polling to reduce empty responses)
for message in response.get('Messages', []):    print(f"Message ID: {message['MessageId']}")    print(f"Body: {message['Body']}")
    # Delete the message after successful processing    sqs.delete_message(        QueueUrl=queue_url,        ReceiptHandle=message['ReceiptHandle']    )
This is a standard pattern: poll the queue, handle the messages, and explicitly delete each one to prevent retries.
Monitoring Message Volume
To monitor queue depth over time, use the CloudWatch API. Here’s a Node.js example that fetches the ApproximateNumberOfMessagesVisible metric:
const AWS = require("aws-sdk");const cloudwatch = new AWS.CloudWatch();
async function getQueueDepth(queueName) {  const params = {    Namespace: "AWS/SQS",    MetricName: "ApproximateNumberOfMessagesVisible",    Dimensions: [{ Name: "QueueName", Value: queueName }],    StartTime: new Date(Date.now() - 3600000),    EndTime: new Date(),    Period: 300,    Statistics: ["Average"],  };
  const result = await cloudwatch.getMetricStatistics(params).promise();  return result.Datapoints;}
This gives you visibility into queue growth or backlogs over time, useful for dashboards or automated scaling decisions.
For queues that trigger workflows or manage async tasks, this AWS Step Functions guide covers how to coordinate them reliably.
When Built-In Metrics Aren’t Enough
SQS gives you the basics out of the box, metrics like message volume, queue depth, and visibility timeouts. But in practice, that’s often not enough. If you want better alerting, clearer visibility, or metrics that reflect what your application is doing, custom metrics are the way to go.
They let you measure metrics like processing latency, failure patterns, or the efficiency of batch jobs, all tied to your business logic, not just AWS internals.
Track How Long Messages Take to Process
Built-in metrics stop at the queue. To measure what happens after a message is picked up, you’ll need to track it yourself.
import time, boto3
cloudwatch = boto3.client('cloudwatch')
def publish_processing_time(queue_name, processing_time_ms):    cloudwatch.put_metric_data(        Namespace='Custom/SQS',        MetricData=[{            'MetricName': 'MessageProcessingTime',            'Dimensions': [{'Name': 'QueueName', 'Value': queue_name}],            'Value': processing_time_ms,            'Unit': 'Milliseconds'        }]    )
# Inside your consumer:start = time.time()# process the messageduration = (time.time() - start) * 1000publish_processing_time('my-queue', duration)
This gives you actual processing time, not just queue wait time. Useful for setting alerts when things slow down.
Monitor Dead Letter Queue Failures
If messages are landing in your DLQ, you want to know why and how often. You can track error types and queue names to spot patterns.
def track_dlq_patterns(queue, error_type, count): cloudwatch.put_metric_data( Namespace='Custom/SQS/DLQ', MetricData=[{ 'MetricName': 'ProcessingFailures', 'Dimensions': [ {'Name': 'SourceQueue', 'Value': queue}, {'Name': 'ErrorType', 'Value': error_type} ], 'Value': count, 'Unit': 'Count' }] )You could also tie this into your exception handler to automatically record failures by type.
Application-Level Events
Not everything needs to be about performance. Sometimes you just want to track where things are in a pipeline. Example: tracking how many orders hit each stage of processing.
def track_order_stage(stage, queue_name): cloudwatch.put_metric_data( Namespace='Business/OrderProcessing', MetricData=[{ 'MetricName': 'OrdersInStage', 'Dimensions': [ {'Name': 'ProcessingStage', 'Value': stage}, {'Name': 'Queue', 'Value': queue_name} ], 'Value': 1, 'Unit': 'Count' }] )This is great for dashboards when you care more about workflow health than raw queue stats.
Measure Batch Efficiency
If you process messages in batches, it helps to track how efficient that is; messages per second gives you a quick signal.
def track_batch_efficiency(queue_name, messages_in_batch, processing_time_sec): efficiency = messages_in_batch / processing_time_sec cloudwatch.put_metric_data( Namespace='Custom/SQS/Performance', MetricData=[{ 'MetricName': 'BatchProcessingEfficiency', 'Dimensions': [{'Name': 'QueueName', 'Value': queue_name}], 'Value': efficiency, 'Unit': 'Count/Second' }] )You’ll start to see how processing times vary by load or downstream latency.
Visualize It
Once you’re sending custom metrics, build a dashboard to track them. You can mix AWS and custom namespaces in the same widget:
import json
cloudwatch.put_dashboard(    DashboardName='SQS-Custom-Metrics',    DashboardBody=json.dumps({        "widgets": [{            "type": "metric",            "properties": {                "metrics": [                    ["Custom/SQS", "MessageProcessingTime", "QueueName", "my-queue"],                    ["AWS/SQS", "ApproximateNumberOfMessagesVisible", "QueueName", "my-queue"]                ],                "period": 300,                "stat": "Average",                "region": "us-east-1",                "title": "Processing Performance"            }        }]    }))
That’s all it takes to connect what’s happening inside your system with what CloudWatch can show.
To track who accessed your queues and when, this AWS CloudTrail guide explains how to audit and trace API activity.
Use Cases of Amazon SQS
SQS is suitable for a wide range of use cases, including:
- Order Processing: Decoupling order placement from fulfillment.
- Image/Video Processing: Offloading media processing tasks to background workers.
- Log Aggregation: Collecting logs from multiple sources and processing them asynchronously.
- Event Notification: Notifying services about events in other parts of the system.
- Batch Processing: Distributing large batch jobs across multiple workers.
Benefits of Monitoring SQS Properly
SQS is often set-and-forget, but queues play a critical role in how distributed systems behave under load. Monitoring gives you the signals you need to understand that behavior and make informed decisions when things change.
Here are a few areas where good SQS monitoring makes a difference:
- Queue health
Metrics like queue depth and message age provide a reliable view of how well producers and consumers are keeping up. They help spot slowdowns before they cascade through the system. - Resource efficiency
Observing polling behavior and processing rates makes it easier to tune consumer performance and avoid unnecessary scaling or idle capacity. - Operational visibility
When an incident occurs, SQS metrics offer context—what backed up, how quickly it built up, and whether messages were processed or retried. - Scalability insights
Historical trends can inform scaling decisions and highlight patterns in workload, helping teams configure auto-scaling or adjust concurrency settings with confidence. - Resilience and uptime
With the right alerts in place, teams can respond quickly to unusual patterns, preventing minor issues from turning into major outages.
Final Thoughts
Monitoring SQS doesn’t need to be complicated, but it does need to be intentional. Start with CloudWatch’s built-in metrics to get visibility into queue depth, message age, and processing behavior.
The payoff? Less time spent chasing down issues, more predictable scaling, and a clearer view of how your systems behave under load.
If you’re dealing with high-throughput queues or distributed workloads, Last9 can help turn that telemetry into something useful—aggregating metrics, reducing noise, and making sure the right alerts reach you at the right time.
Book a time with us, or start for free and try it at your own pace.
FAQs
Q: What does SQS stand for?
Simple Queue Service. It’s AWS’s managed message queuing service that handles message delivery between distributed system components without requiring you to manage the underlying infrastructure.
Q: What are metrics in AWS CloudWatch?
CloudWatch metrics are time-series data points that measure various aspects of your AWS resources. For SQS, metrics track queue depth, message age, throughput, and error rates with timestamps and values.
Q: Does SQS have CloudWatch logs?
SQS doesn’t generate CloudWatch logs by default, but you can enable logging for API calls via CloudTrail. For message-level logging, you’ll need to implement logging in your application code that processes the messages.
Q: How to check SQS messages?
Use the AWS CLI (aws sqs receive-message), AWS Console, or SDK calls. For monitoring purposes, use CloudWatch metrics like ApproximateNumberOfMessagesVisible rather than polling individual messages.
Q: How to create a custom metric for SQS?
Use the CloudWatch put-metric-data API from your application code. For example, track processing time or business-specific metrics like order values processed per minute alongside standard SQS metrics.
Q: How do Amazon SQS queues work?
SQS stores messages in a distributed system. Producers send messages to queues, consumers poll for messages, process them, and delete them when complete. Messages become invisible during processing and return to the queue if not deleted within the visibility timeout.
Q: How do I import my AWS logs from S3 to CloudWatch Logs groups?
Use the CloudWatch Logs agent or AWS CLI to import log files from S3. However, for SQS monitoring, focus on CloudWatch metrics rather than logs since SQS operations are better tracked through metrics than log entries.
Q: How can I monitor which types of messages are in my Amazon SQS queue?
SQS metrics don’t show message content types. Implement custom CloudWatch metrics in your application to track message types, or use message attributes and custom dashboards to categorize your message processing.
Q: How can I troubleshoot Amazon SQS issues that have SSE activated?
SSE (Server-Side Encryption) issues typically show up as access denied errors rather than in SQS metrics. Check IAM permissions for KMS keys and ensure your consumers have decrypt permissions. Monitor failed receive attempts through error rates.
Q: How do I troubleshoot and prevent Amazon SQS queue access issues when using a Deny queue policy?
Monitor NumberOfEmptyReceives spikes, which can indicate access issues. Use CloudTrail to track API access attempts and check queue policies for overly restrictive deny statements that might block legitimate access.
Q: What are the key CloudWatch metrics for monitoring Amazon SQS performance?
Focus on ApproximateAgeOfOldestMessage (processing health), ApproximateNumberOfMessagesVisible (queue depth), NumberOfMessagesSent to DLQs (error rate), and ApproximateNumberOfMessagesNotVisible (processing load).
Q: What are the key Amazon SQS metrics to monitor in CloudWatch?
The essential metrics are message age, visible message count, invisible message count, and dead letter queue activity. These four metrics together give you early warning of processing issues, capacity problems, and error patterns.

