Kubernetes Monitoring Metrics That Improve Cluster Reliability
Understand Kubernetes monitoring metrics that help detect issues early, improve reliability, and keep your cluster performing at its best.
Anjali Udasi

What is APM Tracing?
Understand APM tracing to see how a request moves through services, helping you spot delays, errors, and bottlenecks quickly.
Faiz Shaikh

A Single Hub for Telemetry: OpenTelemetry Gateway
Understand how the OpenTelemetry Gateway unifies metrics, logs, and traces, giving you one control point for all telemetry data.
Anjali Udasi

A Practical Guide to Python Application Performance Monitoring(APM)
Monitor, debug, and optimize Python apps in production with APM—track transactions, DB queries, errors, and external calls.
Anjali Udasi

What is Database Monitoring
Database monitoring tracks performance, health, and availability, helping detect issues early and maintain optimal operations.
Anjali Udasi

OpenTelemetry API vs SDK: Understanding the Architecture
Understand how the OpenTelemetry API and SDK work together, clean instrumentation in code, and flexible data processing in configuration.
Anjali Udasi

APM Logs: How to Get Started for Faster Debugging
Understand how APM logs connect metrics, traces, and events to speed up debugging and uncover root causes faster.
Anjali Udasi

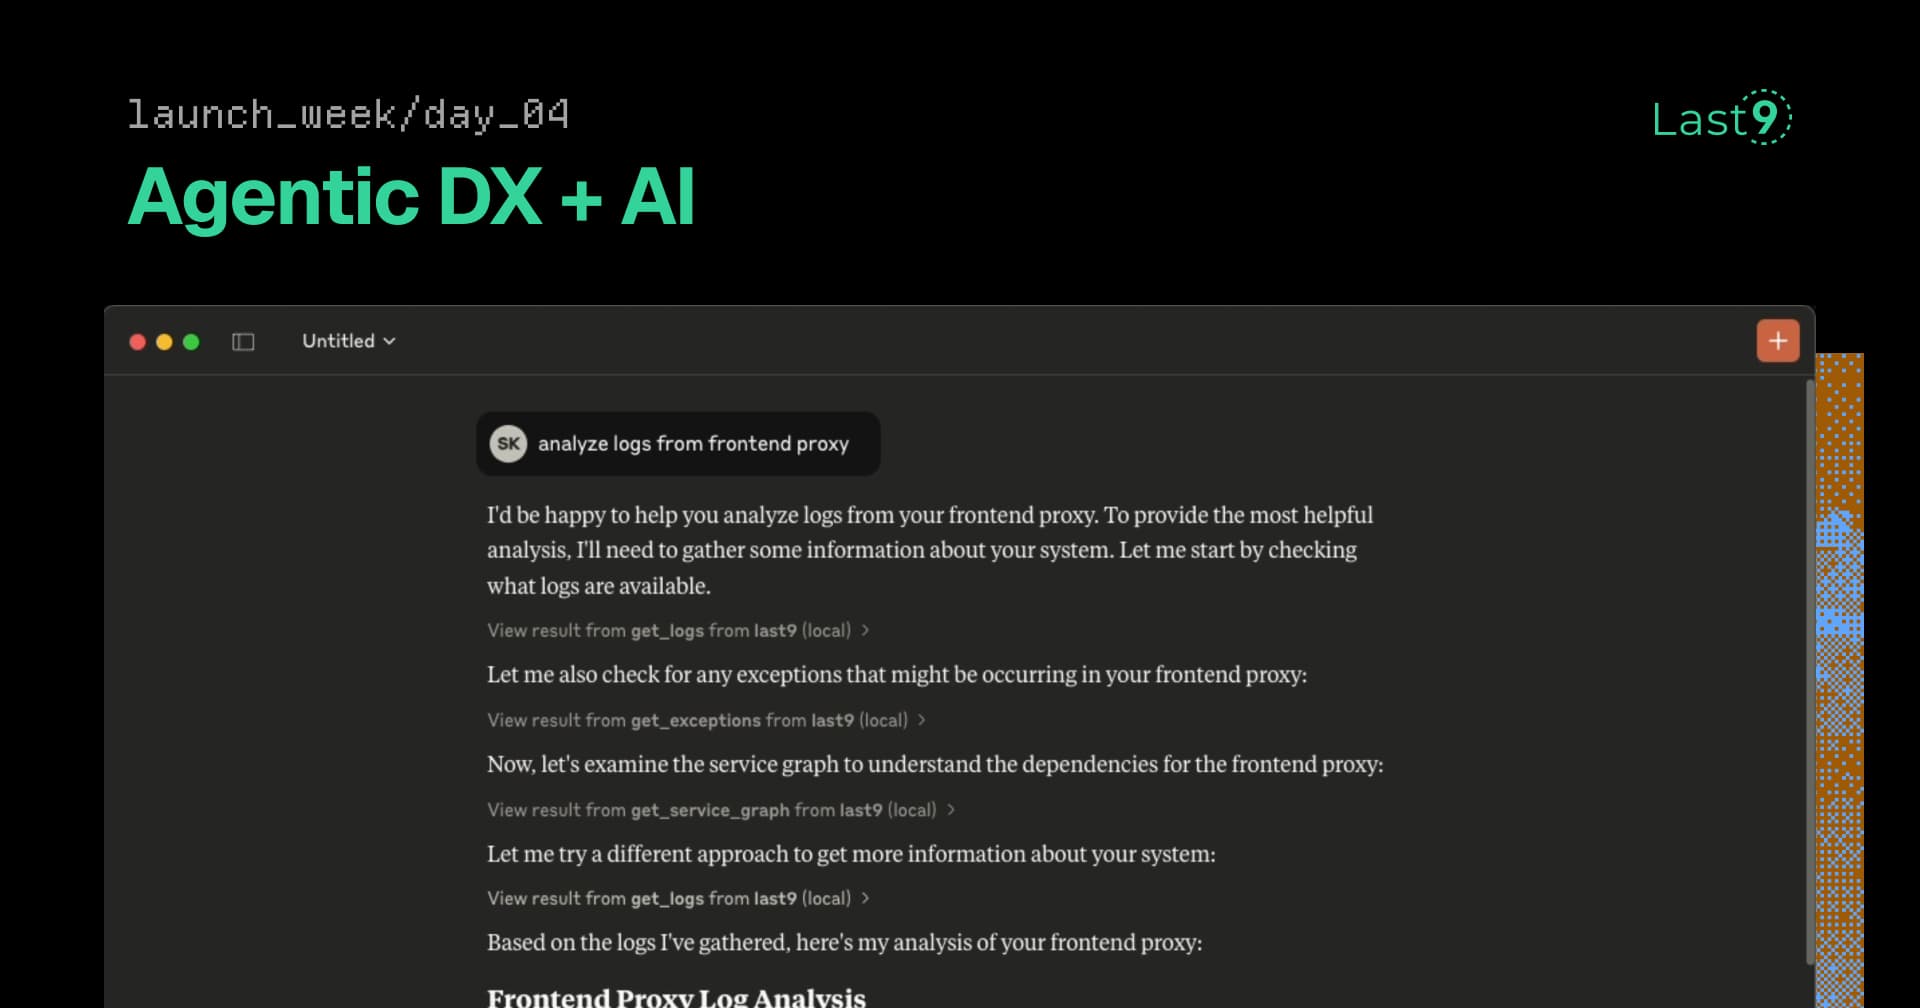
From Cloud Native to AI Native: Why Your Observability Stack Needs to Speak Agent
Your production telemetry now speaks agent: ask questions in Slack, debug in VS Code, optimize in real-time. Same data, conversational interface.
Nishant Modak

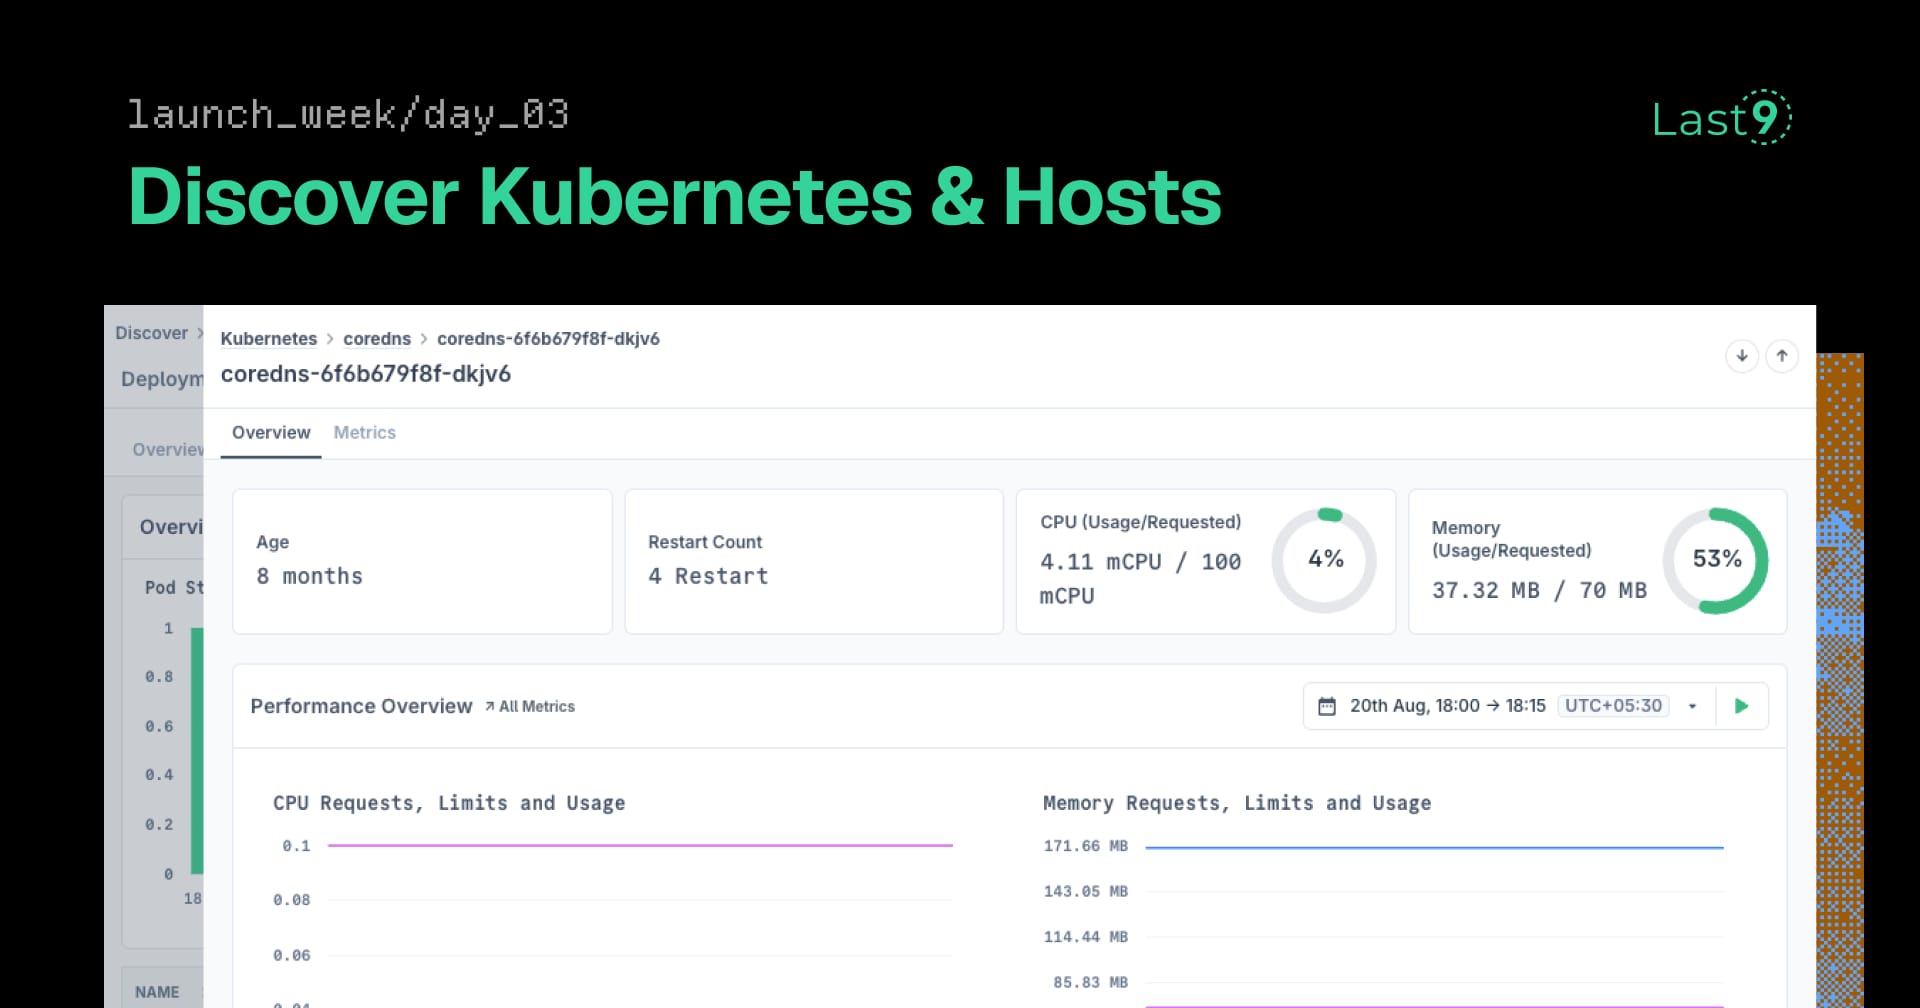
Your Apps Are Green. Your Infrastructure Is Dying.
Infra problems hide behind green dashboards. Discover Infrastructure monitors K8s and hosts from the same telemetry—unified visibility, AI-powered debugging.
Nishant Modak