Cloud-native end-to-end distributed tracing
Gain real-time insights into performance issues and root causes. Correlate traces with logs, metrics, and events in a single pane.

Unblock bottlenecks. Unlock performance.


Identify root causes quickly with correlated telemetry
- Improve MTTR with single pane for distributed traces with correlated logs and metrics without changing context or tools.
- Fast searching and filtering on attributes and resources with support for all operators.
- Understand upstream and downstream impacts with service relationships and execution times.


Improve application performance & user experience
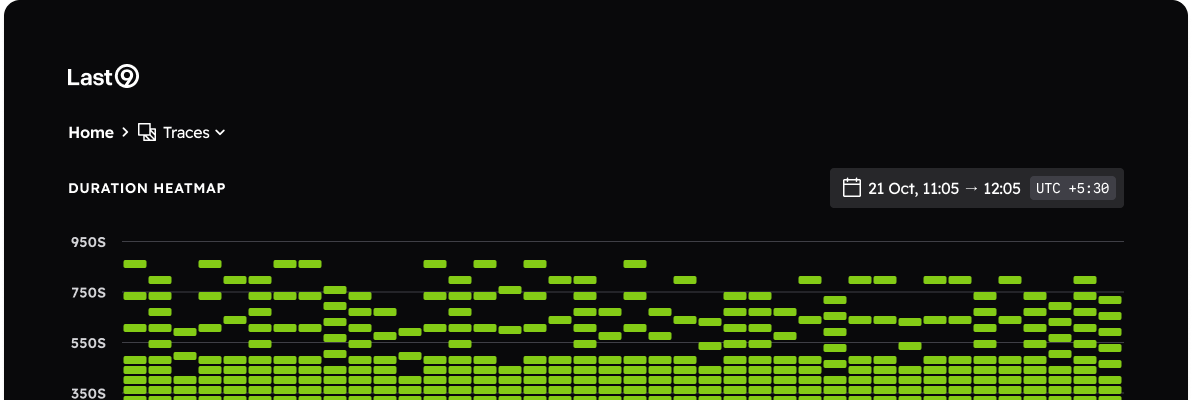
- Latency hotspot identification with waterfall charts to discover bottlenecks and throttled connections causing slowdowns.
- Use span events to identify key stages in a request's lifecycle and highlight state changes.
- Create real-time dashboards and set proactive alerts with anomaly detection using the Traces to Metrics pipeline.


Get visibility into your distributed systems
- Monitor async and parallel interactions between services, APIs, database queries, network calls, and more.
- Increase visibility between teams for faster development, troubleshooting, and system management.
- Isolate environment and deployment information.
Last9 helped us forget all the different observability tools and consolidate every dashboard into one single place.
Rahul Mahale
Principal DevOps Engineer
Manage your traces data & its lifecycle at scale


All your traces always, at scale and cost-effective
- No sampling, gain granular observability by ingesting and analyzing millions of spans per minute.
- Simple pricing model, no per-host billing, no per-user billing.
- Post 14-days default retention, cost-effectively retain traces for long-term on your AWS S3 with on-demand rehydration.


Ingest from 50+ integrations, manage trace pipelines at run-time
- OpenTelemetry native, 50+ sources to ingest traces from, with auto instrumentation.
- Define pre-ingestion rules to identify traces with matching patterns for filtering traces to forward or drop them, even before its stored in the Last9 telemetry data platform.
- Remap traces to extract information and enrich attributes for faster resolution of issues.


Industry-standard privacy and security
- Supports SOC2 Type 2 and PCI compliance.
- Manage user access with allowlist and blocklist controls.
- Pre-ingestion workflows to skip ingestion of sensitive information or label and directly forward to secure storage for security purposes.
Learn more about the product
A first-class experience for a single pane of glass. End-to-end telemetry management to control your observability data and its costs.
Stream, store, and analyze millions of logs per minute without worrying about things breaking, including your bank account.
Never compromise on high cardinality metrics data again just because your observability tool could not handle them.
An end-to-end alerting tool built to tackle high cardinality use cases. Designed to reduce alert fatigue and improve Mean Time to Detect.

Start observing for free. No lock-in.
Just update your config. Start seeing data on Last9 in seconds.
We've got you covered. Bring over your dashboards & alerts in one click.
100+ integrations. OTel native, works with your existing stack.
 Gartner Cool Vendor 2025