Vibe monitor production issues on a local codebase
Fix issues faster with AI. Seamlessly bring real-time production context, logs, metrics, and traces into your local environment to auto-fix code faster.

Vibe-check for users' issues
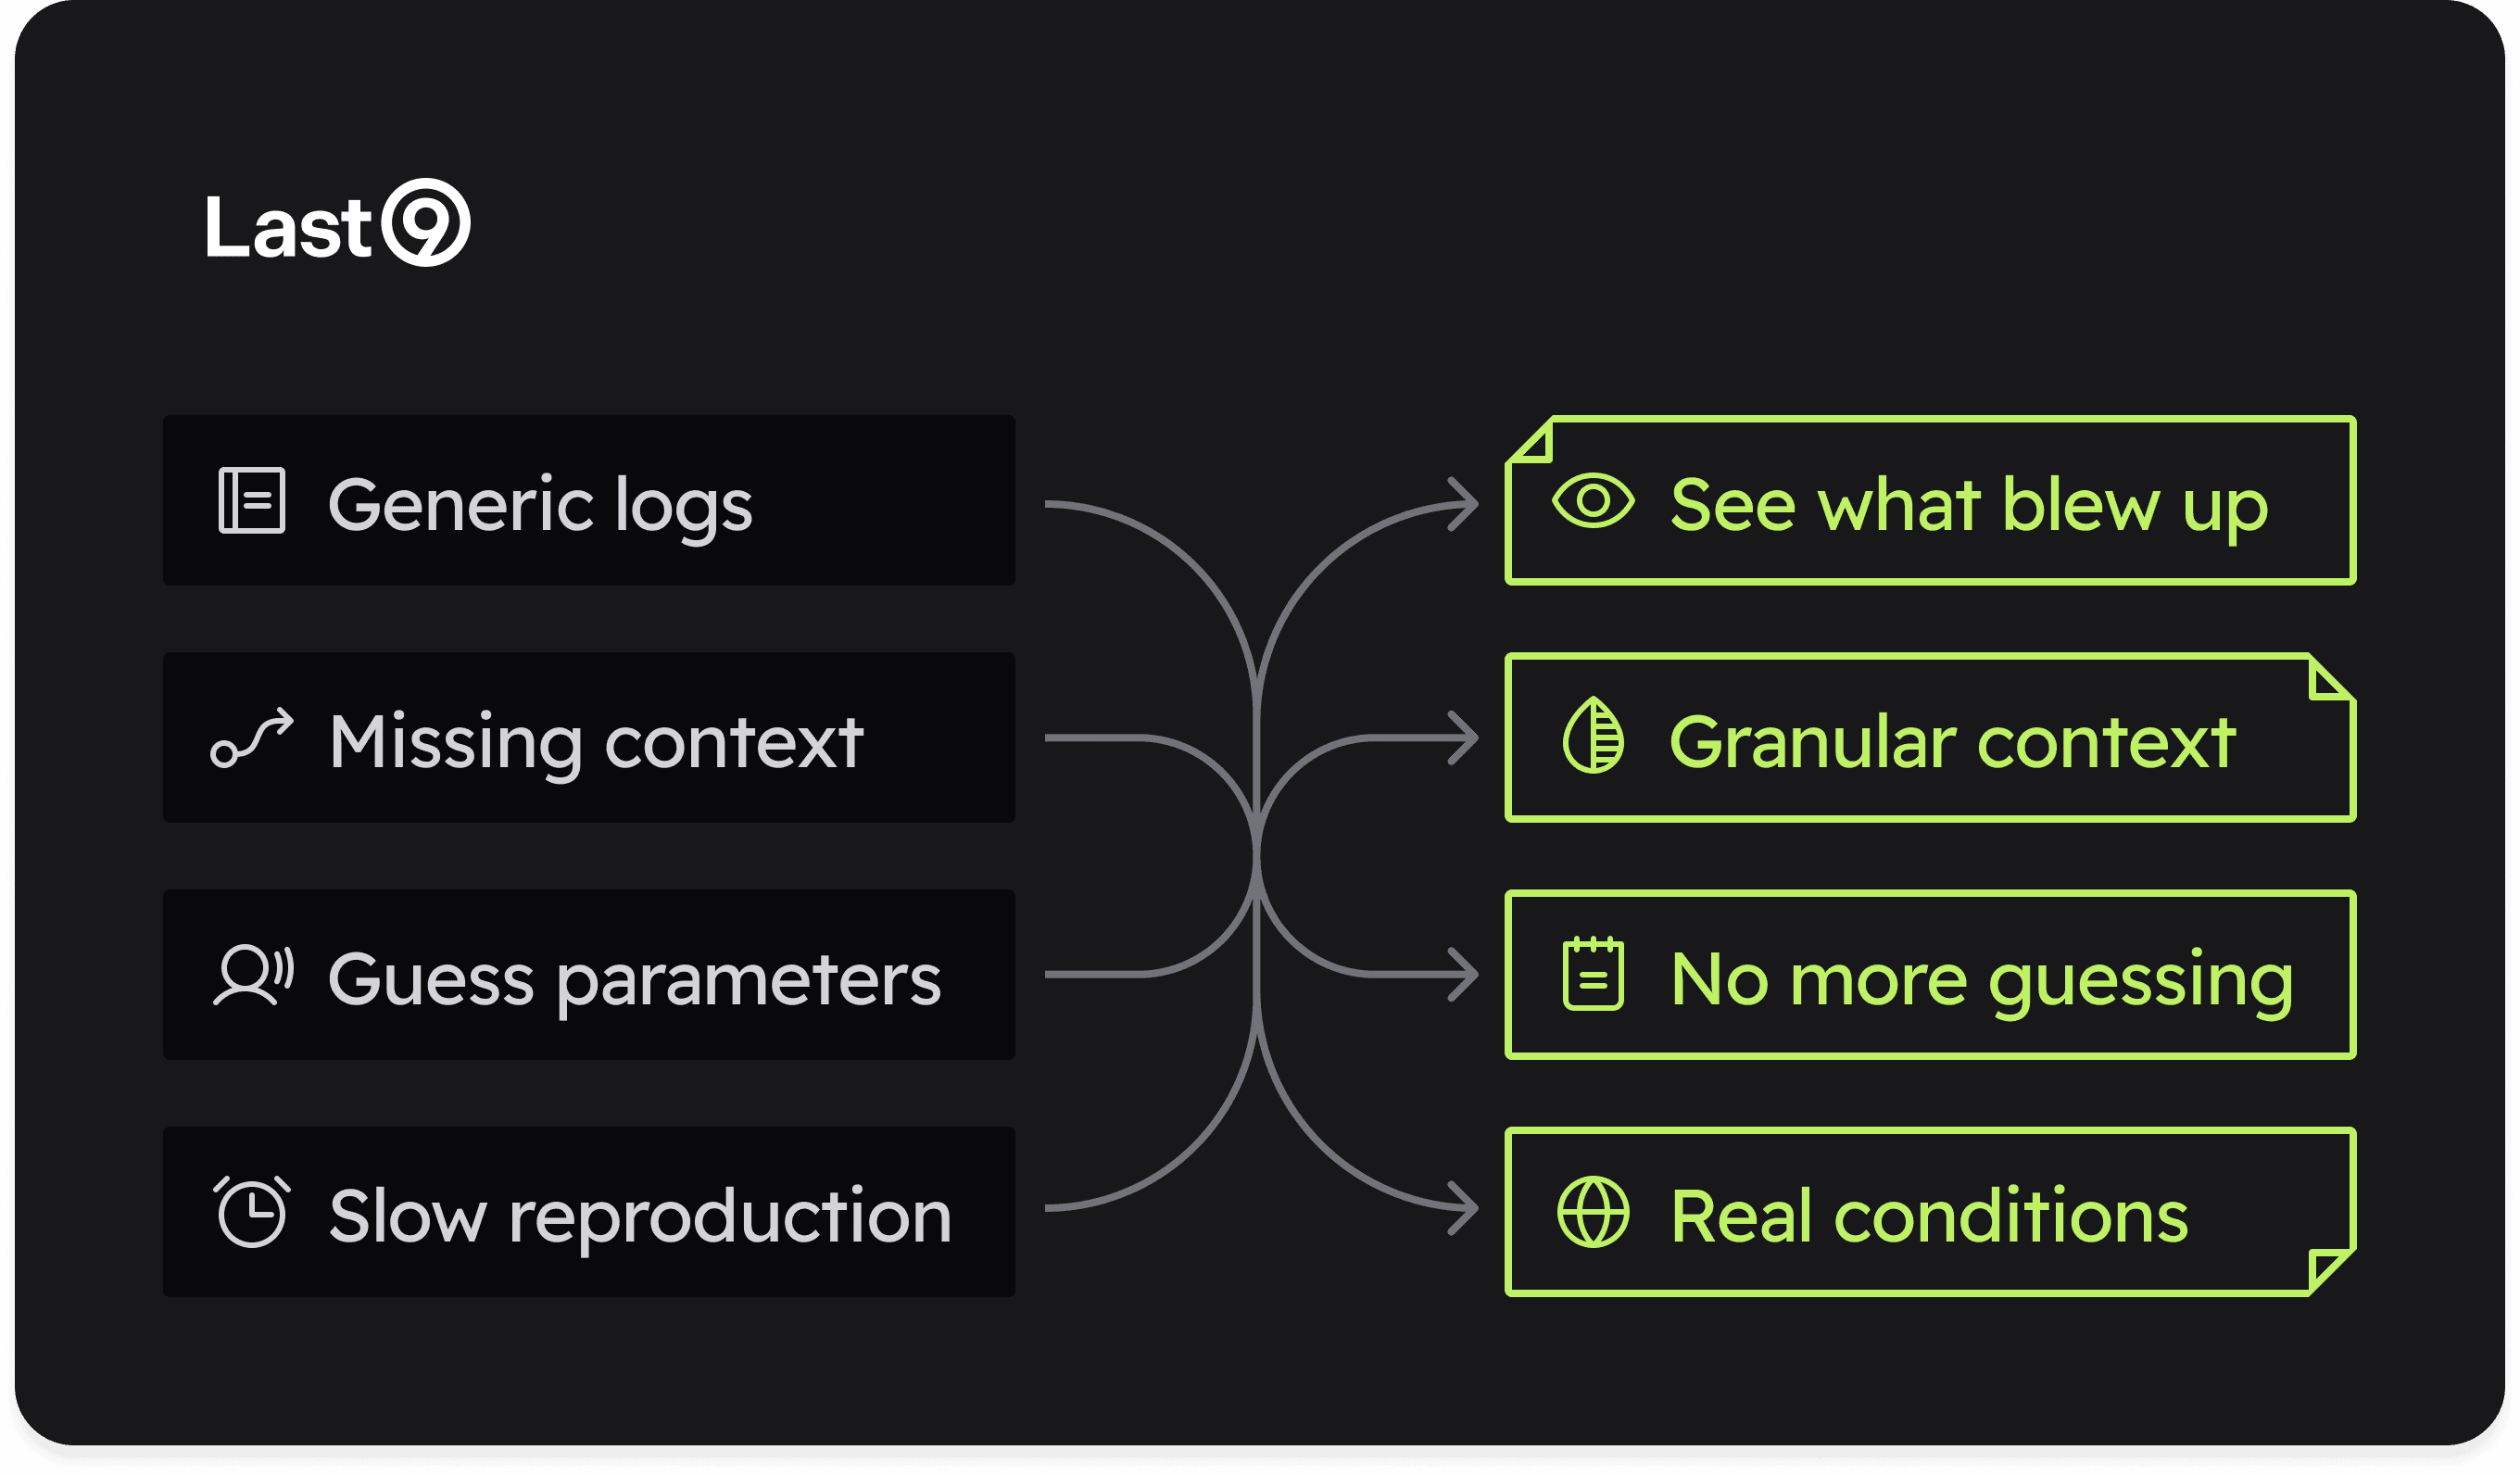
Feel the pulse of production without breaking your flow. Bring the right signals directly to your local dev environment. With Last9 MCP, your agent delivers production context to your workspace, allowing you to see service relationships, trace actual issues, and fix real problems without tab-hopping or context switching.
Stay in the zone. Feel the vibe of your systems. Fix what matters, much faster.
Get Started
Follow our guide to using the Last9 Observability MCP with either Claude Desktop, Cursor, Windsurf, or VS Code.
Get server-side exceptions over a specified time range
Get service summary with throughput, error rate, and response time
Get available service environments within a specified time range
Get detailed performance metrics for a specific service
Get operations summary for HTTP endpoints, database queries
Get service dependency graph showing incoming and outgoing dependencies
Track deployments and system modifications to correlate with issues
Execute Prometheus range queries for metrics over a time period
Execute Prometheus instant queries at a specific point in time
Get all label values for a specific label name
Get all available label names
Get logs filtered by service name and/or severity level
Retrieve raw log entries for a specific service with advanced filtering
Get drop rules for what logs get filtered out
Create a drop rule for logs at Control Plane
Get available log attribute names for filtering and analysis
Retrieve traces by trace ID or service name within a time range
Query traces for a specific service to debug performance
Get available trace attributes for filtering and querying
Get all configured alert rules from Last9
Get currently active alerts from the monitoring system
Auto optimize your production logging with Last9 MCP
1:09Talk to your agent and fix production issues in your local environment
2:02Analyze alert rules and reduce alert fatigue with Last9 MCP
1:36
Start observing for free. No lock-in.
Just update your config. Start seeing data on Last9 in seconds.
We've got you covered. Bring over your dashboards & alerts in one click.
100+ integrations. OTel native, works with your existing stack.
 Gartner Cool Vendor 2025