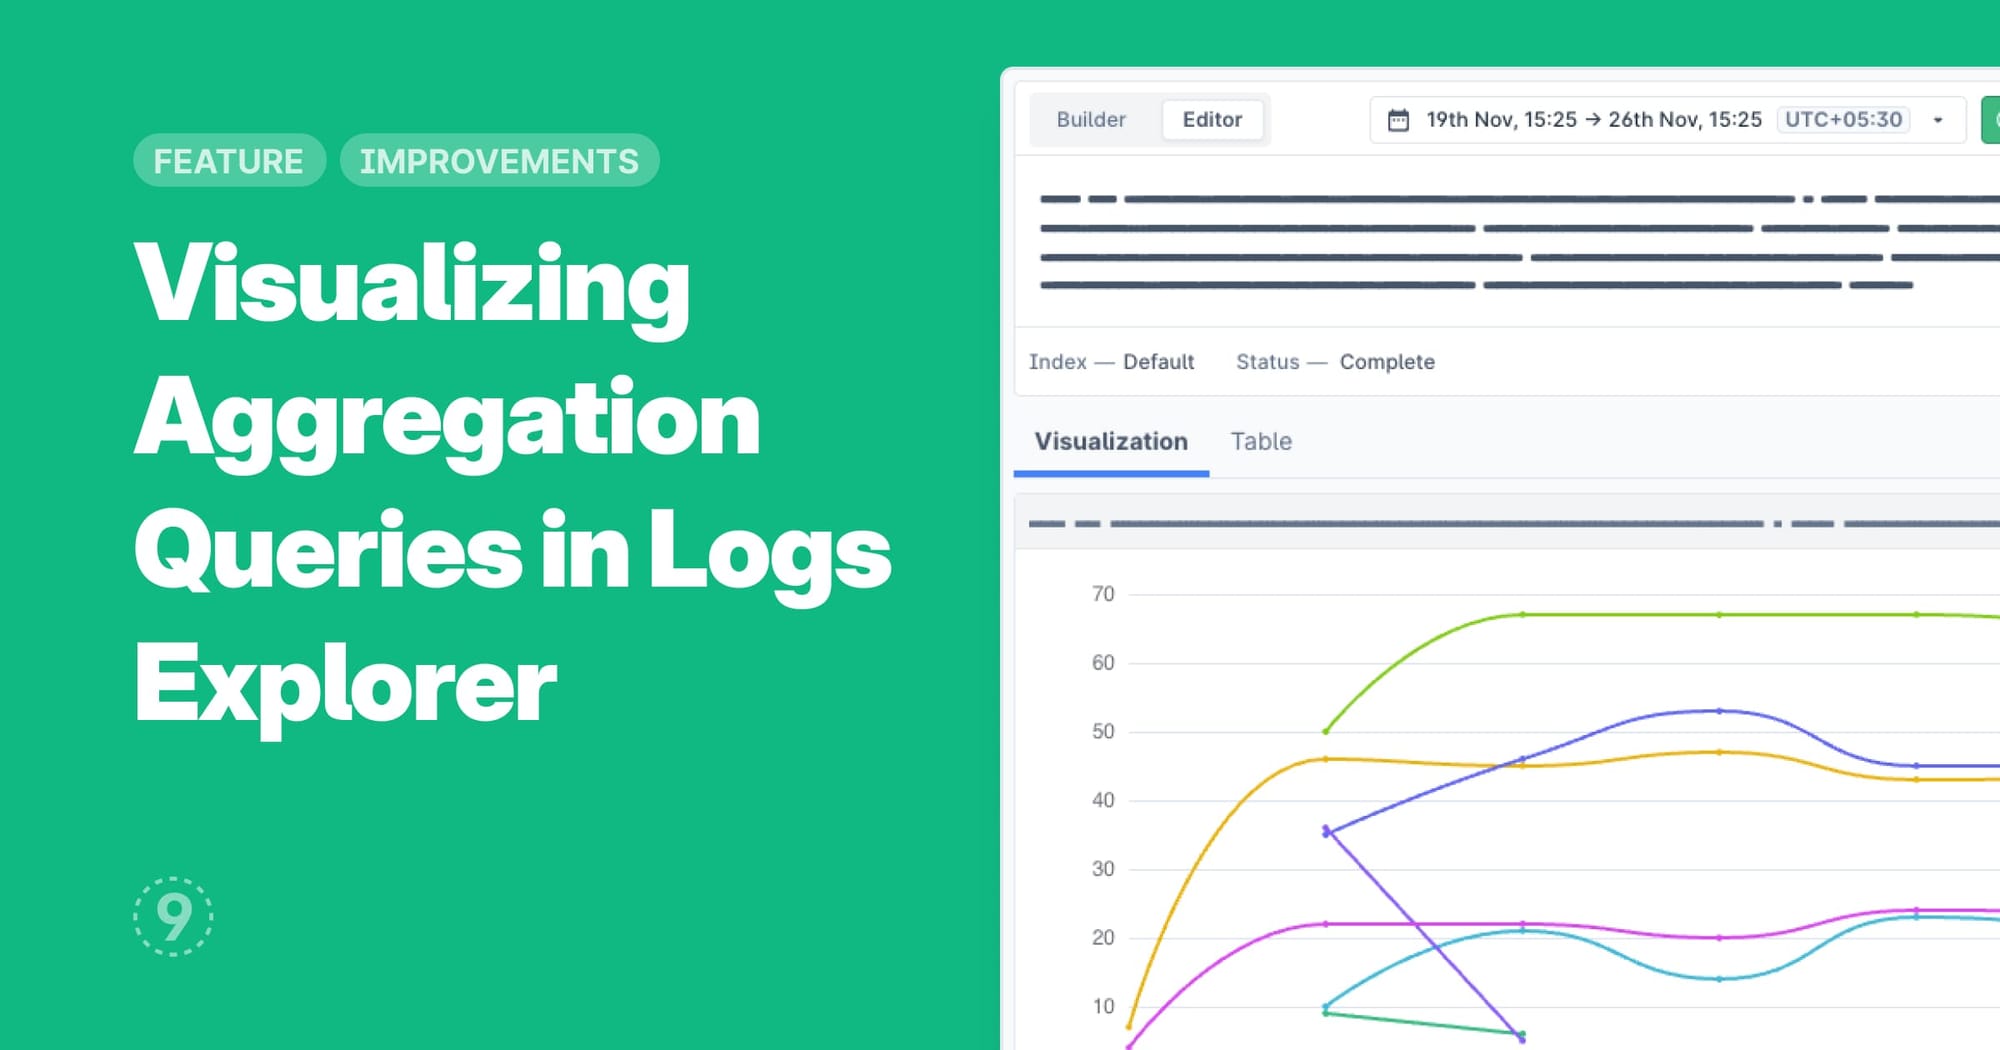
While using Builder mode or writing queries in Editor mode without aggregation functions, you view individual log lines as the output. But when you’re using the aggregation functions, the same log data is transformed and grouped, consolidating multiple log lines in to metric-style data — better for monitoring trends and patterns.
You can now view the data as a line chart as well, apart from the existing table.
Improvements
- Added support to sort and filter columns in the table view while viewing aggregation queries.
- Volume chart looks a little more pleasant to the eyes for shorter time ranges.
