
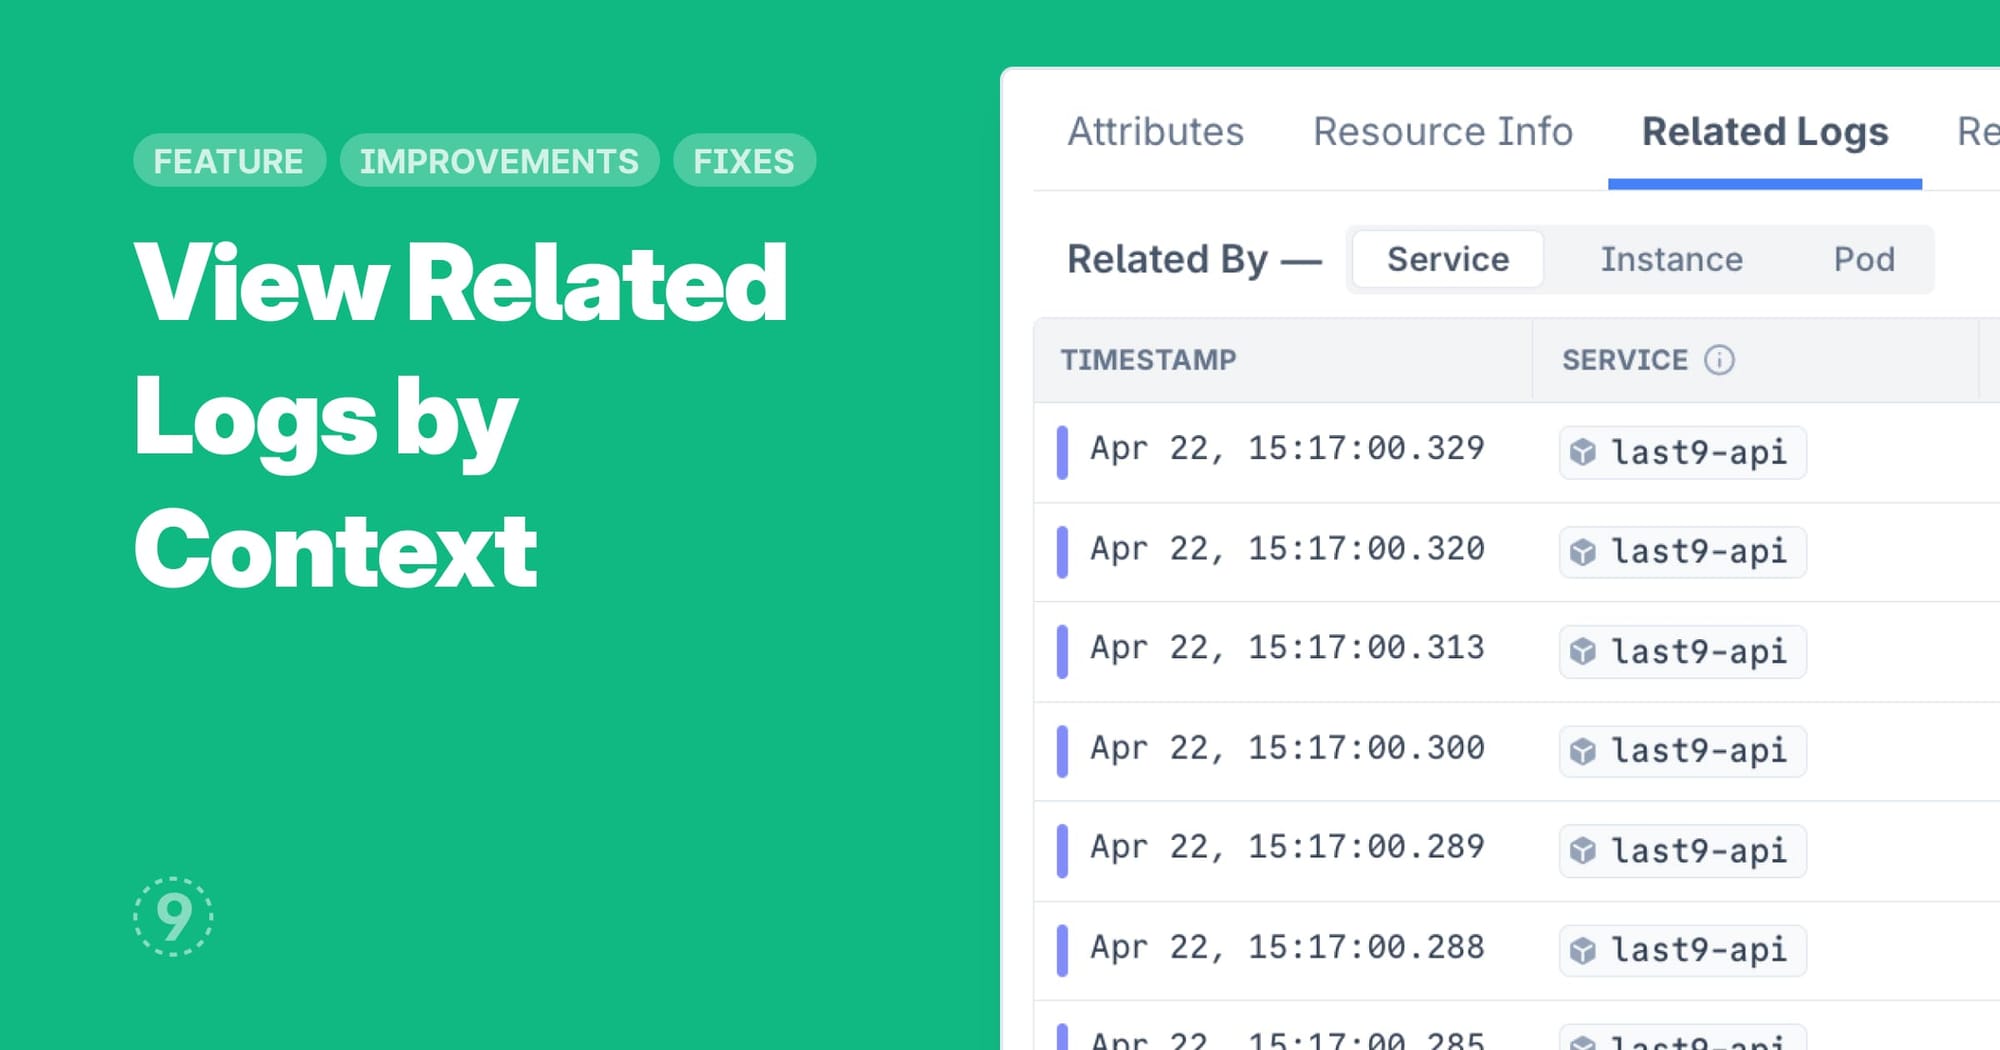
Troubleshooting distributed systems often means jumping between different views and manually correlating information across services, instances, pods, and traces. This context switching slows down your debugging workflow and makes it harder to get the full picture.
Now, while viewing the Log Details side panel, you can view related logs by service, instance, pod, or trace ID — giving you instant context without leaving your current workflow. This feature creates a seamless debugging experience by connecting the dots between different parts of your system automatically.
Improvements
- Scheduled Search & Query Library:
- Added query edit mode for better saved query management
- Alert editing capabilities for saved queries
- Scheduled searches now automatically deleted when associated saved query is removed
- Logs Explorer:
- Time selection now supports second-level precision for more accurate troubleshooting
- Dashboards:
- Panel positions now saved globally for all users
- Selected variable values preserved for everyone
- Previously, these settings were only saved locally for the user making the change
Fixes
- Traces Explorer:
- Traces with a large no of spans would not show up in the traces explorer even though matching child spans would be visible in the distribution heatmap
- Certain characters in span attribute not handled properly and hence not displaying matching results in trace explorer
- Dashboards:
- Dependent variable retains previous value when parent variable value is changed and the dependent variable has no matching value and yet doesn't reset to an available value or show as empty
- Logs Explorer:
- Live tail would not show results for very low volume of logs