
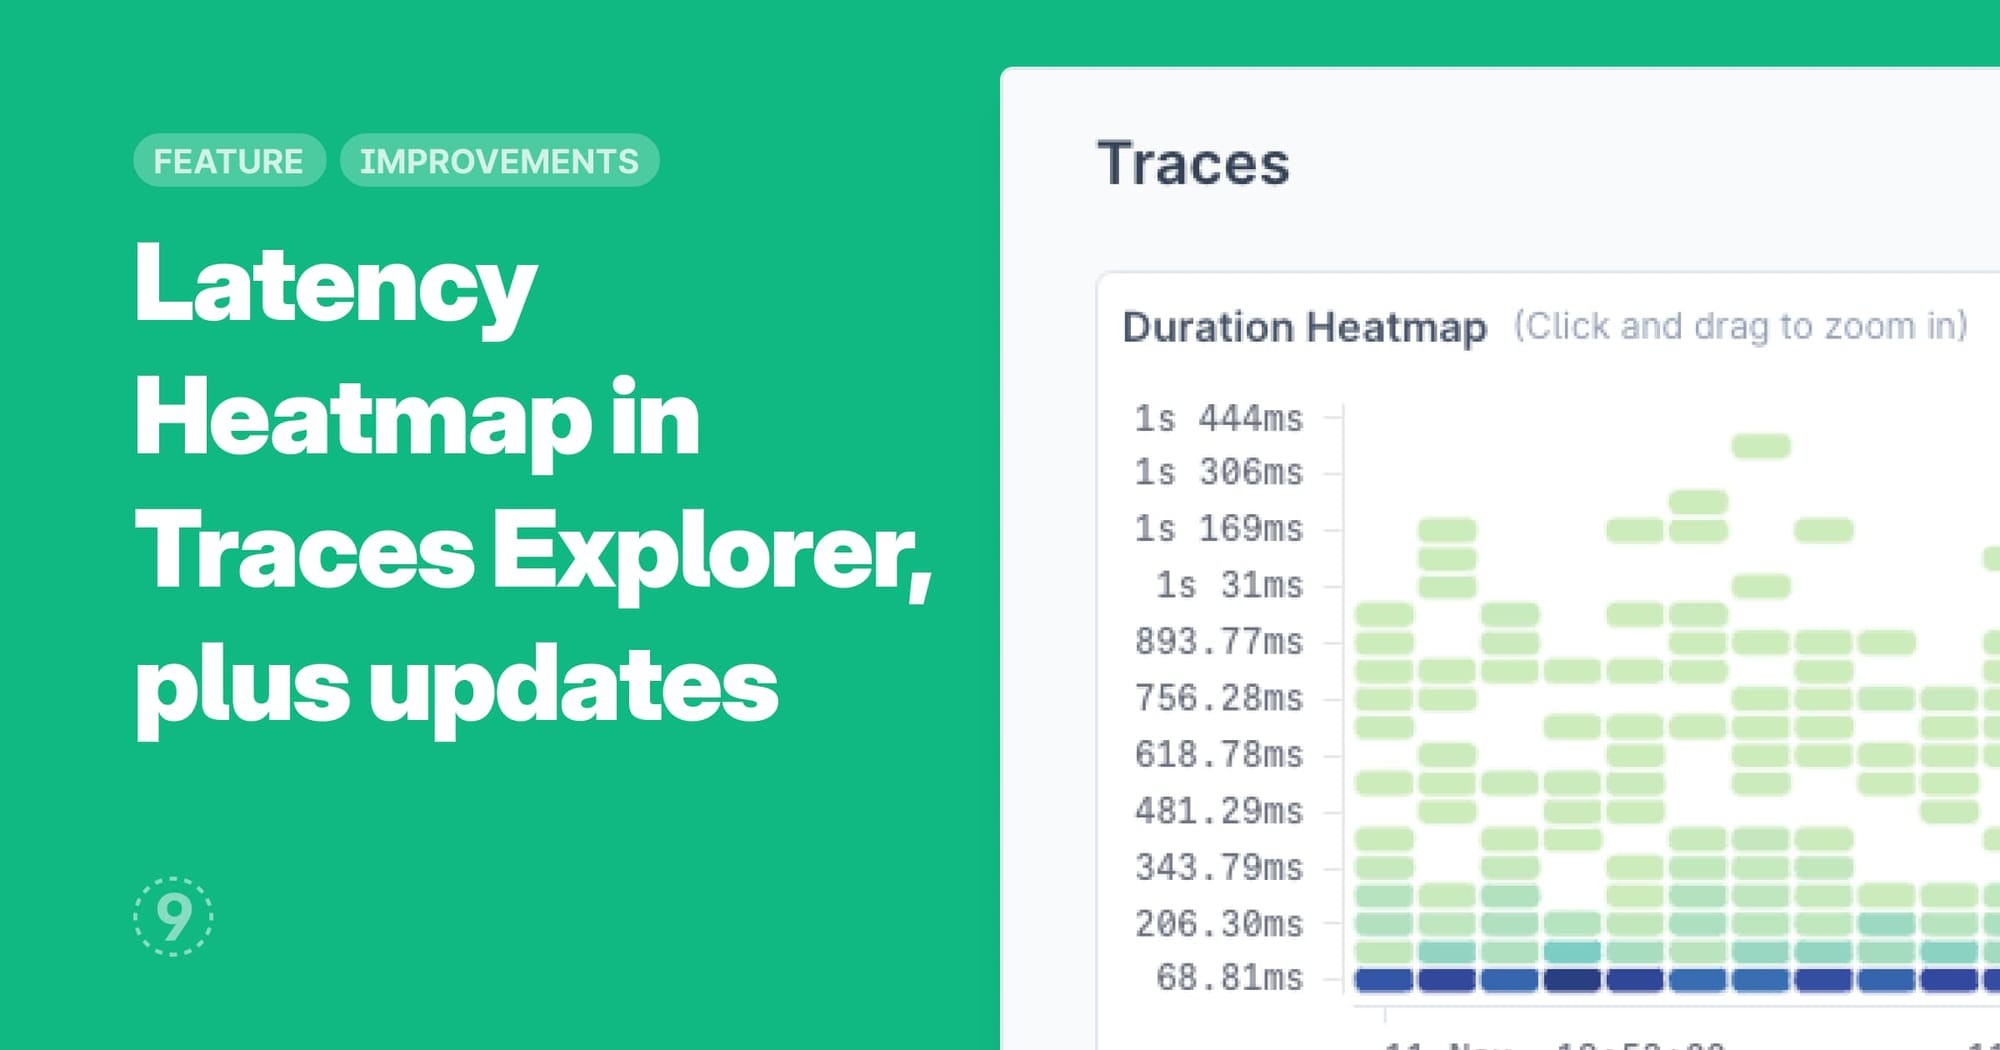
Latency Distribution Heatmap in Traces
You can now view a latency distribution heatmap in the Traces Explorer. In early tests with some users, they found it to be a powerful feature unlocking a couple of key advantages:
- Distribution Visibility
- See the complete spread of latencies at a given point in time
- Identify multiple performance modes that would be otherwise hidden by averages when viewed in a line/area graph chart
- Distinguish between systemic slowdowns vs isolated high-latency traces
- Pattern Detection
- Immediately see if latency increases affect all request eequally or just a subset
- Understand if performance degradation is gradual or sudden
- Identify if the system has consistent performance or variable behavior
Improvements to Related Metrics
While viewing the Related Metrics in the Log Details side panel, we’ve made some updates:
- Display the node, container, or pod name next to each section title
- Synchronized crosshairs between all the charts
- Touch ups to the overall look and feel, including better chart colors