
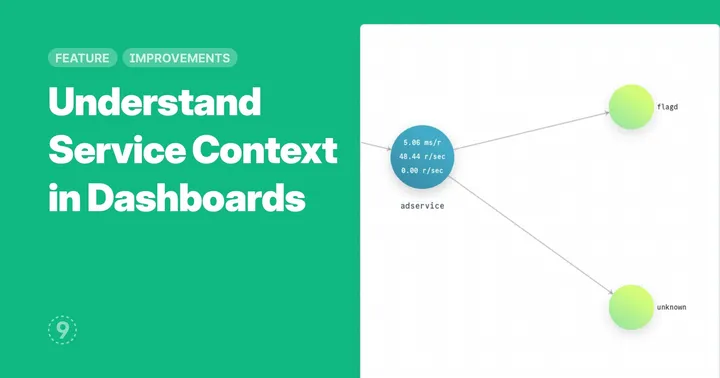
While viewing a dashboard, you can click on the Service Context at the top right to view a service graph with downstream and upstream dependencies of the current service selected in the dashboard. Key metrics like response time, throughput, and error rate are visible on the current service node by default, and you can hover on a dependency node to see the same metrics of the relationship.
With this, you can now quickly see how services interact with each other, making it easier to understand the application architecture and potential bottlenecks, further helping with performance monitoring and troubleshooting.
Improvements
- Collapse or expand all sections in a Dashboard.
- Option to include current time range while sharing a Log query, so that the other person also sees what you’re seeing.
- Option to export only currently visible columns or all columns in Logs Explorer