
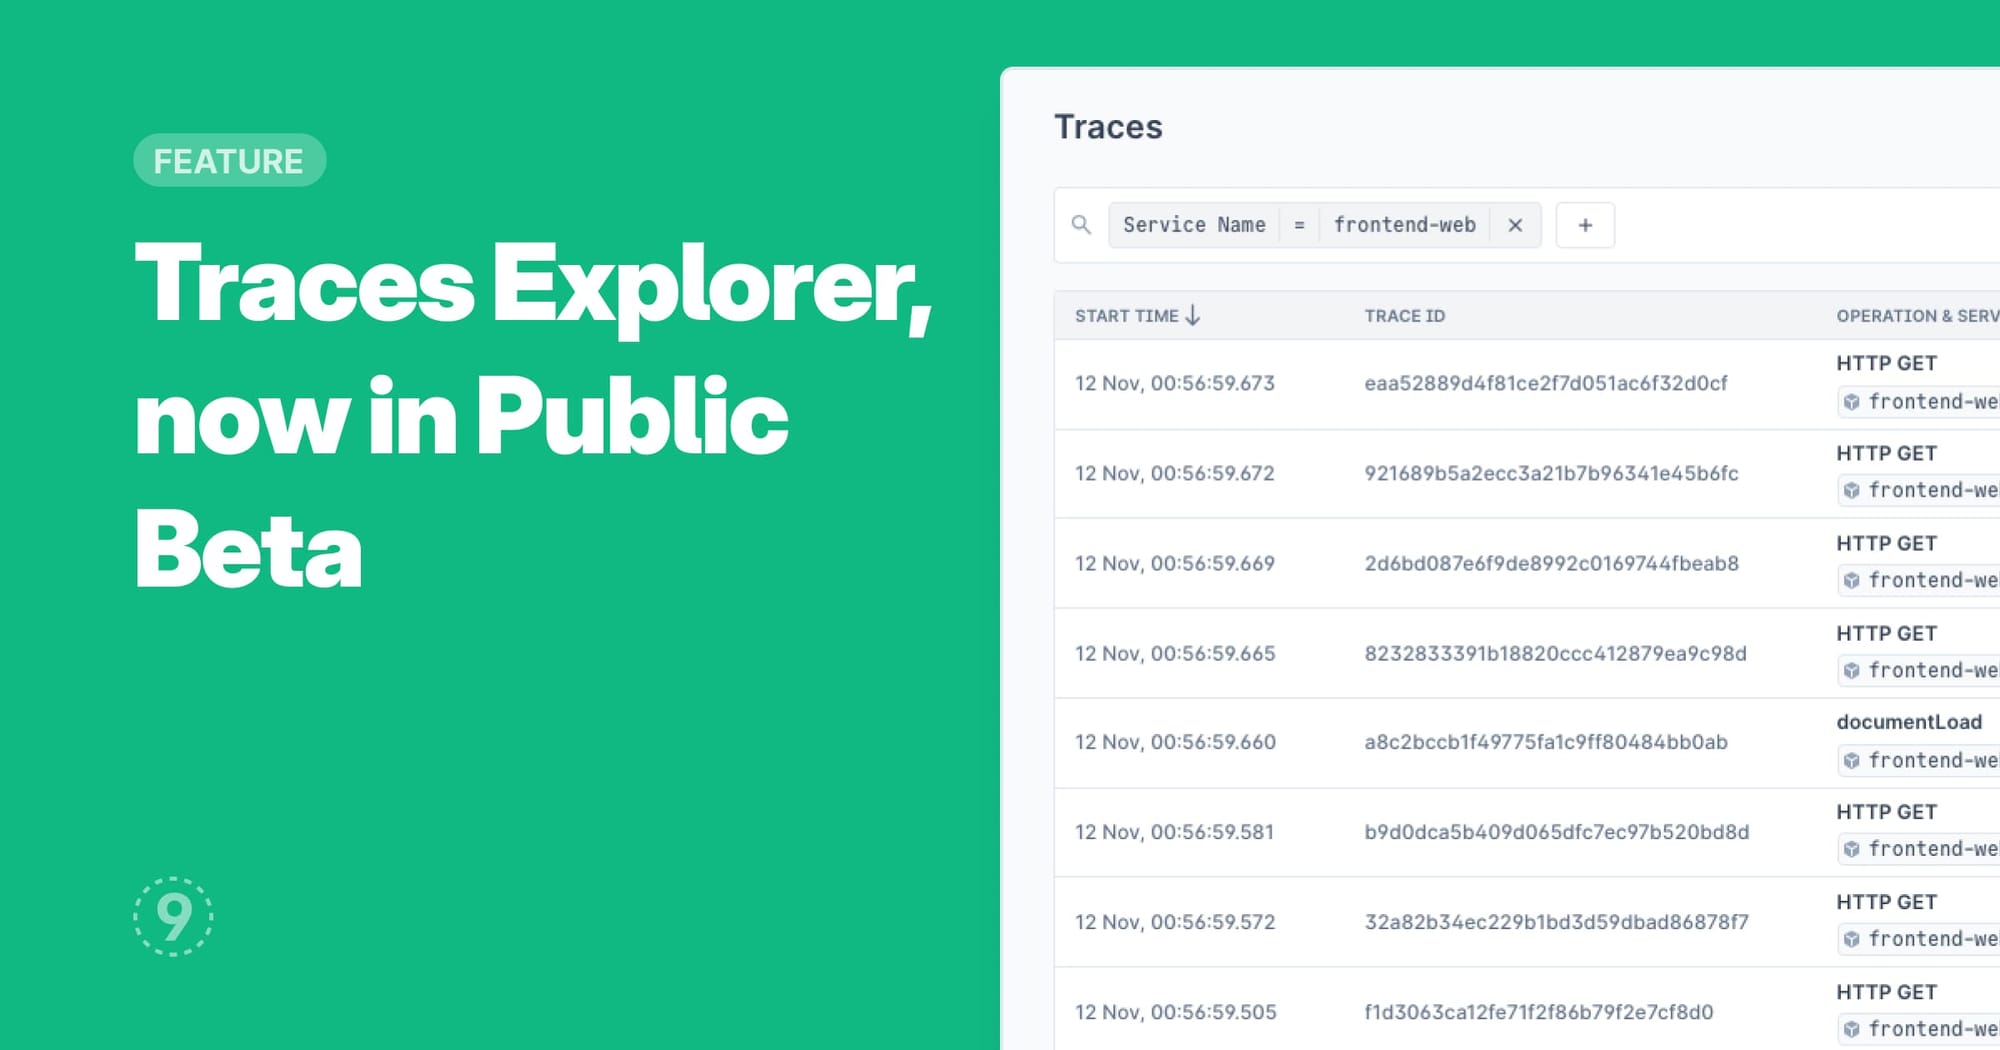
You can now view your ingested traces in Last9’s native Traces Explorer, apart from the existing Tempo plugin that continues to be available in the embedded Grafana experience.
- Search by service name, span name, and span attributes
- View traces up to the default retention period of last 14 days, with quick options to view for last 5 mins, 15 mins, 30 mins, 1 hour, 3 hours, 6 hours, 12 hours, and 1 day
- Click on a trace to view:
- The trace duration
- Span dependencies in a timeline waterfall chart with individual durations with start and end times
- View and search attributes and span events for each span in the trace waterfall view