
Improvements
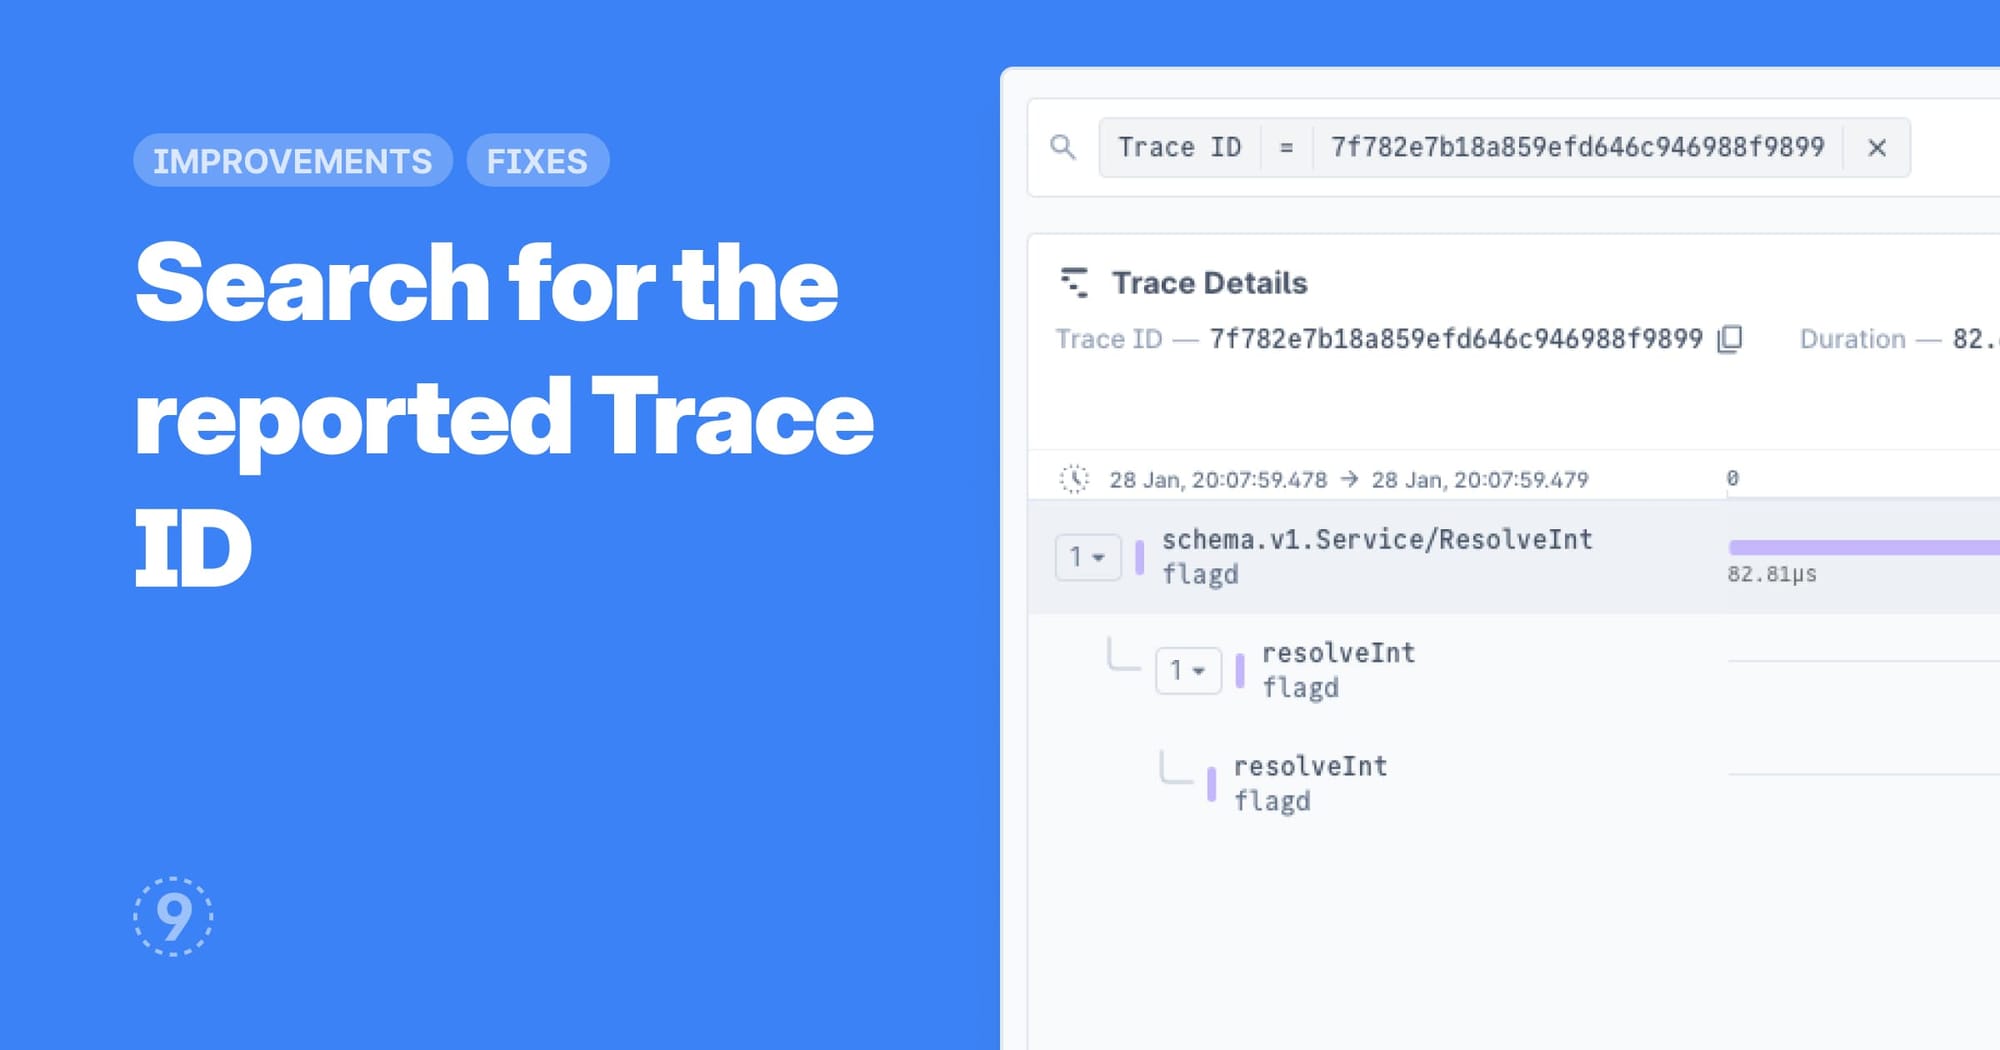
- Along with Service Name and Span Name, searching for a Trace ID is now first class in Traces Explorer, letting you directly jump to a specific request and analyze its performance and debug issues.
Fixes
- Using a “matches” or a “does not match” filter in Builder mode would cause a “no results found” state when switching to Editor mode