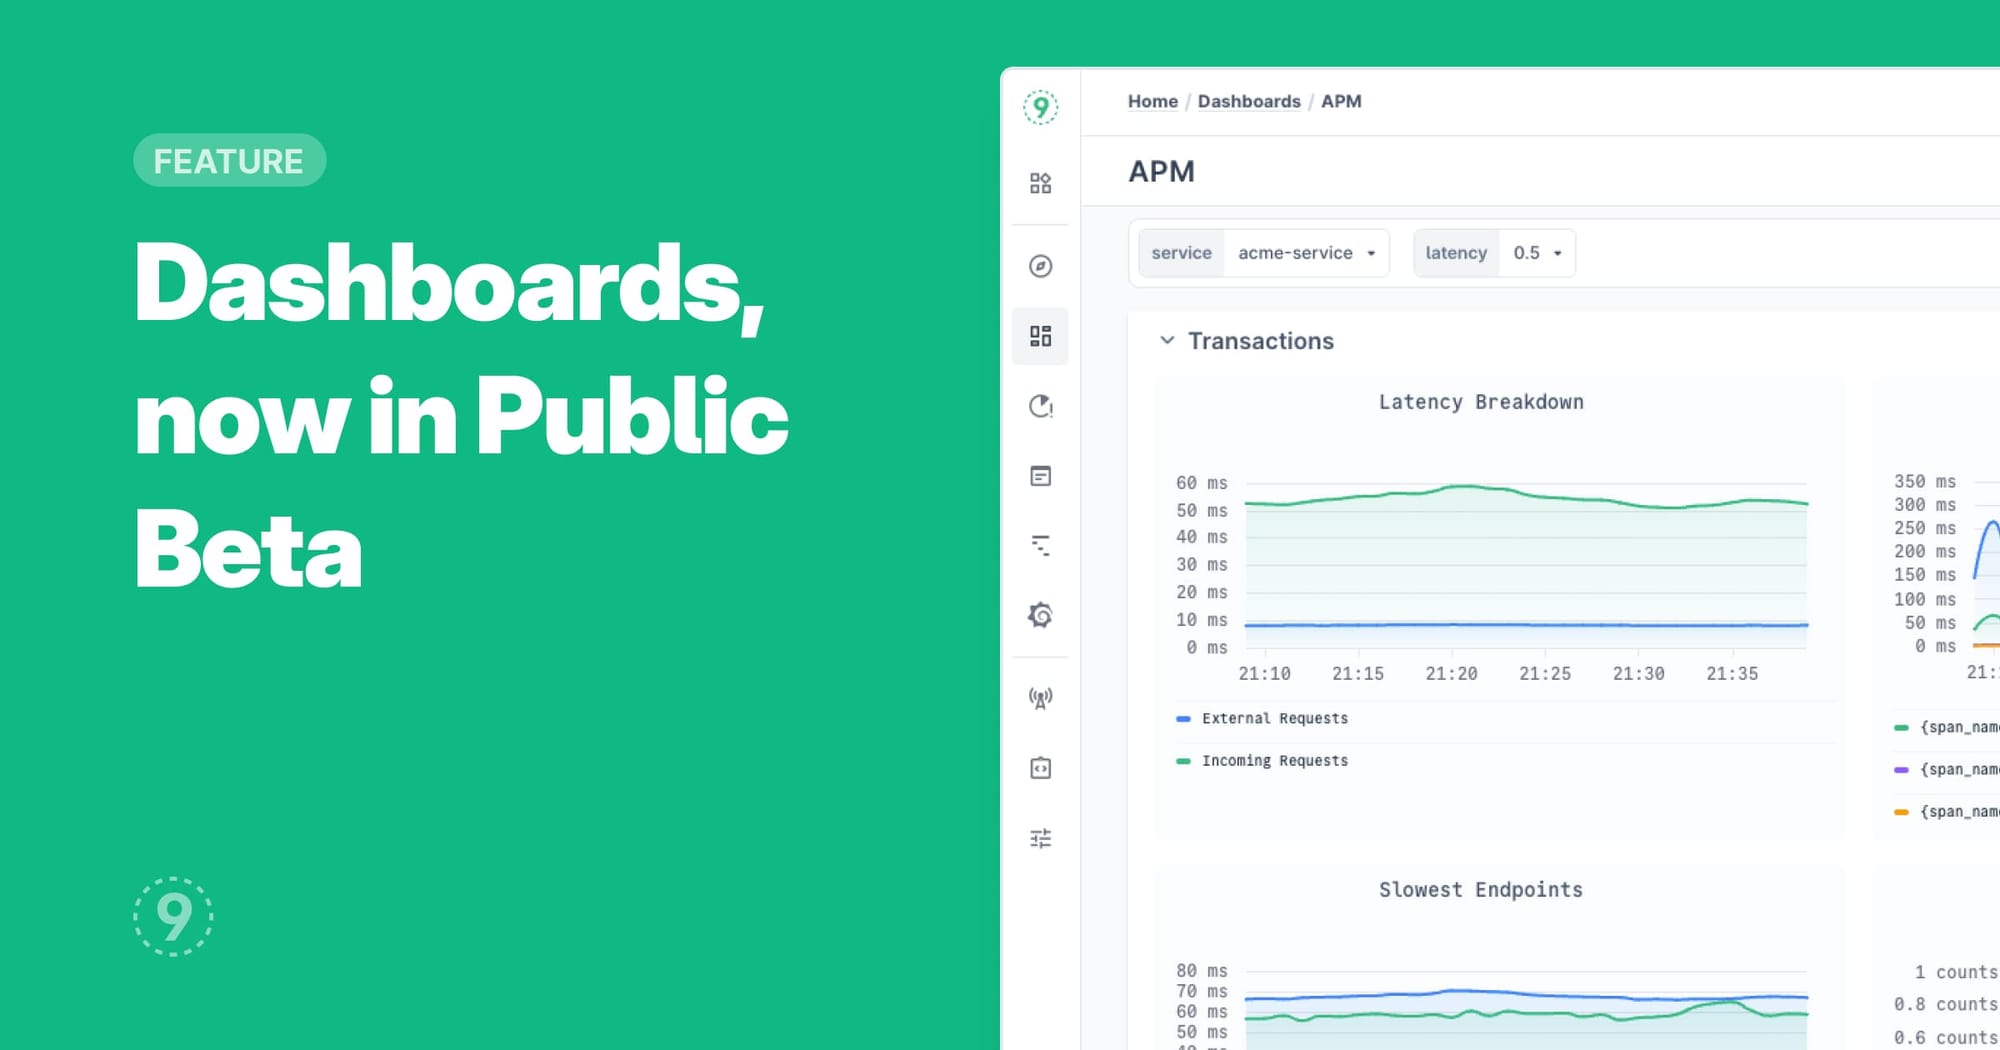
While Last9 supports an embedded instance of Grafana, we’re now introducing Dashboards to the product, starting with a default APM template and the option to create new dashboards and update by saving log aggregation queries.
Last9 APM
Select any service and baseline latency to view the performance of the selected service. The metrics visualized in the panels today are:
- Throughput Overview
- Transactions
- Latency Breakdown
- Most Time Consuming Endpoints
- Slowest Endpoints
- Endpoints by 5xx
- Endpoints by 4xx
- Most Time Consuming DB Queries
- Slowest DB Queries
- Most Time Consuming Redis Operations
- Slowest Redis Operations
- External Services
- External Calls Distribution
- External Calls Trend
- External Calls Latency
- Failed External Calls by Status Code
You can click on the ⠇ icon in any panel to expand/zoom in to it, and vice versa. Allthe charts have a correlated crosshair to make debugging easier.
Currently, the APM Dashboard is system generated and cannot be edited or deleted — we’re working on this. If there are any changes you’d like, we’d be happy to chat and assist.
Add Logs Aggregation Queries to a Dashboard
When you run an aggregation query in Editor mode, you can also save the result as a panel to a new or an existing dashboard. Dashboards created via this method can be edited and deleted by the team.
