
Keeping track of endpoint performance across multiple services can be challenging, especially when trying to identify bottlenecks or troubleshoot issues. API Catalog provides a unified view that brings together performance metrics for all your endpoints in one place, making it easier to monitor service health, identify slow endpoints, and detect error patterns before they impact users.
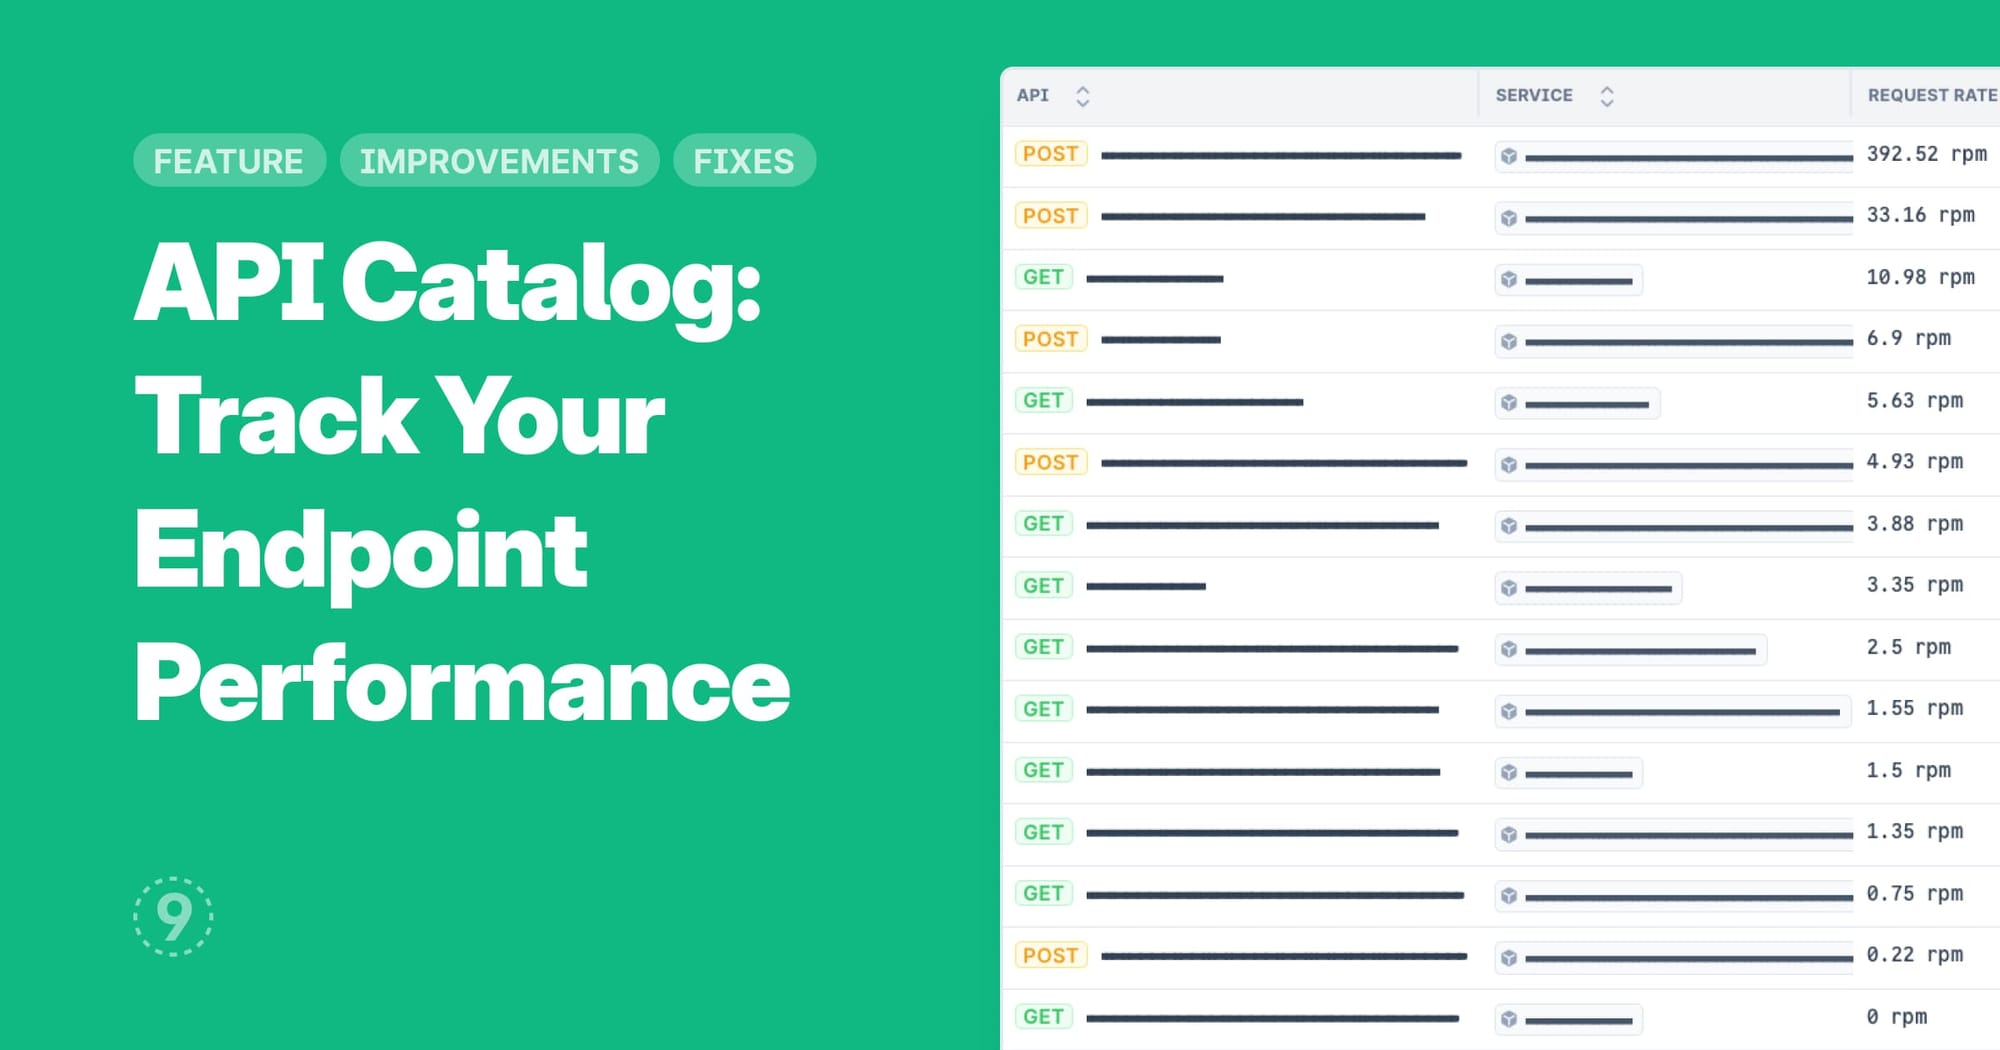
- Performance metrics at a glance: View request rate, error rate, and latency percentiles (P50, P95, P99) for each endpoint, with metrics aggregated to P95 for your selected time window
- Time-based analysis: Select any time window to analyze performance trends
- Service filtering: Filter endpoints by service to focus on specific areas of your infrastructure
- HTTP method identification: Easily identify endpoint types with HTTP method chips (GET, POST, etc.) displayed next to each endpoint
When you click on an endpoint, you'll see detailed performance data:
- Throughput graphs showing request patterns
- Error rate trends over the selected time period
- Latency comparisons across different percentiles (P50, P95, P99)
- Related traces for transaction-level investigation
- Coming soon: Availability panel and related logs
The API Catalog works with your existing trace data, with no additional configuration required beyond what you’re already sending.
Improvements
- Dashboard pinning: Pin the first row of any dashboard to your personal home page for quick access to overview metrics (each user can customize their own pinned content)
- Date picker for Rehydrated Indexes: Select dates using the date range picker when creating new Rehydrated Indexes instead of manual entry
- Unlimited Rehydrated Indexes: We've removed the previous limit of five Rehydrated Indexes (Note: telemetry volume of rehydrated indexes counts toward usage billing)
Fixes
- Extremely long strings in Log Explorer filters would overflow the chip and break the UI layout