
You can now use Group By to add a hierarchy of information while viewing Alert Monitor. For example, grouping by region or tenant lets you identify what’s impacting users in Europe or if a specific customer may see downtime.
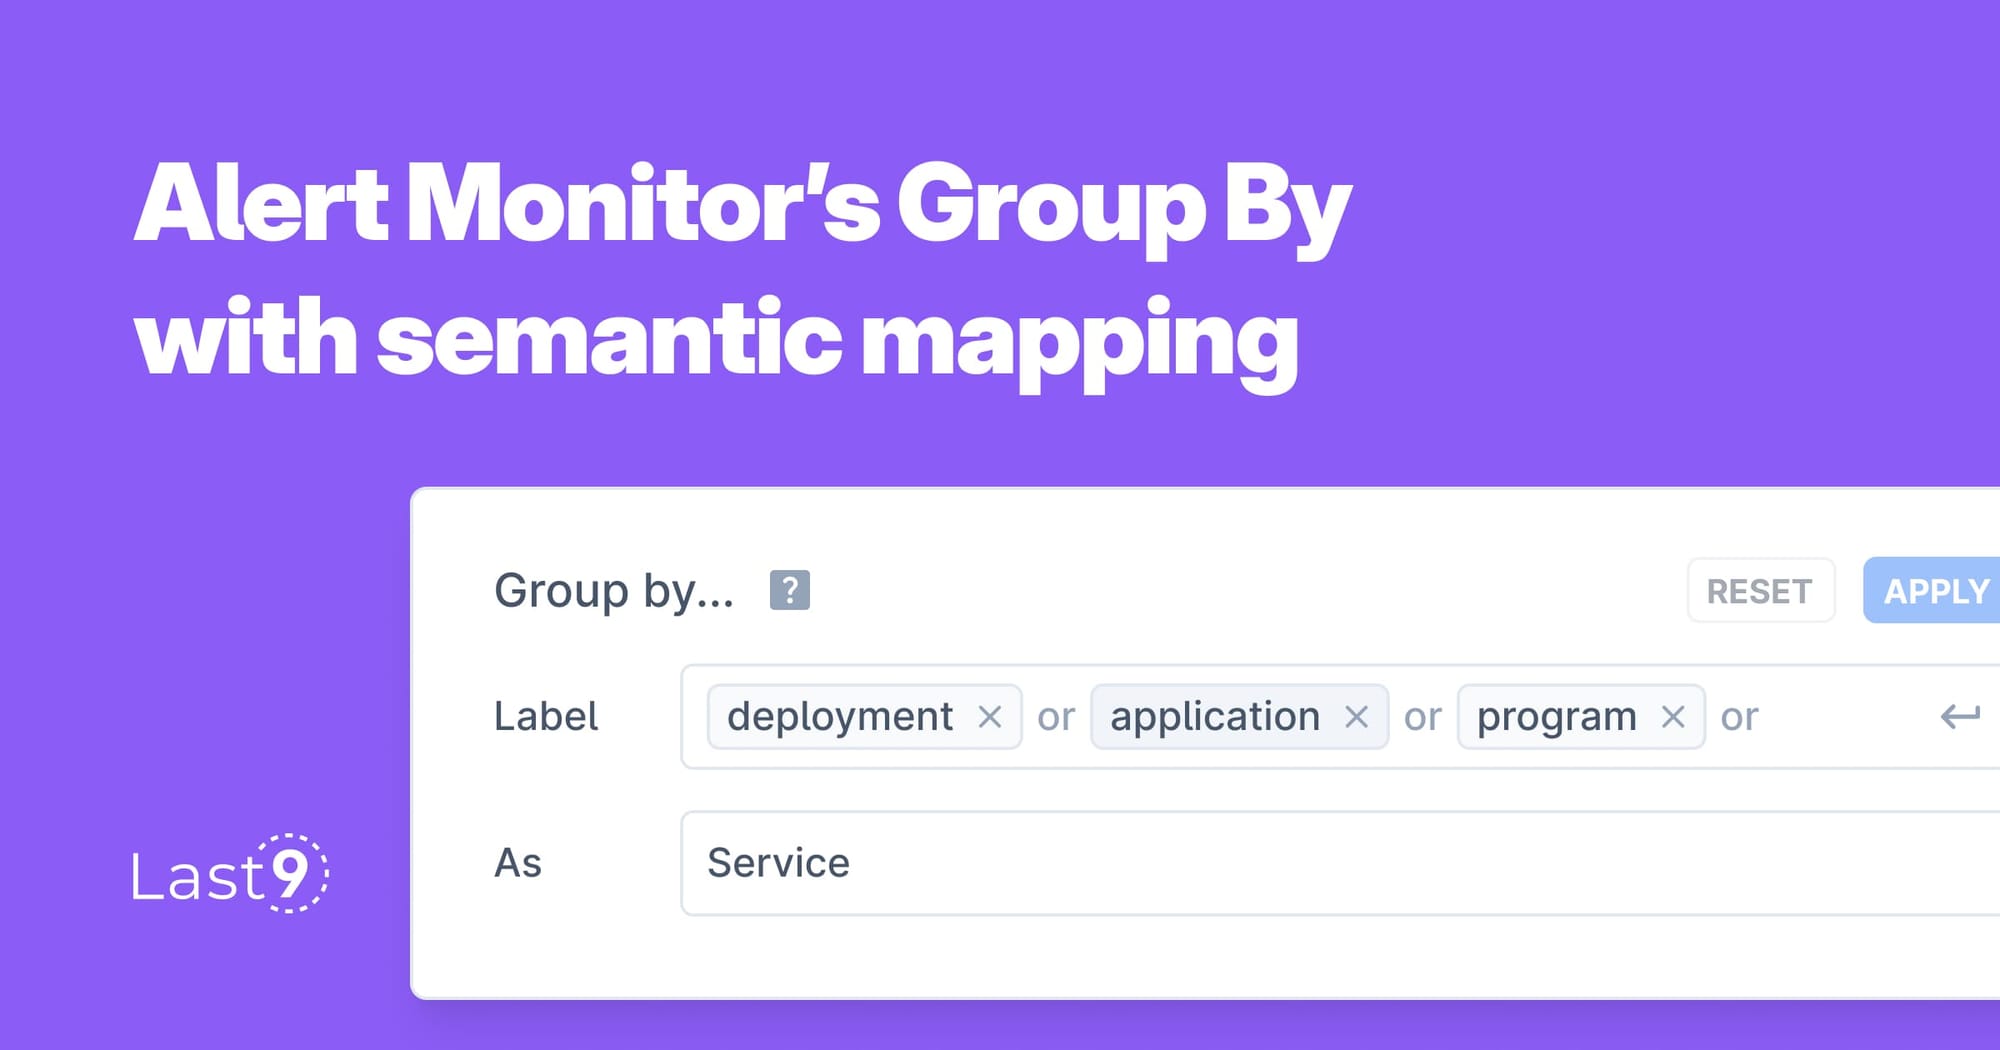
But with that As field in the Group By popup, you’re able to solve a bigger headache.
As teams and products grow, nomenclature starts varying. Depending on where a metric is being emitted from, different labels across metrics can mean the same thing to a team.
For example, the following may all mean to be referring to the same service:
- a
deploymentlabel in a Kubernetes metric, or - an
applicationlabel from your client-facing mobile app, or - a
programlabel from a background job
To be able to monitor them together would mean either getting various teams to update the labels to service across metrics or adding a new service label altogether — either option is a hassle, and the latter leads to increased cardinality as well.
Instead, include deployment, application, and program in the Labels field and service in the As field. All fired alerts will now be grouped under service.
Note: Group By settings are currently not persisted across sessions. However, they are persisted in the URL, so you can share them with your team members or save them as a bookmark. If you’d like them included in your alert notifications, you can use the Custom Annotations feature while configuring your alert rules.
Updates & Fixes:
- Improved ingestion performance for vmagent users
- Updated Channels in an Alert Group’s settings to include a direct link to creating new channels before they can used to configure alert notifications
- Fixed a bug while creating a new Indicator where while viewing the Query Preview, the Open in Explore button would not be visible