As digital transformation accelerates, ensuring your apps run smoothly is crucial for delivering the best user experience.
With systems becoming more complex, tracking performance and understanding how your applications are performing is more important than ever.
Unified observability plays a key role in monitoring and managing these complex systems. But what does it mean, and why is it so crucial for modern IT environments?
Let’s break it down.
Understanding Unified Observability
At its core, observability is about having visibility into the internal workings of your system. This involves collecting observability data from multiple sources—metrics, logs, and traces—and using them to understand system behavior.

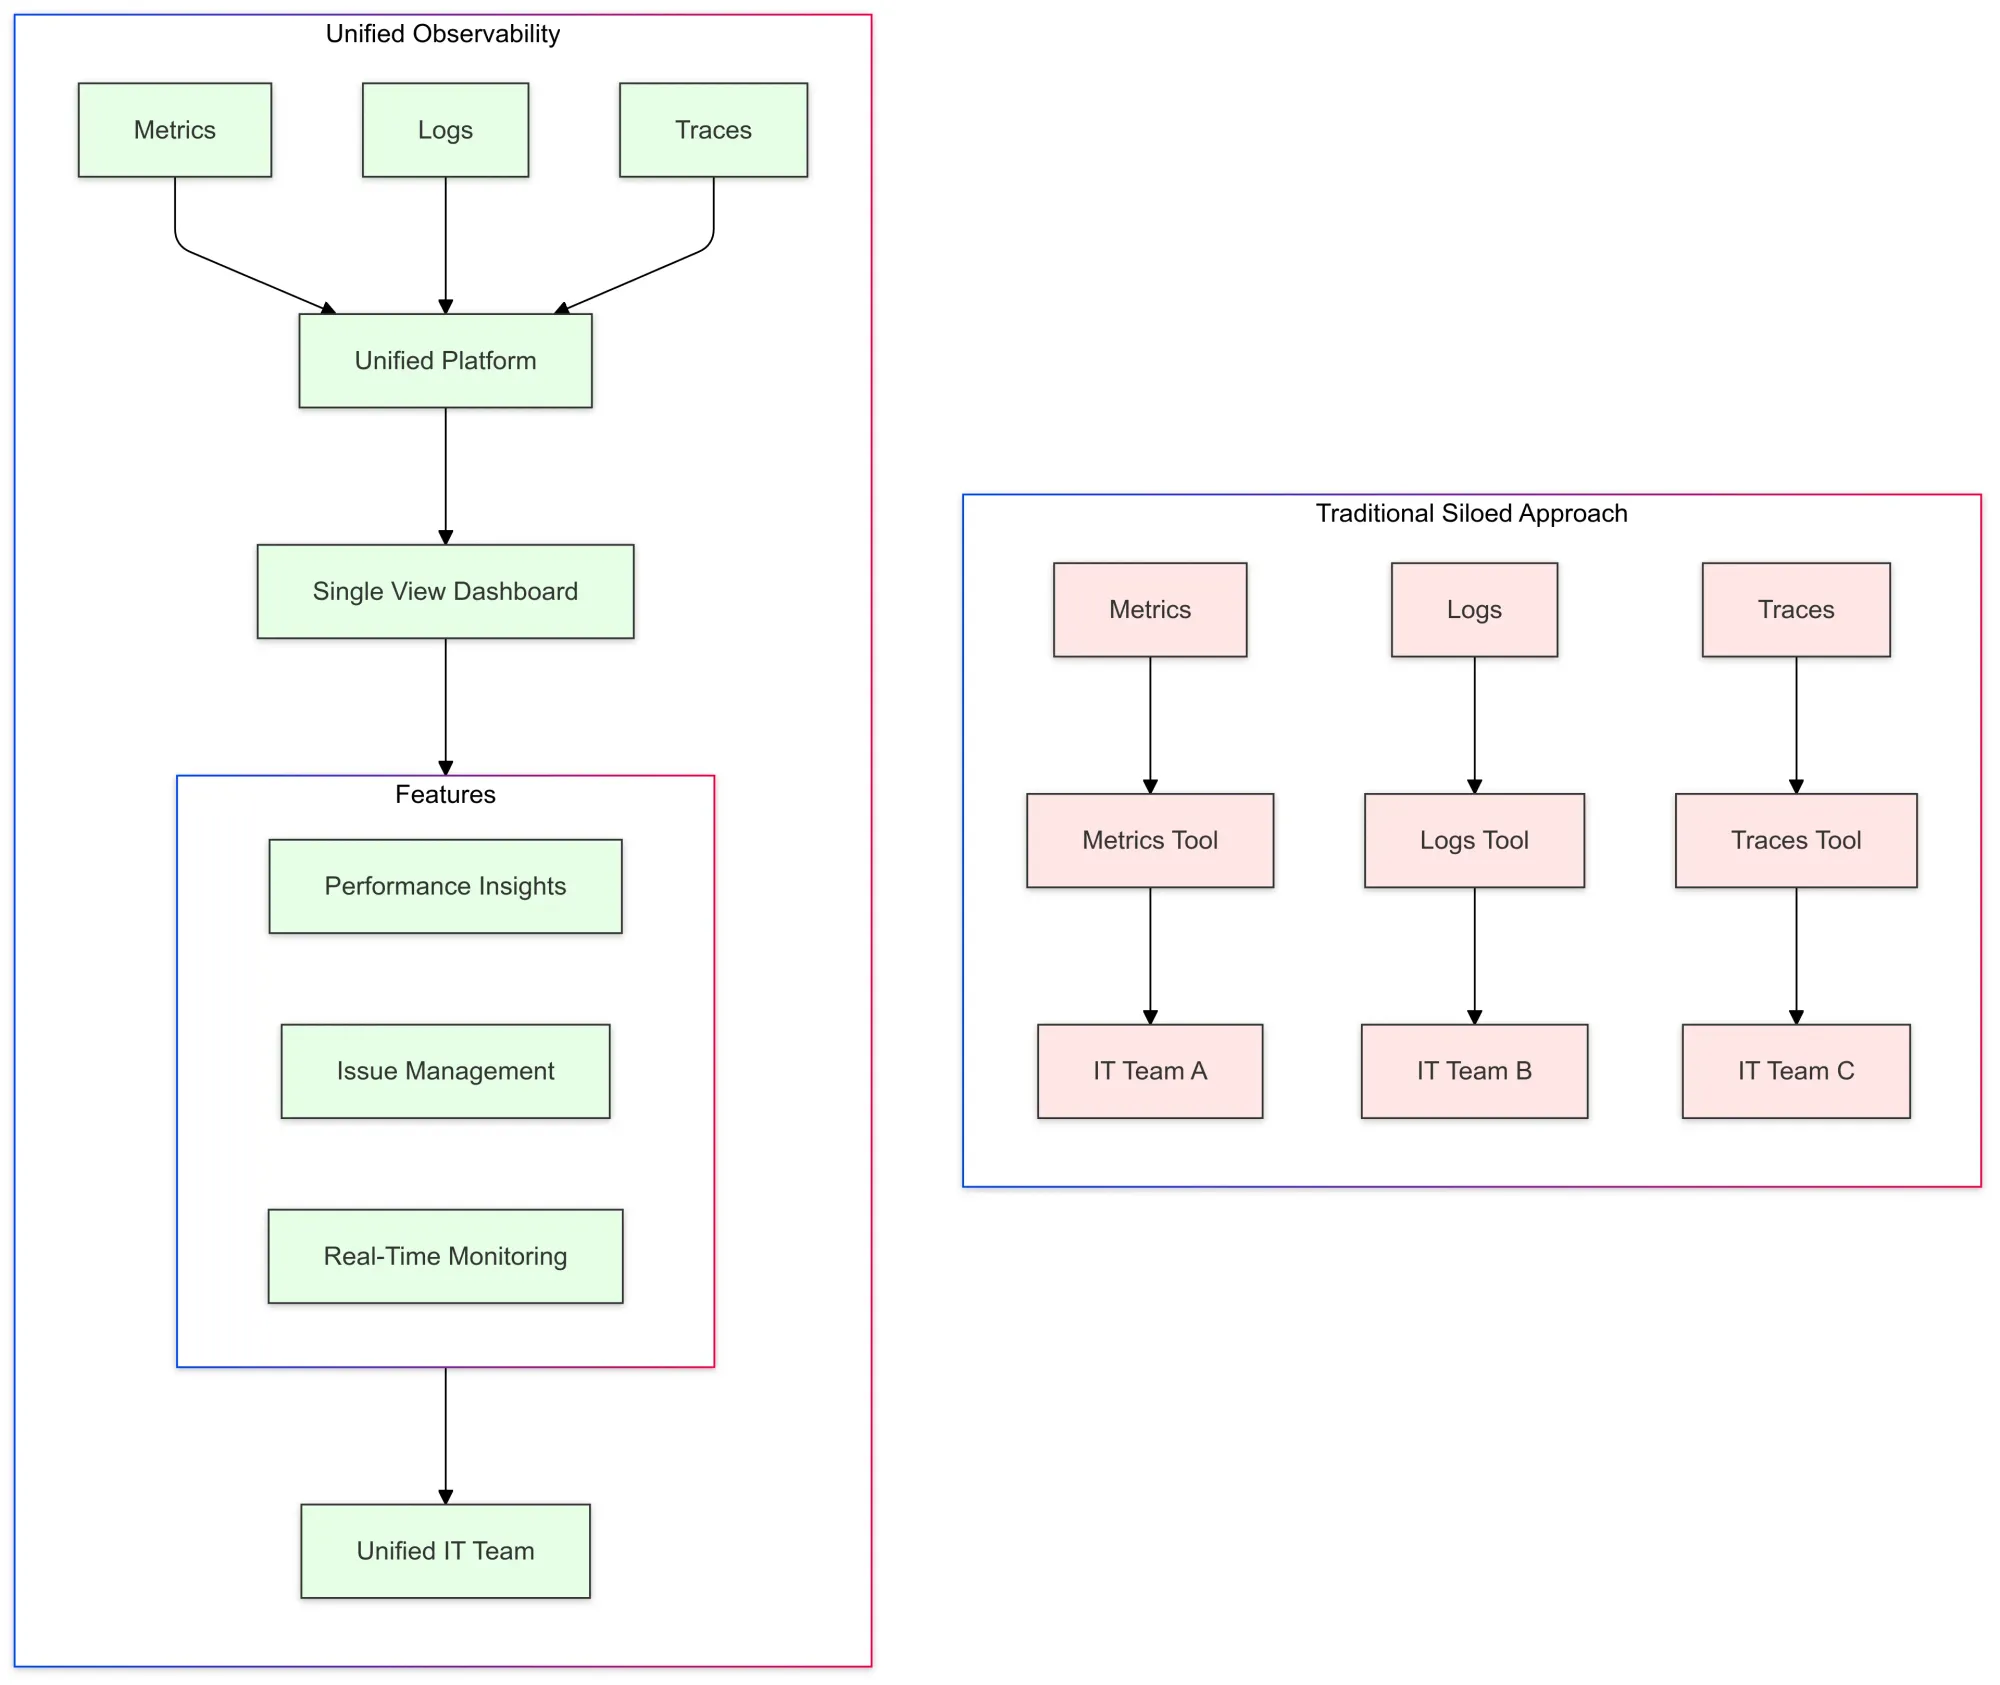
In a typical environment, these data points exist in silos, making it challenging to correlate insights and resolve issues quickly. But unified observability aims to change that. Instead of dealing with isolated data streams, unified observability brings everything together into one platform.
This means IT teams can access a comprehensive, single view of their systems, making it easier to spot issues, track performance, and act on actionable insights.
The Shift to Unified Observability
Why is unified observability gaining attention?
As IT ecosystems become more complex—especially with the rise of microservices, Kubernetes, and multi-cloud environments—tracking dependencies between services gets tougher. Traditional monitoring tools that focus on just one type of data (e.g., metrics or logs) can't give the full picture anymore.
This lack of visibility can create blind spots, leading to slower troubleshooting and missed optimization opportunities.
Unified observability, on the other hand, combines metrics, logs, and traces, offering a real-time view of your entire application stack. Aggregating this data gives IT teams a complete, end-to-end picture of system performance, making it easier to:
- Analyze performance
- Troubleshoot issues
- Make proactive decisions to prevent downtime
Why Unified Observability Matters
Unified observability plays a key role in the smooth functioning of IT operations. Here’s why:
Faster Remediation and Reduced Downtime
When all observability data is in one place, identifying root causes becomes quicker and more efficient.
Teams no longer need to jump between different tools, reducing mean time to resolution (MTTR) and minimizing downtime. Proactive remediation ensures better overall performance.
Better Automation and Predictive Insights
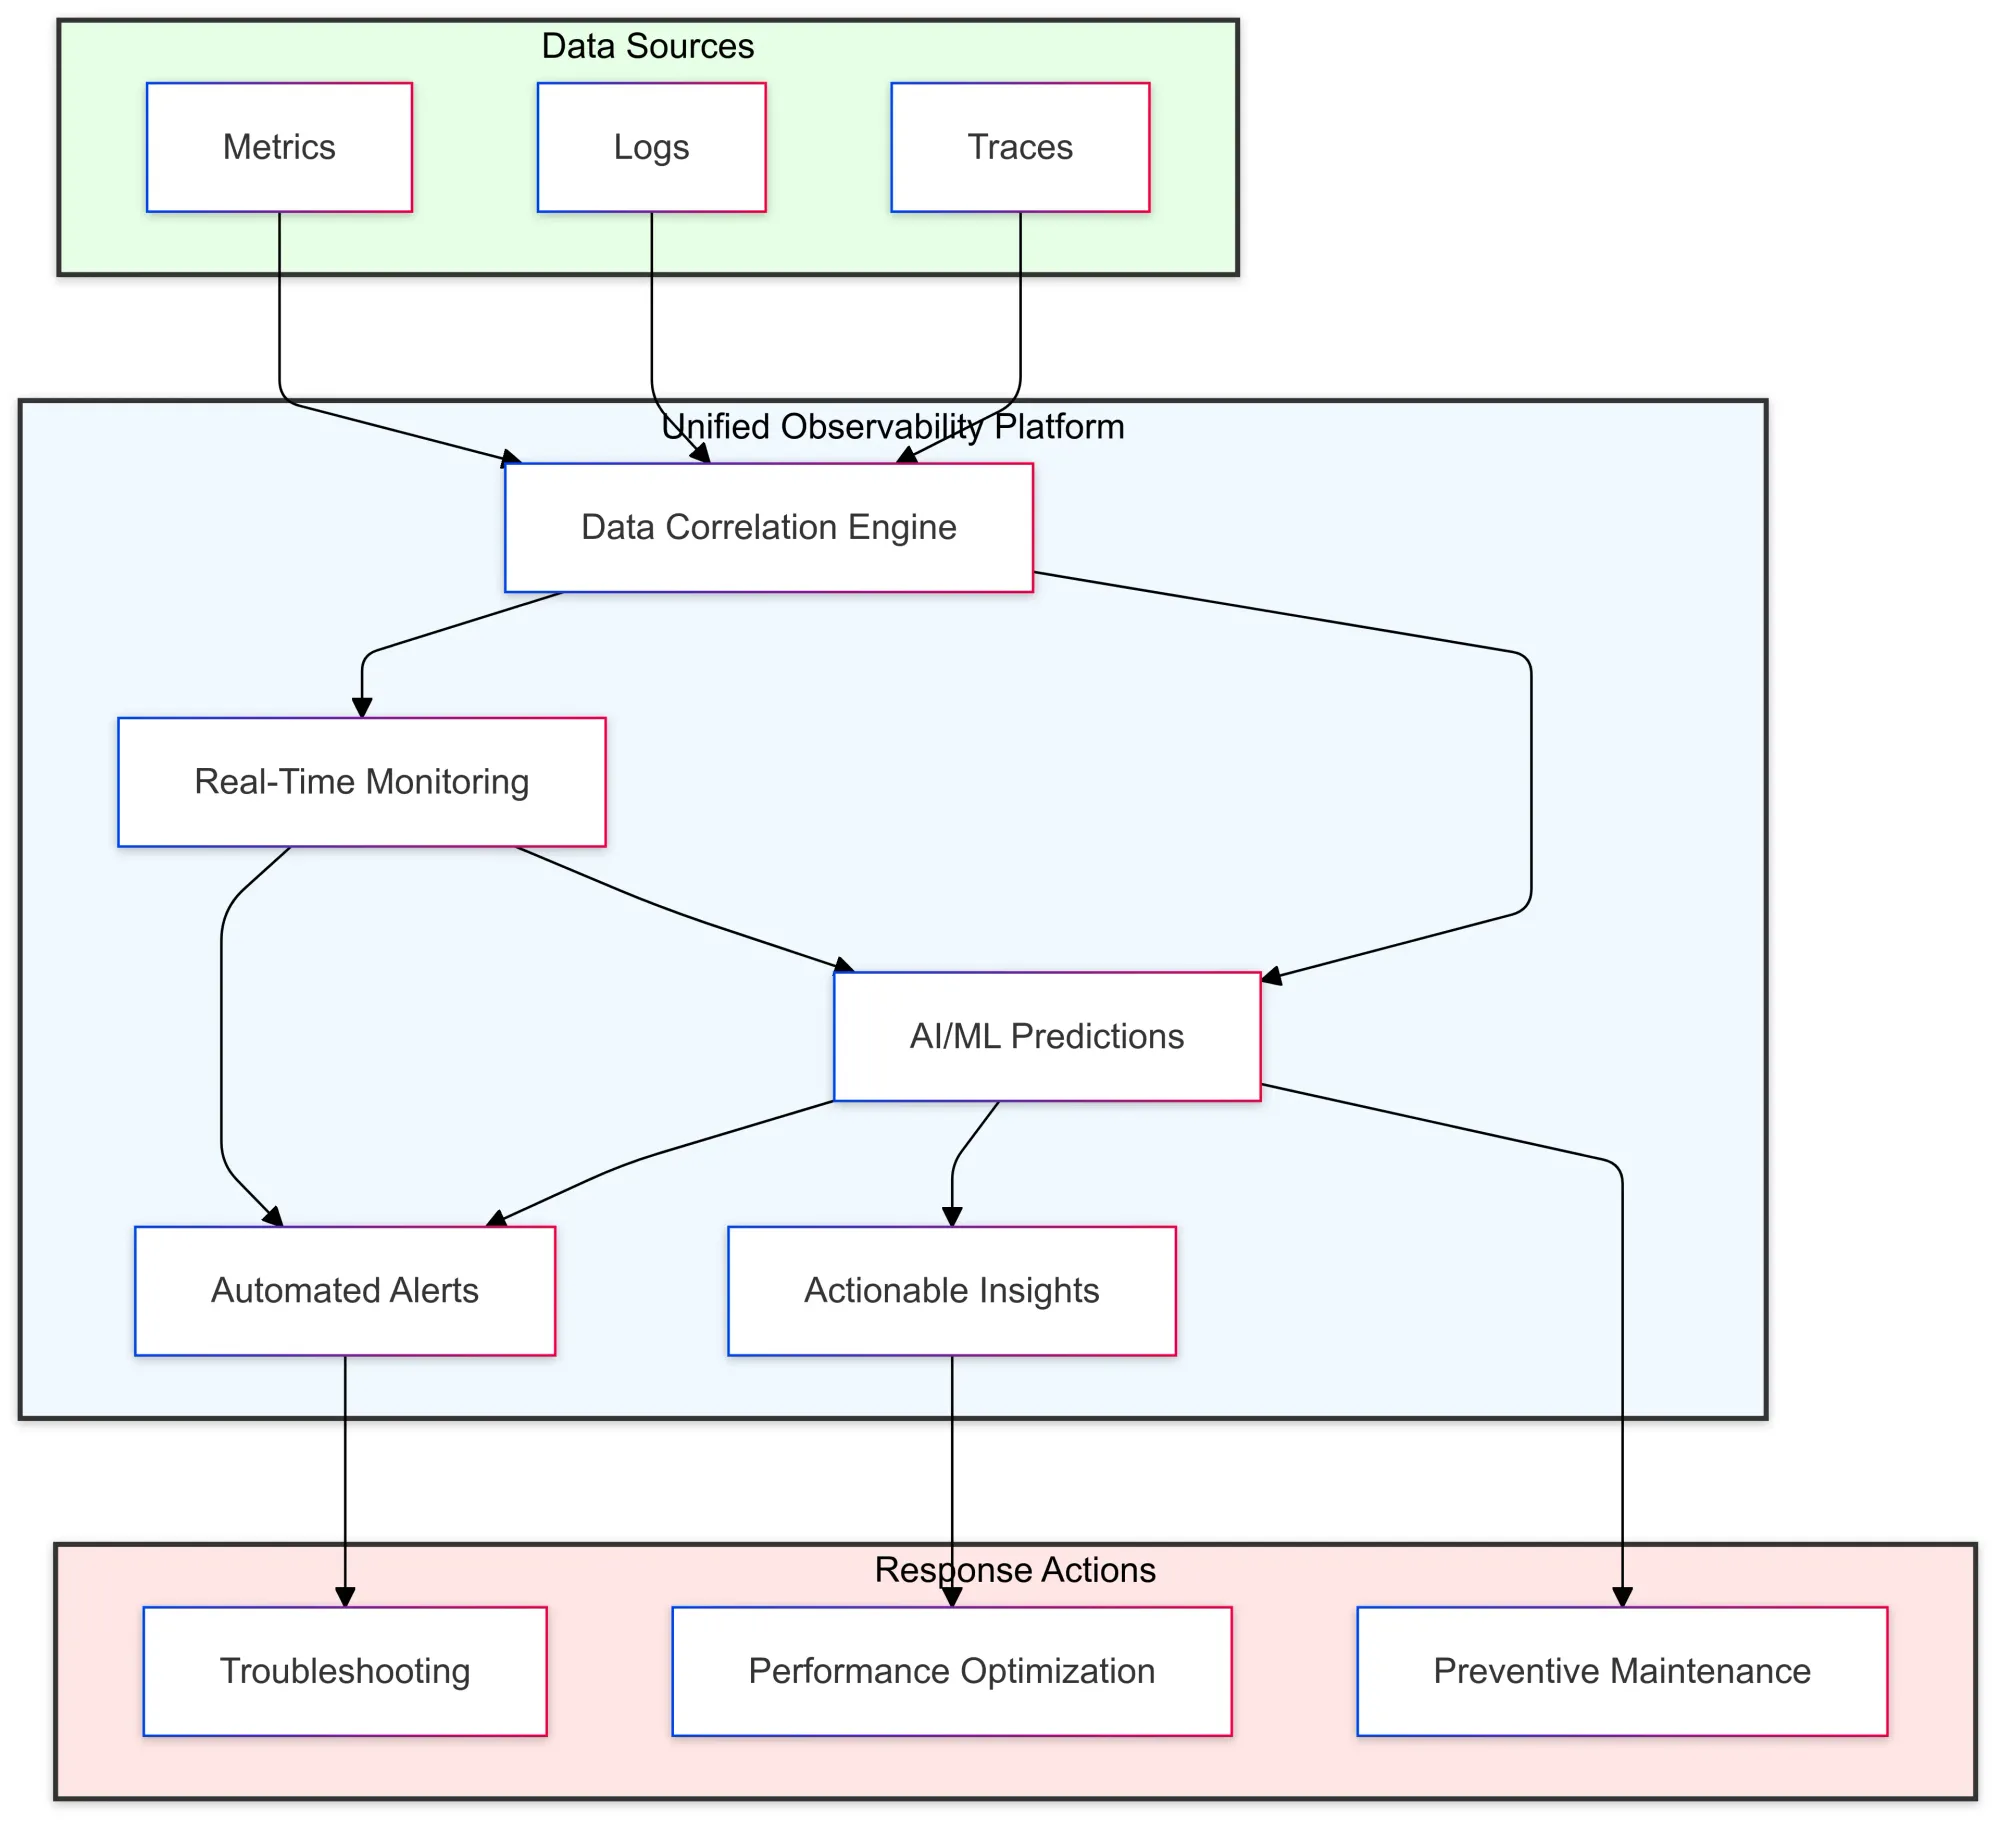
Correlating metrics, logs, and traces allows unified observability platforms to leverage machine learning and AI for predictive insights into system performance.
This lets IT teams act before problems arise, shifting from reactive to proactive management. Automation, like scaling resources based on performance data, also boosts efficiency.
Improved Collaboration Across Teams
Unified observability helps DevOps, operations, and development teams collaborate more effectively. With a single source of truth, teams align on system status, making faster decisions and optimizing the digital experience.
This collaboration is crucial in dynamic environments where teams must work together to manage apps and maintain service reliability.
Enhanced User Experience
As businesses rely more on digital platforms, user experience becomes a competitive edge. Unified observability helps teams keep applications running smoothly by identifying bottlenecks that impact performance.
Understanding how dependencies and services interact allows teams to optimize for a smooth digital experience.
Easier Scaling in Multi-Cloud Environments
With the rise of multi-cloud environments, managing performance across different providers becomes complex.
Unified observability tools simplify this by tracking performance across clouds, and aggregating and correlating relevant data in one platform. This helps IT teams maintain control over increasingly complex systems.
Key Features of Unified Observability Tools
What should you look for when adopting unified observability? Here are some essential features:

- Data Correlation
A platform that aggregates observability data from various sources—metrics, logs, and traces—and makes it easy to see connections across different parts of your system. - Automated Alerts
Customizable alerts that notify your team of critical issues, ensuring faster response times. - Actionable Insights
Platforms that provide not only data but actionable insights into how to improve application performance and resolve issues quickly. - Real-Time Monitoring
The ability to monitor systems in real time, offering live performance insights and enabling quick action to avoid disruptions. - AI/ML-Powered Predictions
Using machine learning and AI to predict potential failures and vulnerabilities, helps you stay ahead of issues.
How to Overcome Challenges in Unified Observability
While the benefits are clear, integrating unified observability into your IT environment comes with its challenges:
- Data Silos
Many organizations still rely on separate monitoring tools, making it hard to bring all observability data into one place. - Complexity
As your ecosystem grows and becomes more complex, integrating unified observability into existing workflows can become difficult. - Costs
Depending on the size of your systems, implementing a unified observability platform might involve upfront costs.
Despite these hurdles, the advantages of unified observability—such as improved application performance, automation of processes, and enhanced user experience—are well worth the investment.
Getting Started with Implementing Unified Observability
To implement unified observability in your organization, consider these steps:
Evaluate Current Tools
Take stock of the monitoring tools currently in use and assess how they can be unified into a single platform.
Choose the Right Solution
Look for observability platforms that integrate well with your existing IT operations and provide the insights your teams need.
Centralize Data
Start aggregating data from your metrics, logs, and traces into a unified view.
Set Up Predictive Capabilities
Utilize machine learning or AI to gain predictive insights and automate remediation tasks where possible.
Collaborate Across Teams
Ensure all relevant teams are aligned and can use the platform effectively to manage the end-to-end lifecycle of your services.
Continuously Optimize
As your system evolves, continually refine your observability set up to handle new complexities and deliver ongoing value.
Conclusion
Unified observability is essential for businesses that want to keep their systems running smoothly in today’s complex digital world.
With the right tools, like automation and predictive analytics, you can ensure your apps are always performing well, making unified observability a key part of any modern IT or DevOps strategy.
When evaluating a solution, focusing on the right balance—performance, user experience, and scalability—is crucial. At Last9, we help centralize your observability data, making it easier to track performance, set up alerts, and troubleshoot issues—so you can keep your systems running smoothly without headaches.

We make observability easier on your budget and your sanity. Schedule a demo with us to learn how!
FAQs
What is unified observability?
Unified observability is an observability solution that integrates metrics, logs, and traces into a single platform, providing a holistic view of your system’s health across various architectures, such as cloud-native or traditional environments.
What are the three types of observability?
The three types are metrics, logs, and traces. These data points provide deep insights into system performance and can be captured via various telemetry methods.
What is observability in simple terms?
Observability is the ability to monitor and understand how your system is performing through data like logs, metrics, and traces, helping you quickly identify and resolve issues.
What is observability in layman's terms?
Think of it as the dashboard in your car—monitoring various components, like fuel, speed, and engine health. It helps you understand how things are running and spot potential problems before they escalate.
What are the three pillars of observability?
The three pillars are metrics, logs, and traces. Together, they form the foundation of an effective observability solution, providing insight into your system’s behavior.
Why implement a unified observability strategy?
A unified observability strategy helps you manage complexity, especially in cloud-native environments. Consolidating data from multiple sources enables more proactive monitoring, faster issue resolution, and improved collaboration across teams.
Which methods do you rely on most to detect security vulnerabilities in your systems?
Common methods include using automated API scanning tools, monitoring for unusual behavior, and correlating telemetry data from your observability solution to detect anomalies and potential vulnerabilities.
What is end-user experience monitoring?
End-user experience monitoring tracks the performance and availability of your applications from the user’s perspective. It ensures that users get a smooth experience, whether your architecture is cloud-native or based on traditional systems.
What makes Logs, Metrics, and Traces indispensable?
Logs, metrics, and traces are essential for understanding system behavior. They provide actionable insights, help troubleshoot issues, and identify areas for improvement, particularly in complex cloud-native or multi-cloud architectures.
What is APM: Understanding the Basics of Application Performance Management?
APM (Application Performance Management) focuses on monitoring and managing the performance of your applications. It provides insights into how well apps are performing, offering a clearer picture of potential issues and enabling quicker response times.
What to look for in observability tools?
When selecting an observability solution, ensure it integrates easily with your systems, supports multiple data types (logs, metrics, and traces), and offers advanced capabilities like AIOps for automated insights and predictive analytics. Also, consider whether it supports various use cases, from monitoring APIs to troubleshooting cloud-native architectures.
How does unified observability improve system performance monitoring?
Unified observability centralizes all your monitoring data, providing a single view across cloud-native and hybrid systems. This enables quicker detection of performance issues, reducing downtime and improving overall system reliability.
How does unified observability improve IT operations?
Unified observability enhances IT operations by offering a comprehensive view of system health. It allows for faster issue detection, minimizes downtime, and supports proactive measures, especially in cloud-native environments, ensuring that services remain efficient and reliable.


