

If you're new to DevOps, you’ve likely noticed that website logging plays a bigger role than it seems at first. It’s not just a routine task—it’s how you keep systems stable, troubleshoot issues, and understand what’s happening under the hood.
A good logging setup captures what went wrong, when, and why—helping you fix problems faster instead of guessing. In this guide, we’ll break down what website logging is, why it matters, and the tools that can help you do it effectively.
What Is Website Logging
Website logging is the process of recording events that happen within your web applications and infrastructure. These logs are your digital breadcrumbs – tracking user actions, system performance, errors, and security events in minute detail so you can understand what's happening beneath the surface.
But here's the real talk: good logging isn't about collecting data for the sake of it. It's about capturing the right information at the right time in the right format.
Consider this scenario: Your e-commerce site suddenly shows a 30% drop in checkout completions. Without proper logging, you're left guessing what's happening.
With strategic logging, you can trace a user's journey and discover that the payment API is timing out after 3 seconds – but only for mobile users on certain carriers. That's the difference between hours of guesswork and minutes of targeted fixing.
Proper website logging helps you:
- Fix problems before users flood your support inbox (or worse, your Twitter mentions)
- Track down those weird bugs that mysteriously only happen in production at 2 AM
- Know when someone's trying to break into your system, including what they're targeting and how
- Figure out why that one API call that worked perfectly in testing is suddenly taking forever in production
- Build a performance history that helps you predict future scaling needs
For DevOps engineers, solid logging practices are like having X-ray vision combined with time travel. You see through the confusion when things go wrong, spot patterns that help prevent future fires, and roll back the clock to understand exactly what led to a system failure.
Website Logging Fundamentals Every Engineer Must Master
The Five Critical Log Types Your System Can't Live Without
A robust logging strategy isn't one-size-fits-all. You need different types of logs to give you complete visibility into your system.
Here's what you should be capturing and why each type matters:
- Application logs: These reveal what's happening inside your code – function calls, state changes, and business logic execution.
Example: When a user updates their profile, your app log might show: [2025-03-18 15:42:13] [INFO] User ID 45632 updated profile fields: email, avatar. Changes committed to database in 237ms.
- Server logs: These show what's happening at the infrastructure level – CPU usage, memory allocation, disk operations, and network traffic.
Example: [2025-03-18 15:45:22] [WARN] Server web-03 CPU usage at 92% for >5 minutes. Auto-scaling triggered.
- Access logs: These track who's using your application, how they're accessing it, and what resources they're requesting.
Example: 203.0.113.42 - - [18/Mar/2025:15:46:33 +0000] "GET /api/products?category=electronics HTTP/1.1" 200 4327 "https://yourstore.com/shop" "Mozilla/5.0 (iPhone14,3)"
- Error logs: These capture when things break and why, including stack traces, error codes, and context information.
Example: [2025-03-18 15:50:04] [ERROR] Payment gateway connection timed out after 30s. Transaction ID: tx_38f2h1. User affected: user_12345. Retry attempt: 2 of 3.
- Security logs: These record suspicious activity, authentication events, permission changes, and potential breach attempts.
Example: [2025-03-18 15:53:17] [ALERT] Multiple failed login attempts (7) for admin account 'jsmith' from IP 198.51.100.23 within 60 seconds. Account temporarily locked.
Each log type serves a specific purpose in your troubleshooting toolkit. While applications can function without proper logging, you'll be flying blind when issues inevitably arise.
Why Strategic Log Levels Will Save Your Sanity
Not all logs deserve equal attention or storage. That's where log levels come in – they help you filter the signal from the noise.
| Level | When to Use | Real Example | Action Needed |
|---|---|---|---|
| DEBUG | Detailed info for debugging | [DEBUG] Function getUser called with parameter id=42, cache miss, DB query executed in 17ms |
None - only examined during detailed troubleshooting |
| INFO | Normal operational events | [INFO] User authentication successful for user_id: 12345 via OAuth provider: Google |
None - routine operations working as expected |
| WARN | Non-critical issues that might need attention | [WARN] API rate limit at 80% capacity (80/100 req/min). Client: mobile-app-v3.2 |
Monitor - might need attention soon if trend continues |
| ERROR | Runtime errors affecting functionality | [ERROR] Database connection failed after 3 retries. Connection pool: orders_read_replica. Error: timeout |
Immediate investigation - functionality is impaired |
| FATAL | System-breaking catastrophes | [FATAL] Web server crashed, all services unavailable. Out of memory error in process id 4721 |
Emergency response - critical failure requires immediate action |
Without proper log levels, you'll either miss critical issues buried in verbose logs or get overwhelmed with alert fatigue. Strategic use of log levels means you can:
- Filter logs based on environment (more DEBUG in dev, mostly ERROR and above in production)
- Set up different retention policies (keep FATAL logs for a year, DEBUG for just a day or two)
- Configure alerts based on severity (get paged for FATAL issues, just an email for WARN)
Pro tip: Many new DevOps engineers overuse INFO and underuse WARN. Remember that WARN is perfect for capturing "this isn't broken yet, but it's heading that way" situations.
Why Structured Logging Is the Key to Transforming Your Troubleshooting
Plain text logs are like trying to find your keys in a messy apartment – they're in there somewhere, but good luck finding them quickly.
Structured logging (typically in JSON format) transforms this chaos into a searchable, filterable, queryable dataset that makes sense even at 3 AM when you're half-awake and dealing with a production crisis.
Here's what makes structured logging revolutionary:
Before (Plain Text):
[2025-03-18 10:15:30] ERROR Payment processing failed for user_123: GATEWAY_TIMEOUTAfter (JSON Structured):
{
  "timestamp": "2025-03-18T10:15:30Z",
  "level": "ERROR",
  "service": "payment-api",
  "message": "Payment processing failed",
  "user_id": "user_123",
  "error_code": "GATEWAY_TIMEOUT",
  "request_id": "req_8f29d1",
  "payment_provider": "stripe",
  "client_type": "mobile_ios",
  "app_version": "2.3.5",
  "environment": "production"
}
The structured version gives you:
- Consistent fields across all log entries
- Machine-readable format that tools can parse without custom regex
- Rich context with additional fields that help pinpoint issues
- Easy filtering (e.g., "show me all GATEWAY_TIMEOUT errors for mobile_ios clients")
- Statistical analysis capabilities (e.g., "How many payment failures per hour by provider?")
Real-world impact: One of our clients switched from text to structured logging and reduced their mean time to resolution from 47 minutes to 12 minutes – that's a 74% improvement in how quickly they could fix production issues.
Here's how to implement structured logging in different frameworks:
Node.js with Winston:
const logger = winston.createLogger({
  format: winston.format.json(),
  defaultMeta: { service: 'payment-api' },
  transports: [new winston.transports.Console()]
});

logger.error({
  message: 'Payment processing failed',
  user_id: user.id,
  error_code: error.code
});
Python with structlog:
import structlog
logger = structlog.get_logger()

logger.error("Payment processing failed",
             user_id=user.id,
             error_code=error.code)
Java with Log4j2:
Logger logger = LogManager.getLogger();
Map<String, Object> event = new HashMap<>();
event.put("user_id", user.getId());
event.put("error_code", error.getCode());
logger.error("Payment processing failed", event);
Don't wait until your next production crisis to implement structured logging – your future self (especially the tired, on-call version) will thank you.
Now let's look at the tools that'll make your logging game strong.
Top 7 Website Logging Tools You Should Know
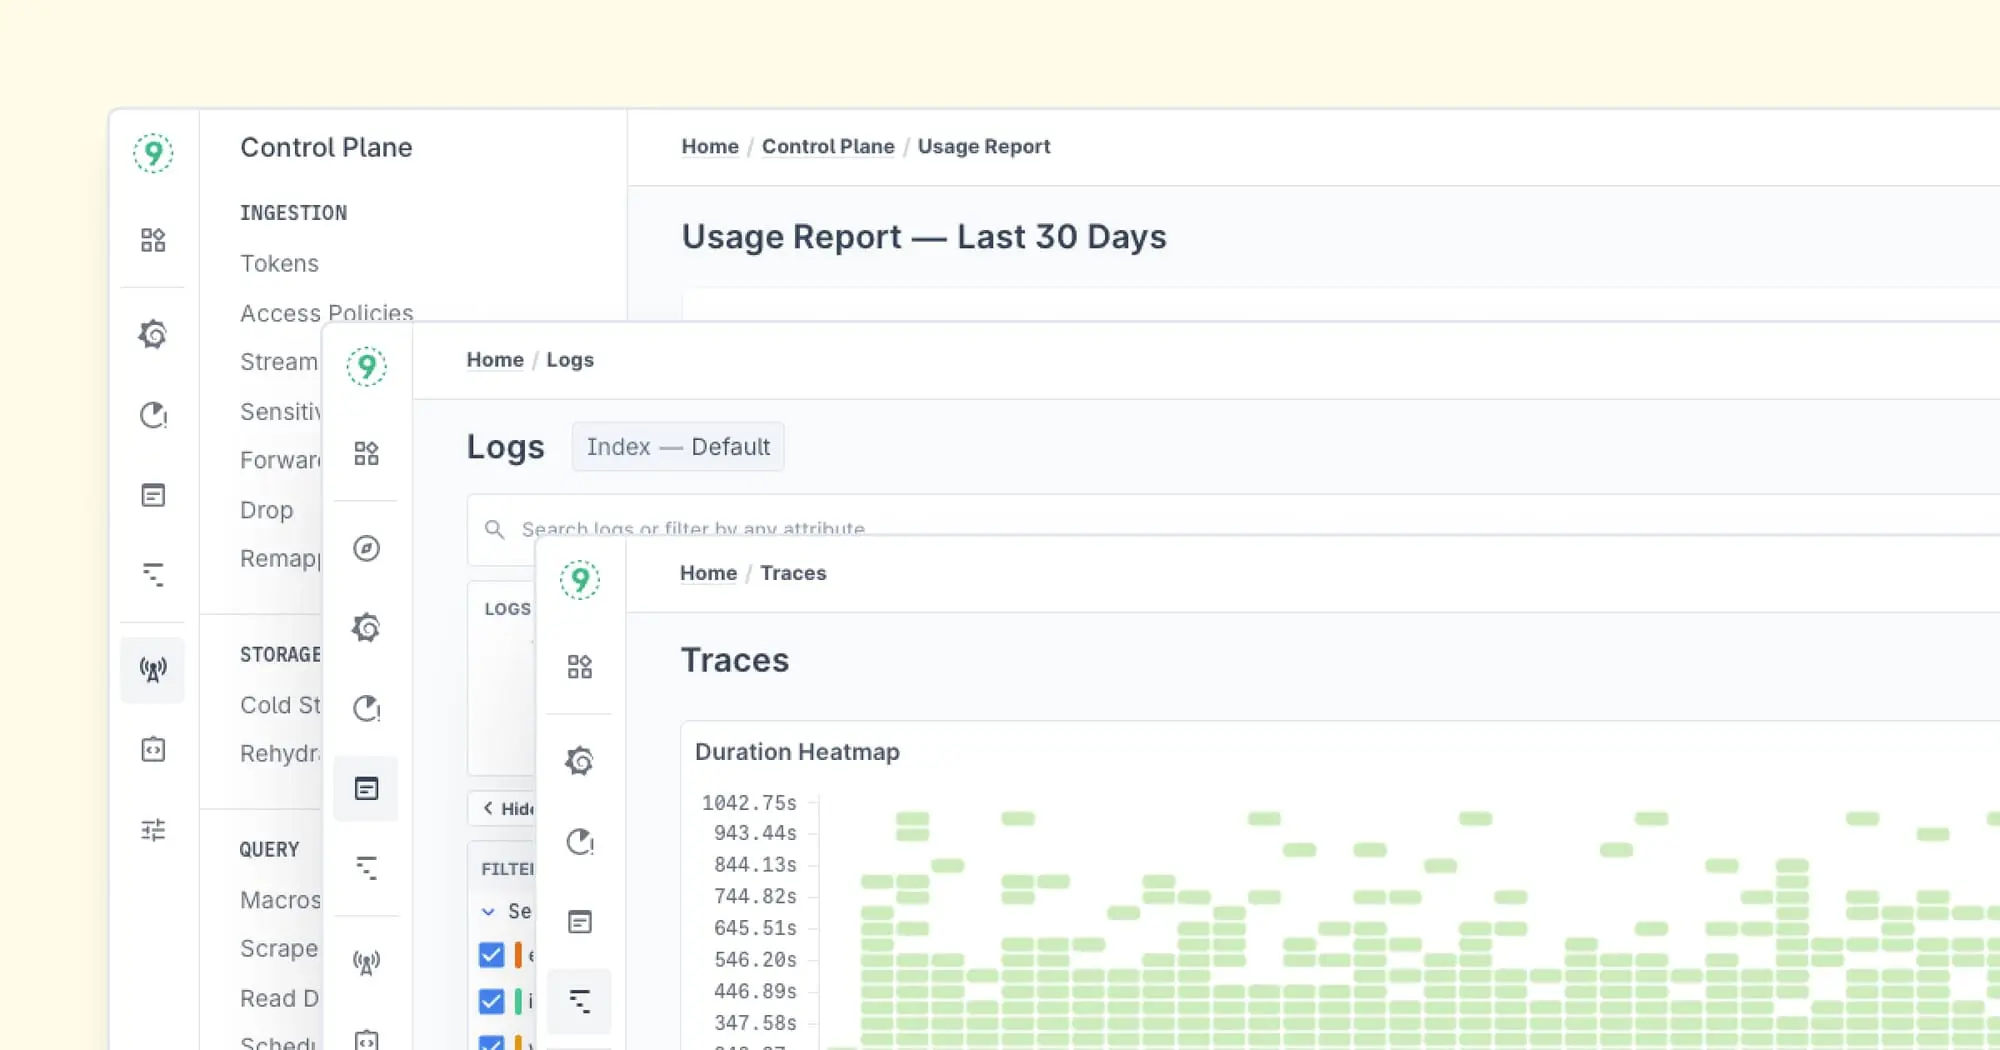
1. Last9: Hassle-free Cloud Native monitoring with metrics, events, logs, and traces.
What it is: A high-performance telemetry data platform designed for scale, enabling precise observability without breaking the bank. Trusted by industry leaders like Probo, CleverTap, and Replit, Last9 unifies metrics, logs, and traces for deeper, real-time insights.
Why it stands out: Last9 isn’t just about collecting data—it’s about making it actionable. With built-in correlation across telemetry signals, teams can cut through the noise and pinpoint issues faster. If you’re troubleshooting an outage or optimizing performance, Last9 helps you focus on what matters.
Key features:
- High-cardinality observability for complex microservices environments
- Zero sampling, ensuring complete visibility into your data
- Real-time correlation between metrics, logs, and traces
- Cost-optimized storage to handle massive scale efficiently
- Seamless OpenTelemetry and Prometheus integration
Perfect for: Teams that need deep observability at scale while keeping costs under control. If you’re tired of sifting through disconnected monitoring tools, Last9 helps unify your data for faster troubleshooting and smarter decision-making.
2. Datadog: A Cloud Monitoring Platform
What it is: A cloud monitoring platform that brings together logs, metrics, and traces.
Why you'll love it: Datadog functions as a comprehensive observability tool. It lets you correlate logs with performance metrics in real, so you can spot the connection between that CPU spike and the error logs flooding in.
Perfect for: Teams running cloud infrastructures who need a broad view of their systems.
Key Features:
- Log, metric, and trace correlation: See how different data points interact across your system.
- Infrastructure monitoring: Track cloud and on-prem resources in real time.
- APM & distributed tracing: Identify bottlenecks in complex applications.
- AI-driven alerting: Detect anomalies before they cause downtime.
- Pre-built integrations: Connect with AWS, Kubernetes, Docker, and hundreds of other services.
Perfect for: Teams running cloud infrastructures who need a broad, real-time view of their systems without any pricing constraints.
3. Elastic Stack (ELK): The Open-Source Powerhouse
What it is: The popular open-source combo of Elasticsearch (for storage and search), Logstash (for processing), and Kibana (for visualization), often extended with Beats (for data collection).
Why you'll love it: Complete control and flexibility without vendor lock-in. The Elastic Stack can handle massive volumes of logs—we're talking terabytes per day—and gives you powerful search capabilities with a query language that lets you find the needle in your log haystack in seconds.
Key features:
- Powerful full-text search with Lucene query syntax
- Real-time data processing pipelines with Logstash
- Beautiful visualizations and dashboards with Kibana
- Distributed architecture that scales horizontally
- Machine learning capabilities for anomaly detection
- Alerting and reporting functionality
Perfect for: Teams who want full control over their logging infrastructure, have specialized compliance requirements, or need highly customized dashboards and visualizations. It's ideal if you have the engineering resources to maintain it.
4. Grafana Loki: A Logging Solution That Doesn't Sacrifice Performance
What it is: A horizontally scalable, cost-effective log aggregation system inspired by Prometheus, designed specifically to be efficient with both storage and compute resources.
Why you'll love it: Loki is the cool younger sibling in the logging world – it's built on the premise that most logs are never read, so why pay for expensive indexing of everything? Instead, Loki uses labels (like Prometheus) for efficient filtering and only indexes those metadata labels instead of full-text content. This means dramatically lower storage costs and better query performance for most common use cases.
Key features:
- Label-based indexing that's incredibly storage-efficient
- Seamless integration with Prometheus metrics and Grafana dashboards
- LogQL query language that will feel familiar to Prometheus users
- Multi-tenancy support for organizations with multiple teams
- Horizontally scalable architecture built for the cloud
- Native Kubernetes integration
Perfect for: Cost-conscious teams already using Prometheus and Grafana for metrics, startups looking to optimize cloud spending, and organizations that need decent log searching without breaking the bank.
5. Splunk: The Enterprise-Grade Analytics Powerhouse
What it is: The industry-leading platform for searching, monitoring, and analyzing machine-generated data from virtually any source, with enterprise-grade security and compliance features.
Why you'll love it: Splunk's power lies in its ability to ingest and process any data format and massive volumes while providing advanced analytics, machine learning, and alerting capabilities that extend far beyond basic logging. It's not just a logging tool – it's a complete data platform that can consolidate insights from your entire digital ecosystem.
Key features:
- Advanced Search Processing Language (SPL) for powerful queries
- Machine learning capabilities for predictive analytics
- Enterprise-grade security and compliance features (RBAC, audit trails, etc.)
- Ability to ingest structured, semi-structured, and unstructured data
- Hundreds of pre-built integrations and apps
- Real-time monitoring and alerting with complex conditions
- Automatic discovery of data patterns and field extraction
Perfect for: Large enterprises with complex compliance requirements, diverse data sources, and teams that span development, operations, security, and business analytics. It's ideal for organizations that need a single source of truth for all their machine data.
6. Sentry: The Developer-Centric Exception Tracking Tool
What it is: An error tracking and performance monitoring platform that helps developers identify, triage, and fix crashes and performance bottlenecks in real-time across multiple programming languages and frameworks.
Why you'll love it: Unlike general-purpose logging tools, Sentry is laser-focused on application errors and performance issues, providing context-rich reports with full stack traces, user information, environment data, and even the ability to replay user sessions leading up to errors. It bridges the gap between logging and debugging by giving you production-level visibility with development-level detail.
Key features:
- Real-time error monitoring across 30+ languages and frameworks
- Complete stack traces with source code context
- User impact tracking (which users experienced specific errors)
- Release tracking to correlate errors with specific deployments
- Performance monitoring for frontend and backend
- Session replay to see user actions leading up to errors
- Customizable alert workflows and integration with ticketing systems
Perfect for: Development teams who want actionable error data without wading through terabytes of logs, companies focused on improving user experience, and organizations practicing continuous delivery who need immediate feedback on the quality of releases.
7. Loggly: The Cloud Logging Solution For Teams That Need Simplicity
What it is: A pure SaaS, cloud-based log management service built for simplicity and reliability, requiring minimal setup and maintenance.
Why you'll love it: Loggly takes the "no fuss" approach to logging. It gets you up and running quickly with minimal configuration—you can typically go from signup to ingesting logs in under 30 minutes. Despite its simplicity, it still offers robust analysis tools, saved searches, and alerting capabilities that cover most teams' needs without the complexity of more advanced platforms.
Key features:
- Agentless architecture with multiple ingestion methods (syslog, HTTP/S, language libraries)
- Automatic parsing of common log formats
- Pre-built dashboards for popular technologies
- Point-and-click search interface with no query language to learn
- Anomaly detection and trend analysis
- Custom alert thresholds with multiple notification channels
- Log aggregation across distributed systems
Perfect for: Small to mid-sized teams who need reliable logging without the operational overhead, startups who need to move fast, and organizations with limited DevOps resources who still need solid observability.
How to Select the Perfect Website Logging Tool for Your Unique Environment
This detailed comparison will help you evaluate which features matter most for your specific use case:
| Feature Category | Last9 | Datadog | Elastic Stack | Grafana Loki | Splunk | Sentry | Loggly |
|---|---|---|---|---|---|---|---|
| Deployment Model | SaaS | SaaS | Self-hosted or SaaS (Elastic Cloud) | Self-hosted or SaaS | Self-hosted or SaaS | SaaS | SaaS |
| Primary Strength | High cardinality observability at scale & correlation | Unified monitoring platform | Powerful search & flexibility | Cost-efficient log storage | Enterprise-grade analytics | Developer-focused error tracking | Simplicity & ease of setup |
| Pricing Model | No. of events ingested | Per host/container (can scale with infrastructure) | Self-hosted costs or data volume (Elastic Cloud) | Self-hosted costs or data volume (Grafana Cloud) | Data volume (expensive at scale) | Events-based (application-focused) | Data volume (tiered) |
| Microservices Support | ★★★★★ | ★★★★☆ | ★★★☆☆ | ★★★☆☆ | ★★★☆☆ | ★★☆☆☆ | ★★☆☆☆ |
| Setup Complexity | Low (guided onboarding and Developer Support) | Medium (many integrations) | High (complex architecture) | Medium (requires Grafana knowledge) | High (complex architecture) | Low (focused scope) | Very Low (simplest option) |
| Query Language Learning Curve | Low (intuitive and powerful) | Medium (custom DSL) | High (Lucene/Elasticsearch DSL) | Medium-High (LogQL) | High (SPL is powerful but complex) | Low (UI-focused) | Low (simple query builder) |
| Scalability | ★★★★★ | ★★★★☆ | ★★★★☆ | ★★★★★ | ★★★★★ | ★★★☆☆ | ★★★☆☆ |
| Visualization Capabilities | ★★★★☆ | ★★★★★ | ★★★★☆ (Kibana) | ★★★★☆ (Grafana) | ★★★★★ | ★★★☆☆ | ★★★☆☆ |
| Alerting Capabilities | ★★★★★ | ★★★★☆ | ★★★☆☆ | ★★★☆☆ | ★★★★☆ | ★★★★☆ | ★★★☆☆ |
| Integration Ecosystem | ★★★★★ | ★★★★★ | ★★★★☆ | ★★★☆☆ | ★★★★★ | ★★★★☆ | ★★★☆☆ |
| Machine Learning/Anomaly Detection | ★★★★★ | ★★★★☆ | ★★★★☆ | ★★☆☆☆ | ★★★★★ | ★★★☆☆ | ★★☆☆☆ |
| User Access Controls | ★★★★★ | ★★★★☆ | ★★★★★ | ★★★☆☆ | ★★★★★ | ★★★☆☆ | ★★★☆☆ |
| Support Quality | ★★★★★ (includes DevOps assistance) | ★★★★☆ | ★★★☆☆ (★★★★☆ for Elastic Cloud) | ★★★☆☆ | ★★★★★ | ★★★★☆ | ★★★☆☆ |
| Community Size | Growing rapidly | Large | Very large | Medium | Very large | Large | Medium |
| Best For | Microservices troubleshooting, complex systems & correlation | All-in-one monitoring | Custom logging pipelines & search | Cost-efficient logging at scale | Enterprise security & compliance | Application error tracking | Quick setup & simplicity |
How These Tools Handle Scale
Based on our testing and client experiences, here's how these tools perform with high log volumes:
| Tool | 10GB/day Performance | 100GB/day Performance | 1TB/day Performance | Query Speed (1-day search) |
|---|---|---|---|---|
| Last9 | Excellent | Excellent | Very Good | 1-3 seconds |
| Datadog | Excellent | Very Good | Good | 2-5 seconds |
| Elastic Stack | Excellent | Very Good | Requires tuning | 3-10 seconds * |
| Grafana Loki | Excellent | Excellent | Very Good | 1-3 seconds ** |
| Splunk | Excellent | Excellent | Excellent | 1-5 seconds |
| Sentry | N/A (event-based) | N/A (event-based) | N/A (event-based) | <1 second (limited scope) |
| Loggly | Very Good | Good | Limited | 5-15 seconds |
Website Logging Best Practices
No matter which logging tool you choose, how you approach logging is just as important as the technology itself.
These battle-tested best practices will help you build a logging strategy that serves your team when it matters most – during incidents, troubleshooting, and system optimization.
1. The Purposeful Logging Approach: Quality Over Quantity
Random, unfocused logging creates more problems than it solves. Every log should be deliberate and valuable:
Instead of this:
"Function started"
"Function completed"
"Database called"
"Response received"
Do this:
"Order #12345 processing started for customer cust_89761 with 3 items totaling $127.45"
"Order #12345 payment verification successful via payment provider stripe"
"Order #12345 processing completed in 237ms with status CONFIRMED"
Implementation tips:
- Review your most verbose components and identify logs with limited troubleshooting value
- Create team guidelines for what deserves logging (state changes, business events, errors)
- Use sampling for high-volume, low-importance events (log every 100th request instead of every request)
- Schedule quarterly "log audits" to prune unnecessary logging
2. Context Is Everything: Information-Rich Logging
A log without context is a mystery when you need answers. Rich contextual information transforms vague clues into clear evidence:
Instead of this:
"Payment failed"Do this:
"Payment processing failed for user 12345 (user.email=john@example.com) due to expired credit card (error code: CARD_EXPIRED, transaction_id: tx_5791623, payment_provider: stripe, amount: $59.99, subscription_plan: premium_annual)"Implementation tips:
- Include unique identifiers for entities (user IDs, transaction IDs, request IDs)
- Log relevant business parameters (amounts, plan types, quantities)
- Add technical context (server name, service version, request duration)
- Include downstream dependencies (which database, which API)
- Use request tracing IDs consistently across service boundaries
3. Structured Consistency: The Foundation of Effective Log Analysis
Consistent, structured log formats across your entire system are what separate amateur logging from professional observability:
Instead of this (inconsistent formats):
[03/18/2025] ERROR: Database connection failed
2025-03-18T10:15:30Z | Payment service | User checkout error - credit card invalid
[WARN] 2025/03/18 10:15:45 +0000 - Rate limit approaching for API endpoint /api/products
Do this (consistent structured logs):
{"timestamp":"2025-03-18T10:15:30Z", "level":"ERROR", "service":"database", "message":"Connection failed", "error_code":"CONNECTION_TIMEOUT"}
{"timestamp":"2025-03-18T10:15:30Z", "level":"ERROR", "service":"payments", "message":"User checkout error", "error_details":"credit card invalid", "user_id":"user_12345"}
{"timestamp":"2025-03-18T10:15:45Z", "level":"WARN", "service":"api-gateway", "message":"Rate limit approaching", "endpoint":"/api/products", "current_rate":"95/100"}
Implementation tips:
- Create a shared logging library or config that all services use
- Use a consistent timestamp format (ISO 8601 is recommended)
- Standardize field names across services (e.g., always "user_id" not sometimes "userId" or "user")
- Document your logging standards and review them during code reviews
- Consider using OpenTelemetry for a standardized approach
4. Alert Intelligence: Building Notifications That Drive Action Without Fatigue
Alert fatigue isn't just annoying – it's dangerous. When engineers ignore noisy alerts, critical issues get missed. Strategic alerting focuses attention where it's needed:
Instead of this (noisy alerting):
- Alert on every error log
- Alert on fixed thresholds without context (e.g., CPU > 80%)
- Same severity for all issues
Do this (intelligent alerting):
- Alert on patterns and anomalies (sudden increase in error rate)
- Use dynamic thresholds based on historical patterns
- Multi-level alerting with appropriate urgency (SMS for critical, email for warning)
- Group-related alerts to prevent notification storms
- Include actionable context in alerts
Implementation tips:
- Implement alert suppression for repeated similar issues
- Use tools that support anomaly detection rather than fixed thresholds
- Route different alert types to different channels based on urgency
- Include runbooks or troubleshooting tips directly in alert messages
- Track your team's "alert fatigue index" (what percentage of alerts require no action)
5. Strategic Retention: The Smart Approach to Log Lifecycle Management
Storing logs forever isn't just expensive – it can also slow down searches and queries. A strategic retention policy balances cost, performance, and compliance:
| Log Type | Retention Period | Rationale | Storage Strategy |
|---|---|---|---|
| Security & Audit Logs | 1-2 years | Compliance requirements, breach investigation | Compressed cold storage, potentially immutable |
| Error & Exception Logs | 3-6 months | Pattern analysis, regression detection | Standard storage with indexing |
| Transaction Logs | 1-3 months | Customer support, business analytics | Standard storage with indexing |
| Debug & Verbose Logs | 7-14 days | Immediate troubleshooting only | Fast storage, potentially reduced indexing |
| Health & Heartbeat Logs | 3-7 days | Recent system status only | Sampling or aggregation |
Implementation tips:
- Implement log shipping to move older logs to cheaper storage
- Use sampling for high-volume, low-value logs
- Create different indices or buckets based on log criticality
- Document retention policies for compliance purposes
- Implement automated log archiving and purging processes
Wrapping Up
Website logging might not have the flash and excitement of the latest deployment tools or cloud platforms, but it has something far more valuable: the power to transform chaos into clarity when systems fail.
Revisit your logging strategy quarterly to ensure it continues to serve your changing needs.
FAQs
1. What is website logging?
Website logging is the process of recording events, errors, and user interactions on a website. These logs help diagnose issues, track performance, and improve security.
2. Why is website logging important?
It helps detect errors, monitor user activity, ensure security compliance, and optimize website performance by identifying bottlenecks.
3. What are the different types of website logs?
Common types include access logs (visitor details), error logs (system failures), application logs (backend processes), and security logs (unauthorized access attempts).
4. Where are website logs stored?
Logs can be stored on local servers, cloud storage solutions, or dedicated log management platforms like Last9, Loki, or Splunk.
5. How do I analyze website logs?
You can use tools like ELK Stack, Grafana Loki, or Last9 to filter, search, and visualize log data, making it easier to spot trends and troubleshoot issues.
6. How long should website logs be retained?
Retention policies vary based on compliance requirements and storage costs, but logs are typically kept for weeks to months, with critical logs stored longer.
7. How can I prevent website logs from consuming too much storage?
Using structured logging, compression, and cloud storage solutions like S3 can help manage log size. Implementing log rotation and retention policies also keeps storage under control.

