

The Linux OOM Killer is a kernel mechanism that terminates memory-hogging processes when your system runs out of RAM and swap space, preventing total system crashes.
When available memory drops to critical levels, the kernel calculates a "badness score" for each running process and kills the highest-scoring one to free up resources. This happens automatically, often without warning, which is why production teams spend hours debugging mysterious container restarts or service degradations that turn out to be silent OOM kills.
The OOM Killer isn't the problem—it's doing exactly what it's designed to do. The real challenge is knowing when it's about to strike and which processes are at risk before your users notice degraded performance. This guide covers how the OOM Killer works, how to interpret its behavior, and how to monitor memory pressure across your infrastructure before things go wrong.
What is the OOM Killer?
The OOM Killer (Out-of-Memory Killer) is a last-resort mechanism in the Linux kernel that prevents complete system failure when memory resources are exhausted. When both RAM and swap space run low, the kernel activates the OOM Killer to identify and terminate processes consuming excessive memory.
Without this mechanism, a system under memory pressure would freeze entirely, requiring a hard reboot and potentially causing data loss or corruption. The OOM Killer makes a calculated decision about which process to sacrifice, prioritizing system stability over individual process survival.
This isn't just a theoretical concern. In containerized environments running dozens or hundreds of services, a single memory leak in one container can trigger cascading OOM kills across your cluster. The kernel is making these decisions in milliseconds, and by the time you check your logs, multiple processes may have already been terminated.
How the OOM Killer Functions in a Linux System
The OOM Killer activates when the Linux kernel detects that both physical memory and swap space are exhausted. It doesn't wait for memory to be completely gone—it acts preemptively when allocation requests can't be satisfied.
The selection process isn't random. The kernel calculates a "badness score" for every running process based on:
- Memory footprint: Processes using more memory get higher scores
- Process runtime: Longer-running processes score lower (they're likely important)
- Root privileges: Processes running as root are penalized less
- Nice value: Lower-priority processes (higher nice values) score higher
- OOM adjustment: Manual tuning via
oom_score_adjoverrides other factors
The process with the highest badness score gets terminated. The kernel logs this decision to /var/log/messages or your system journal, but in fast-moving production environments, these logs often get buried under thousands of other events.
The "sacrifice child" principle
When choosing between a parent process and its children, the kernel prefers to kill child processes first. This is called the "sacrifice child" principle. It helps maintain stability by keeping critical parent processes alive—think of a web server parent spawning worker processes, or a database server managing connection handlers.
However, this doesn't always work in your favor. If a parent process keeps spawning memory-hungry children, the OOM Killer will repeatedly terminate children while the root cause (the parent) continues running.
For containerized workloads, this gets more complex. Kubernetes monitors container_memory_working_set_bytes (not total memory usage) and applies its own OOM logic on top of the kernel's. A pod can be OOM-killed by either the kernel or the kubelet, and without per-container visibility, you won't know which happened or why.
How to View OOM Score in Linux
Every process in Linux has two key files in /proc/[pid]/:
oom_score: The current calculated badness score (read-only)oom_score_adj: An adjustment value you can modify (-1000 to 1000)
To view a process's current OOM score:
cat /proc/[pid]/oom_scoreHigher scores mean higher kill probability. A score of 0 is ideal for critical system processes.
To adjust the score and protect a critical process:
echo -1000 > /proc/[pid]/oom_score_adjA value of -1000 makes the process nearly unkillable. A value of 1000 marks it as the first target. Most processes default to 0.
In production, you'll want to automate this. For example, you can configure systemd units to set OOMScoreAdjust=-1000 for critical services, or use Kubernetes annotations to set oom_score_adj for specific containers.
But here's the thing: manually adjusting OOM scores is reactive. You're essentially saying "don't kill this process" without addressing why memory pressure exists in the first place. Last9's high-cardinality observability tracks memory growth patterns per-pod and per-container in real-time, letting you fix memory leaks before they trigger OOM events.
How to Interpret Memory Usage Metrics
Understanding what the kernel is actually measuring is crucial for debugging OOM situations. The key metrics are:
- total_vm: Total virtual memory mapped by the process, including swapped memory
- anon-rss: Anonymous Resident Set Size—heap and stack memory not backed by files
- file-rss: File-backed memory—mapped files and shared libraries
The OOM Killer primarily cares about RSS (Resident Set Size), not virtual memory. A process might have gigabytes of virtual memory mapped but only consume megabytes of actual RAM.
You can view these metrics via /proc/[pid]/status:
cat /proc/[pid]/status | grep -E 'VmRSS|VmSize'Or use smem for more detailed per-process memory breakdowns:
smem -r -k | head -20Why aggregated metrics miss OOM root causes
Most monitoring tools aggregate memory metrics across nodes or services, showing you average memory usage or total consumption. This hides the critical detail: which specific container or process is approaching its limit.
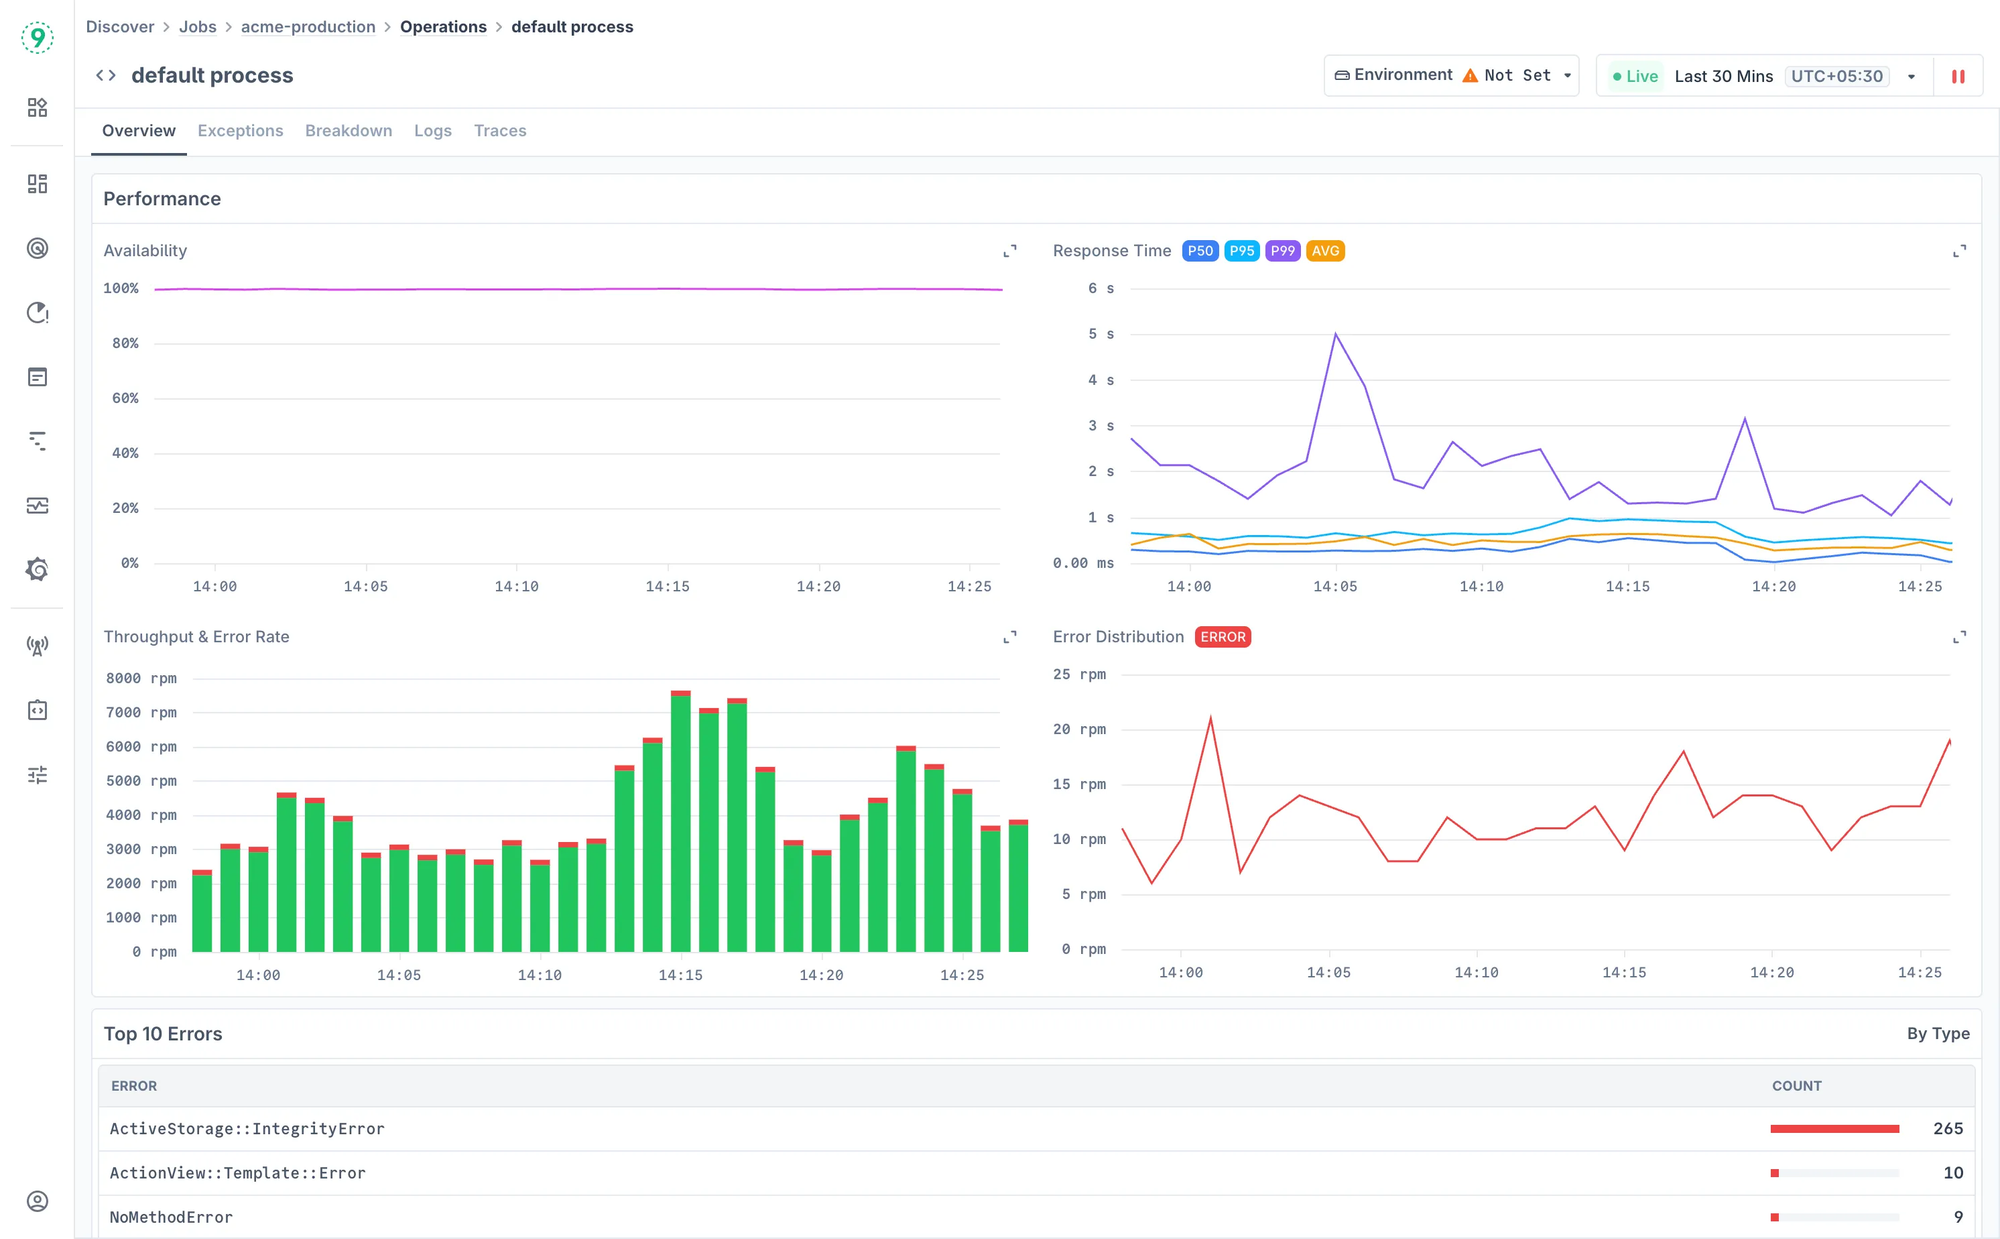
When your service shows a healthy 250ms average response time, you might miss that specific pods are hitting memory limits and restarting mid-request—dragging down performance for a subset of users you can't identify.
High-cardinality observability changes this equation. Instead of "memory usage is high," you get "payment-service-pod-7f8c on node us-east-2a is approaching memory limits with sustained growth over 4 hours." This precision transforms debugging from hours of investigation into minutes of targeted response.
The key metric the OOM Killer actually monitors—container_memory_working_set_bytes, not container_memory_usage_bytes—requires per-container tracking. Cached data (included in usage_bytes) can be reclaimed, but working_set_bytes represents memory under active use. Without tracking this at high cardinality, you're measuring the wrong thing.
OOM Killer in Kubernetes: What's Different
Kubernetes adds a layer of complexity to OOM behavior. The kubelet monitors container_memory_working_set_bytes and terminates pods that exceed their memory limits, independent of the kernel's OOM Killer.
This creates two potential kill paths:
- Kernel OOM Kill: Node runs out of memory, kernel kills processes
- Kubelet OOM Kill: Container exceeds its memory limit, kubelet terminates the pod
Both show up as container restarts, but the root cause and solution are different.
Key metrics to track per-pod
container_memory_working_set_bytes: What the kubelet actually monitors for OOM decisionskube_pod_container_status_restarts_total: Reveals silent OOM restart cyclescontainer_memory_rss: Actual resident set sizecontainer_memory_cache: Cached data that can be reclaimed under pressure
Without per-pod cardinality, you're flying blind when a single bad deployment drains memory across your cluster. Node-level metrics won't tell you which pod is causing the problem until it's too late.
Last9 tracks these metrics with full pod, namespace, and deployment labels preserved—no sampling, no aggregation. You can correlate memory pressure with trace data to see exactly which API calls or background jobs are leaking memory.
Step-by-Step Process to Manually Initiate OOM
Sometimes you need to trigger the OOM Killer manually—for testing, reproducing issues, or validating that your monitoring catches OOM events.
The simplest approach is to use the stress utility to allocate memory:
stress --vm 2 --vm-bytes 2G --timeout 60sThis spawns two worker processes, each allocating 2GB of memory, running for 60 seconds. On a system with limited memory, this will trigger the OOM Killer.
Alternatively, you can trigger it more directly by writing to the kernel's magic SysRq interface:
echo f > /proc/sysrq-triggerThis immediately invokes the OOM Killer without waiting for actual memory exhaustion. Use this carefully—it will kill a process immediately.
Key considerations before manually triggering OOM
Don't do this blindly. Check your system state first:
- Swap space:
swapon --showto see available swap - Free memory:
free -hfor current memory status - Page cache:
cat /proc/meminfo | grep -i cacheto see reclaimable memory
Running OOM tests on production systems is risky. The kernel might kill processes you didn't expect—including SSH sessions, monitoring agents, or critical services.
If you're testing OOM behavior in staging, make sure you're also testing that your observability catches it. The point isn't just to see that OOM kills happen—it's to verify you'll know when they do.
How to Enable and Configure OOM Killer Behavior
The OOM Killer is enabled by default in Linux, but you can tune its behavior through kernel parameters.
The most important parameter is vm.overcommit_memory, which controls how the kernel handles memory allocation requests:
0(default): Heuristic overcommit—kernel estimates if memory is available1: Always overcommit—never refuse allocations2: Never overcommit—only allow allocations backed by swap + RAM
To enable memory overcommit:
echo 1 > /proc/sys/vm/overcommit_memoryMake it persistent across reboots:
echo "vm.overcommit_memory=1" >> /etc/sysctl.conf
sysctl -p
Setting this to 1 tells the kernel to always honor allocation requests, which sounds dangerous but is actually how most production systems run. Applications often allocate more memory than they use, and the kernel is smart enough to handle this.
Customizing OOM behavior per process
For critical processes that should never be killed, set their oom_score_adj to -1000:
echo -1000 > /proc/$(pidof critical-service)/oom_score_adjFor Kubernetes pods, use the oom_score_adj annotation:
apiVersion: v1
kind: Pod
metadata:
  annotations:
    container.apparmor.security.beta.kubernetes.io/app: runtime/default
spec:
  containers:
  - name: critical-app
    image: critical-app:latest
    securityContext:
      capabilities:
        add: ["SYS_RESOURCE"]
You can also adjust swap behavior with vm.swappiness:
echo 60 > /proc/sys/vm/swappinessA value of 60 means the kernel will swap moderately. Lower values (10-20) reduce swapping, keeping more in RAM. Higher values (80-100) swap more aggressively.
Best Practices for Managing Memory and Preventing OOM Kills
Preventing OOM kills is better than reacting to them. Here's what actually works in production:
1. Set appropriate memory limits
For containers, always set both requests and limits:
resources:
  requests:
    memory: "256Mi"
  limits:
    memory: "512Mi"
Requests ensure scheduling on nodes with available memory. Limits prevent a single container from consuming all node resources.
2. Monitor memory trends, not just current usage
A service using 70% of its memory limit isn't necessarily a problem—unless it's been growing steadily for hours. Track memory growth rate, not just current consumption.
3. Configure swap appropriately
Swap can prevent OOM kills, but adds latency. For latency-sensitive services, disable swap entirely. For background workers, moderate swap (vm.swappiness=10-30) can buffer temporary spikes.
4. Use memory profiling in development
Don't wait for production OOM kills. Tools like valgrind, heaptrack, and language-specific profilers (Go's pprof, Python's memory_profiler) catch leaks during development.
5. Track OOM events across your entire fleet
Node-level metrics won't tell you which service is causing problems. You need per-container visibility with historical context—what was memory usage 5 minutes before the kill? Which API endpoint was being hit?
This is where generic monitoring falls short. Tools built for VM-era infrastructure aggregate metrics to control costs, losing the per-container detail that's essential for debugging OOM issues in modern environments.
How Last9 Solves the OOM Visibility Problem
Most observability platforms weren't built for the cardinality that modern infrastructure generates. When you're running hundreds of microservices across thousands of containers, tracking memory metrics per pod generates millions of time series.
Traditional tools handle this by sampling or aggregating—showing you average memory usage across multiple pods, or dropping labels to reduce cardinality. This optimization makes OOM debugging nearly impossible. You know memory is high somewhere, but you can't pinpoint which container or why.
Last9 was built differently. High-cardinality observability from day one means tracking container_memory_working_set_bytes with full pod, namespace, deployment, and node labels preserved—no sampling, no dropped labels.
Understand which labels drive your memory metrics
container_memory_working_set_bytes grows quickly when you attach rich labels—pod, namespace, deployment, node, container, and your own application metadata. Most backends struggle here because high-cardinality metrics become expensive or force you to trim labels.
Last9 handles this differently. High-cardinality support is built in, so you keep every label without sampling or dropping context.
With Cardinality Explorer, you can:
- See which labels and values contribute most to metric growth
- Track cardinality trends over a 7-day window
- Spot spikes caused by new deployments or label changes
- Identify exactly where memory metric blowups originate
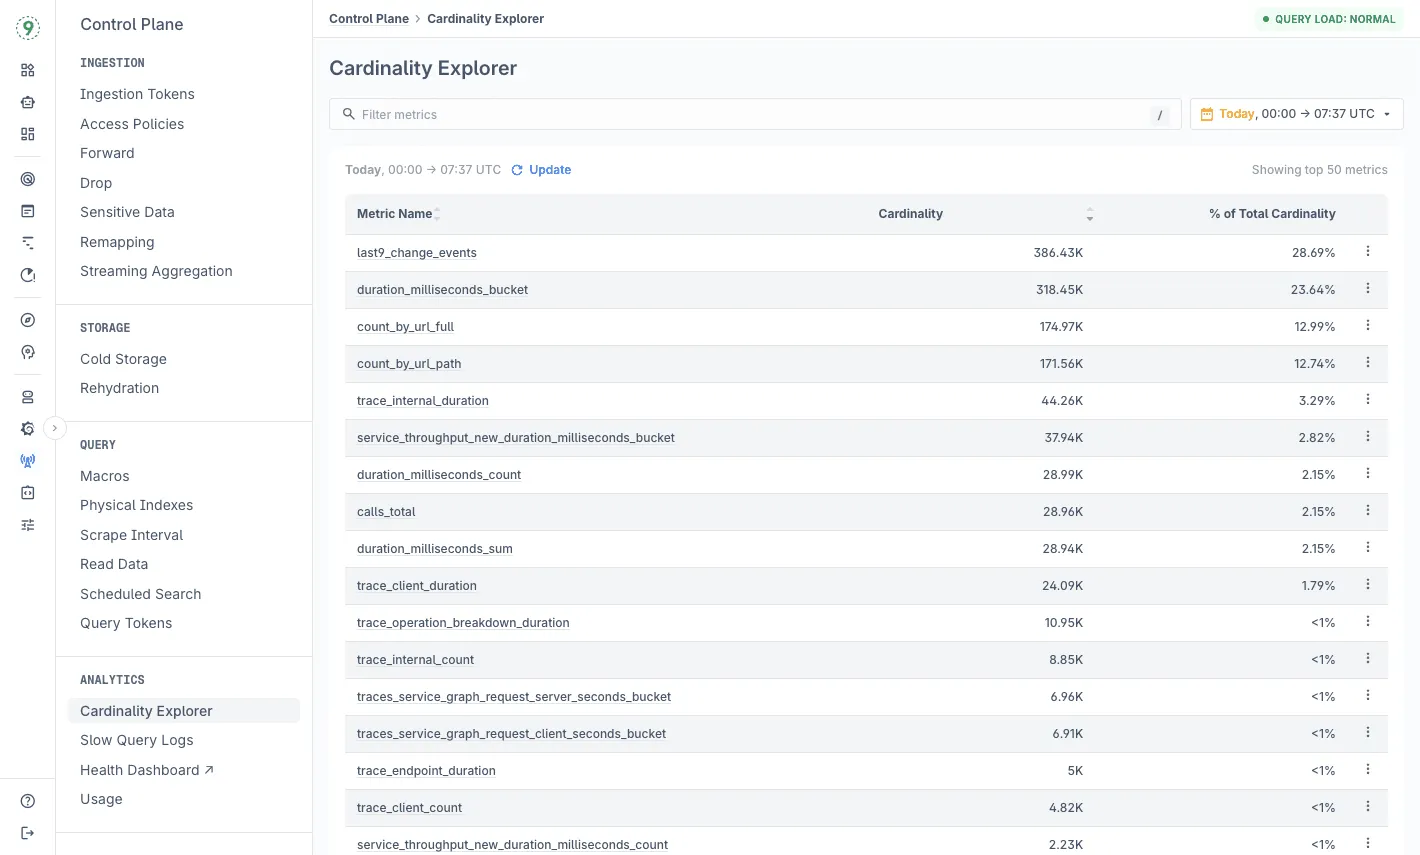
For example, if your memory metrics suddenly jump from 10K to 100K time series, Cardinality Explorer shows you it's because a new deployment added ephemeral pod names as labels.
You keep the debugging context you need while understanding the cost. This turns debugging from "memory is high somewhere" into "payment-service-pod-7f8c leaked 400MB processing webhook retries starting at 14:23 UTC."
You can set alerts on these patterns, or just scan a dashboard before deployments to identify issues early.
Start monitoring memory pressure across your fleet or book sometime with us for a detailed walkthrough!
FAQs
What is the Linux OOM Killer?
The Out-of-Memory (OOM) Killer is a Linux kernel mechanism that terminates processes when the system runs out of memory and swap space. It calculates a "badness score" for each process and kills the highest-scoring one to free resources and prevent system crashes.
How does the OOM Killer decide which process to kill?
The kernel assigns each process a badness score based on memory usage, CPU consumption, runtime, privileges, and manual adjustments via oom_score_adj. Processes using more memory score higher. Long-running and root processes score lower. The highest-scoring process gets terminated first.
Can I prevent the OOM Killer from terminating certain processes?
Yes. Adjust the oom_score_adj value for specific processes. Set it to -1000 to make a process nearly unkillable, or 1000 to mark it as the first target. For systemd services, use OOMScoreAdjust=-1000 in the unit file. For Kubernetes, set it via pod annotations.
How can I manually trigger the OOM Killer for testing?
Use the stress utility to force memory allocation: stress --vm 2 --vm-bytes 2G --timeout 60s. Or trigger it directly via SysRq: echo f > /proc/sysrq-trigger. Be careful—this will immediately kill a process, which can affect running services.
What is the "sacrifice child" principle in OOM Killer?
When choosing between a parent process and its children, the kernel prefers killing children first. This preserves critical parent processes like database servers or web server masters while still freeing memory by terminating worker or handler processes.
What's the difference between container_memory_usage_bytes and container_memory_working_set_bytes?
container_memory_usage_bytes includes cached data that can be reclaimed under pressure. container_memory_working_set_bytes is what the kubelet actually monitors for OOM decisions—it's memory under active use, excluding reclaimable cache. Always monitor working_set_bytes, not usage_bytes.
How do I know if my container was OOM-killed by Kubernetes or the kernel?
Check kubectl describe pod output. If it shows OOMKilled with exit code 137, the kubelet terminated it for exceeding memory limits. Kernel OOM kills appear in system logs (/var/log/messages or journalctl -k). Both show as container restarts, but the fix is different—kernel kills need node-level memory investigation, kubelet kills need container limit adjustments.
What are the risks of manually triggering the OOM Killer?
The kernel might kill unexpected processes—including your SSH session, monitoring agents, or critical services. Always check swap space, free memory, and page cache before triggering OOM manually. Never do this on production systems without understanding the blast radius.

