

We’ve covered how to get LangChain traces up and running. But even when everything’s instrumented, traces can still go missing, show up half-broken, or look nothing like what you expected.
This guide is about what happens after setup, when traces exist, but something’s off.
Whether you’ve followed our earlier posts or set things up your own way, this covers the common reasons LangChain and LangGraph traces fail and how to fix them using OpenTelemetry and Last9’s trace search.
Before you start, make sure:
- Your app is exporting traces via OpenTelemetry
- LangChain callbacks (or a custom handler) are configured
The Invisible Trace Problem
Your app works. Users get responses. Logs show successful API calls. But when you check your tracing UI, you find:
- Fragmented traces: Spans exist but aren’t linked together
- Missing spans: Some steps don’t show up at all
- Orphaned spans: Spans that exist but aren’t tied to any main flow
- Timing gaps: Long delays between spans with no clear cause
This isn’t a monitoring issue, it’s a tracing problem. And it’s common with LangChain apps.
If you’re new to OpenTelemetry or want a refresher on how it fits into observability, this guide covers the basics clearly.
Why Traces Break in LangChain and LangGraph Apps
LangChain and LangGraph rely on async execution (non-blocking tasks), threading (parallel operations), and dynamic workflows (logic that adapts at runtime), all of which make tracing less predictable and harder to stitch together.
Let’s break down each cause and what you can do to fix it.
1. Async Context Isn’t Propagating
LangChain apps often rely on async tasks, whether you’re processing documents in parallel, running multiple chains at once, or kicking off background jobs. But OpenTelemetry’s context doesn’t automatically flow across these async boundaries. So when tasks run concurrently, the spans they create often get disconnected from the parent span.
What This Looks Like:
- Async spans show up as separate traces
- LLM or tool spans aren’t linked to the main chain
- Parallel tasks create orphaned spans with no clear root
Example: Broken Context
async def process_documents(documents):    tasks = [process_single_doc(doc) for doc in documents]    return await asyncio.gather(*tasks)
# Context is lost — spans created here won't be connectedresults = await asyncio.gather(    chain.ainvoke({"query": query1}),    chain.ainvoke({"query": query2}))
How to Fix It: Manually Pass Context
Use context.attach() to ensure the current context is preserved across async tasks.
from opentelemetry import trace, context
async def process_documents_with_context(documents):    current_context = context.get_current()
    async def process_with_context(doc):        token = context.attach(current_context)        try:            with trace.get_tracer(__name__).start_as_current_span(                "process_document", attributes={"document.id": doc["id"]}            ):                return await process_single_doc(doc)        finally:            context.detach(token)
    tasks = [process_with_context(doc) for doc in documents]    return await asyncio.gather(*tasks)
How to Validate It
Run a small test to confirm context linkage:
with trace.get_tracer(__name__).start_as_current_span("test_batch") as root: await process_documents_with_context([{"id": "doc1"}, {"id": "doc2"}])You should see both "process_document" spans correctly linked to the "test_batch" span.
2. Instrumentation Conflicts with Middleware
When using frameworks like FastAPI or libraries like SQLAlchemy that are already auto-instrumented, adding LangChain’s custom callbacks can cause overlap. Spans might be duplicated, callbacks might fire multiple times, or not at all. This usually happens when LangChain callbacks are added to an app that’s already traced via middleware.
What This Looks Like:
- Duplicate spans for the same operation
- Spans starting or ending at the wrong time
- Callbacks executing twice, or being skipped entirely
Example: Conflicting Layers
from opentelemetry.instrumentation.fastapi import FastAPIInstrumentor
FastAPIInstrumentor.instrument_app(app)
@app.post("/generate")async def generate(request: Request):    return chain.invoke({"query": request.query}, config={"callbacks": [custom_callback]})
Fix: Respect Existing Context
Ensure LangChain spans are created as children of active spans from upstream layers like HTTP handlers. You can do this by checking the current span and adjusting the kind accordingly:
class CoordinatedCallback(BaseCallbackHandler):    def __init__(self):        self.tracer = trace.get_tracer(__name__)        self.active_spans = {}
    def on_chain_start(self, serialized, inputs, **kwargs):        parent = trace.get_current_span()        span_ctx = self.tracer.start_as_current_span(            f"langchain.{serialized.get('name', 'chain')}",            kind=trace.SpanKind.INTERNAL if parent and parent.is_recording() else trace.SpanKind.SERVER        )        self.active_spans[kwargs.get('run_id')] = span_ctx
Confirm the Trace Structure
Make a test endpoint to verify that your spans are nested properly:
@app.post("/test-coordination")async def test_coordination(request: Request): callback = CoordinatedCallback() return chain.invoke({"query": "test"}, config={"callbacks": [callback]})You should now see a clean trace structure like:
FastAPI HTTP span → langchain.chain → langchain.llm
3. When You’ve Added Too Many Exporters
Sometimes you wire up multiple exporters: maybe one to Jaeger for local testing, another to Last9 for production, and a third that dumps to the console. Seems harmless, right?
But here’s the problem: OpenTelemetry doesn’t coordinate between exporters. Each exporter receives the same spans, and they all try to process them independently. That can lead to missing data in some tools, lag in exporting spans, or even memory issues from overloaded buffers.
Here’s how that happens:
trace.get_tracer_provider().add_span_processor(BatchSpanProcessor(jaeger_exporter))trace.get_tracer_provider().add_span_processor(BatchSpanProcessor(otlp_exporter))trace.get_tracer_provider().add_span_processor(SimpleSpanProcessor(console_exporter))Each exporter kicks off its batch processor, and if one of them blocks, they all feel it.
The safer approach? Pick one production-grade exporter (usually OTLP to Last9), and keep additional ones limited to local environments:
from opentelemetry.exporter.otlp.proto.grpc.trace_exporter import OTLPSpanExporterfrom opentelemetry.sdk.trace.export import BatchSpanProcessor, SimpleSpanProcessor
otlp_exporter = OTLPSpanExporter(    endpoint="https://otlp.last9.io:443",    headers={"Authorization": f"Bearer {os.getenv('LAST9_API_KEY')}"})
trace.get_tracer_provider().add_span_processor(BatchSpanProcessor(otlp_exporter))
# For debugging onlyif os.getenv("ENVIRONMENT") == "development":    trace.get_tracer_provider().add_span_processor(SimpleSpanProcessor(ConsoleSpanExporter()))
To confirm that everything’s wired correctly and spans aren’t getting lost or duplicated, try a quick sanity check:
for i in range(100): with tracer.start_as_current_span(f"test_span_{i}"): passYou should see those spans show up cleanly in your Last9 traces, with no surprises.
4. When LangGraph Nodes Don’t Show Up
LangGraph’s strength lies in its flexibility, conditional logic, branching paths, and custom state transitions. But that flexibility can make tracing tricky.
If you’ve written raw node functions or built your routing logic, you might notice missing spans, orphaned node executions, or entire branches that vanish from your traces.
Take this basic node as an example:
def custom_analyzer_node(state): return {"analysis": expensive_analysis_call(state["input"])}If you don’t wrap it with tracing logic, OpenTelemetry has no idea this operation even exists. The trace just skips over it. Instead, use a decorator that starts a new span for each node, and add useful metadata like the node name and state keys:
from functools import wrapsfrom opentelemetry import trace
def trace_node(name):    def decorator(fn):        @wraps(fn)        def wrapper(state):            with trace.get_tracer(__name__).start_as_current_span(                f"langgraph.node.{name}",                attributes={                    "langgraph.node.name": name,                    "langgraph.state.keys": list(state.keys())                }            ):                return fn(state)        return wrapper    return decorator
@trace_node("analyzer")def custom_analyzer_node(state):    return {"analysis": expensive_analysis_call(state["input"])}
Once your nodes are properly wrapped, build and invoke your LangGraph app as usual:
graph = StateGraph(StateType)graph.add_node("analyzer", custom_analyzer_node)graph.add_node("responder", responder_node)graph.add_edge("analyzer", "responder")graph.add_edge("responder", END)
app = graph.compile()app.invoke({"input": "test"})
In Last9’s Trace Explorer, you’ll now see the full execution:
langgraph.execution → analyzer → responder — with all relevant state transitions and timings in place.
You’ve instrumented the basics, and traces are flowing. But once your app starts handling async chains, parallel calls, or long-running workflows, things can get messy. Spans might break apart. Context might disappear. And without warning, trace quality starts to drop.
This next section walks through a few ways, such as how to validate your spans, correlate related traces, and detect when traces silently fail or leak over time.
Now, when a trace breaks or a span goes missing, use Last9 MCP to bring the full context, logs, metrics, and traces, into your IDE and debug it with real data.
Advanced Debugging Strategies Using OpenTelemetry
Here are three key debugging techniques that help you identify problems early and keep your traces clean and reliable.
1. Validate Your Traces During Development
Traces often look fine during local testing, but start breaking down under real load. You might see missing spans, incorrect timings, or spans that lack useful context.
To identify these issues, create a simple validator that tracks which spans you expect and checks if any are missing or out of order. It also warns if spans have no attributes or if error spans don’t show exception details.
Here’s a basic example:
import loggingfrom opentelemetry import tracefrom opentelemetry.sdk.trace import ReadableSpan
class TraceValidator:    def __init__(self):        self.logger = logging.getLogger(__name__)        self.expected_spans = set()        self.actual_spans = set()
    def expect_span(self, span_name: str, parent_name: str = None):        self.expected_spans.add((span_name, parent_name))
    def validate_on_end(self, span: ReadableSpan):        span_name = span.name        parent_name = None
        if span.parent:            parent_name = span.parent.span_id
        self.actual_spans.add((span_name, parent_name))
        if span.end_time <= span.start_time:            self.logger.warning(                f"Span {span_name} has invalid timing: "                f"start={span.start_time}, end={span.end_time}"            )
        if not span.attributes:            self.logger.warning(f"Span {span_name} has no attributes")
        if span.status.status_code == StatusCode.ERROR and not span.events:            self.logger.warning(f"Error span {span_name} has no exception details")
    def report_missing_spans(self):        missing = self.expected_spans - self.actual_spans        if missing:            self.logger.error(f"Missing expected spans: {missing}")
        unexpected = self.actual_spans - self.expected_spans        if unexpected:            self.logger.warning(f"Unexpected spans: {unexpected}")
Run this to confirm:
validator = TraceValidator()
validator.expect_span("langchain.chain")validator.expect_span("langchain.llm")validator.expect_span("langchain.prompt")
chain.invoke({"query": "test"}, config={"callbacks": [validator]})
validator.report_missing_spans()
This will help you identify missing or unexpected spans early.
2. Correlate Spans Across Async Workflows
If your app runs multiple async chains or parallel tasks, spans might get disconnected. That makes it hard to see the full flow and debug issues across different parts of your app.
To identify breaks, use a correlation context that groups related spans under a shared ID, linking spans from different async operations into one clear trace tree.
Here’s a helper class to do that:
import threadingfrom contextlib import contextmanagerfrom opentelemetry import trace, context
class SpanCorrelator:    def __init__(self):        self.correlation_map = {}        self.lock = threading.Lock()
    @contextmanager    def correlate_execution(self, execution_id: str, operation_type: str):        tracer = trace.get_tracer(__name__)
        with tracer.start_as_current_span(            f"correlation.{operation_type}",            attributes={                "correlation.id": execution_id,                "correlation.type": operation_type            }        ) as span:            correlation_token = context.set_value("correlation_id", execution_id)
            with self.lock:                self.correlation_map[execution_id] = {                    "root_span": span,                    "child_spans": [],                    "operation_type": operation_type                }
            try:                yield execution_id            finally:                context.detach(correlation_token)
    def add_child_span(self, execution_id: str, child_span):        with self.lock:            if execution_id in self.correlation_map:                self.correlation_map[execution_id]["child_spans"].append(child_span)
    def get_correlation_summary(self, execution_id: str) -> dict:        with self.lock:            if execution_id not in self.correlation_map:                return {}
            correlation = self.correlation_map[execution_id]            return {                "execution_id": execution_id,                "operation_type": correlation["operation_type"],                "child_count": len(correlation["child_spans"]),                "total_duration": self._calculate_total_duration(correlation),                "span_names": [span.name for span in correlation["child_spans"]]            }
Try this to verify:
correlator = SpanCorrelator()
async def test_correlation():    with correlator.correlate_execution("test-123", "multi_chain") as exec_id:        result1 = await chain1.ainvoke({"query": "first"})        result2 = await chain2.ainvoke({"query": "second"})
        summary = correlator.get_correlation_summary(exec_id)        print(f"Correlated {summary['child_count']} spans")
This way, your traces will show connected spans that reflect the full execution path.
3. Detect Trace Leaks and Memory Problems
Incomplete or unclosed spans can pile up in memory, especially in long-running apps. Over time, this leads to sluggish performance or even crashes.
You can spot these leaks by tracking active spans with weak references and periodically checking how many remain. If the count keeps climbing, you’ve likely got a leak.
Here’s a basic leak detector:
import gcimport weakreffrom opentelemetry.sdk.trace import Spanfrom collections import defaultdictimport logging
class TraceLeakDetector:    def __init__(self):        self.span_refs = weakref.WeakSet()        self.span_stats = defaultdict(int)
    def track_span(self, span: Span):        self.span_refs.add(span)        self.span_stats[span.name] += 1
    def check_for_leaks(self):        gc.collect()  # Force garbage collection
        active_spans = len(self.span_refs)        if active_spans > 1000:            logging.warning(                f"High number of active spans: {active_spans}. Possible memory leak."            )
        span_distribution = dict(self.span_stats)        for span_name, count in span_distribution.items():            if count > 100:                logging.warning(                    f"High count for span type '{span_name}': {count}"                )
    def reset_stats(self):        self.span_stats.clear()
Try running:
leak_detector = TraceLeakDetector()
class LeakTrackingCallback(ProductionCallbackHandler):    def on_chain_start(self, serialized, inputs, **kwargs):        super().on_chain_start(serialized, inputs, **kwargs)        if kwargs.get('run_id') in self.spans:            leak_detector.track_span(self.spans[kwargs.get('run_id')])
import threadingimport time
def periodic_leak_check():    while True:        leak_detector.check_for_leaks()        time.sleep(60)  # Check every minute
leak_thread = threading.Thread(target=periodic_leak_check, daemon=True)leak_thread.start()
This will alert you if spans are leaking and help keep your app’s memory stable.
If you’re still setting up instrumentation and not seeing traces yet, start with this guide on getting signals into OpenTelemetry.
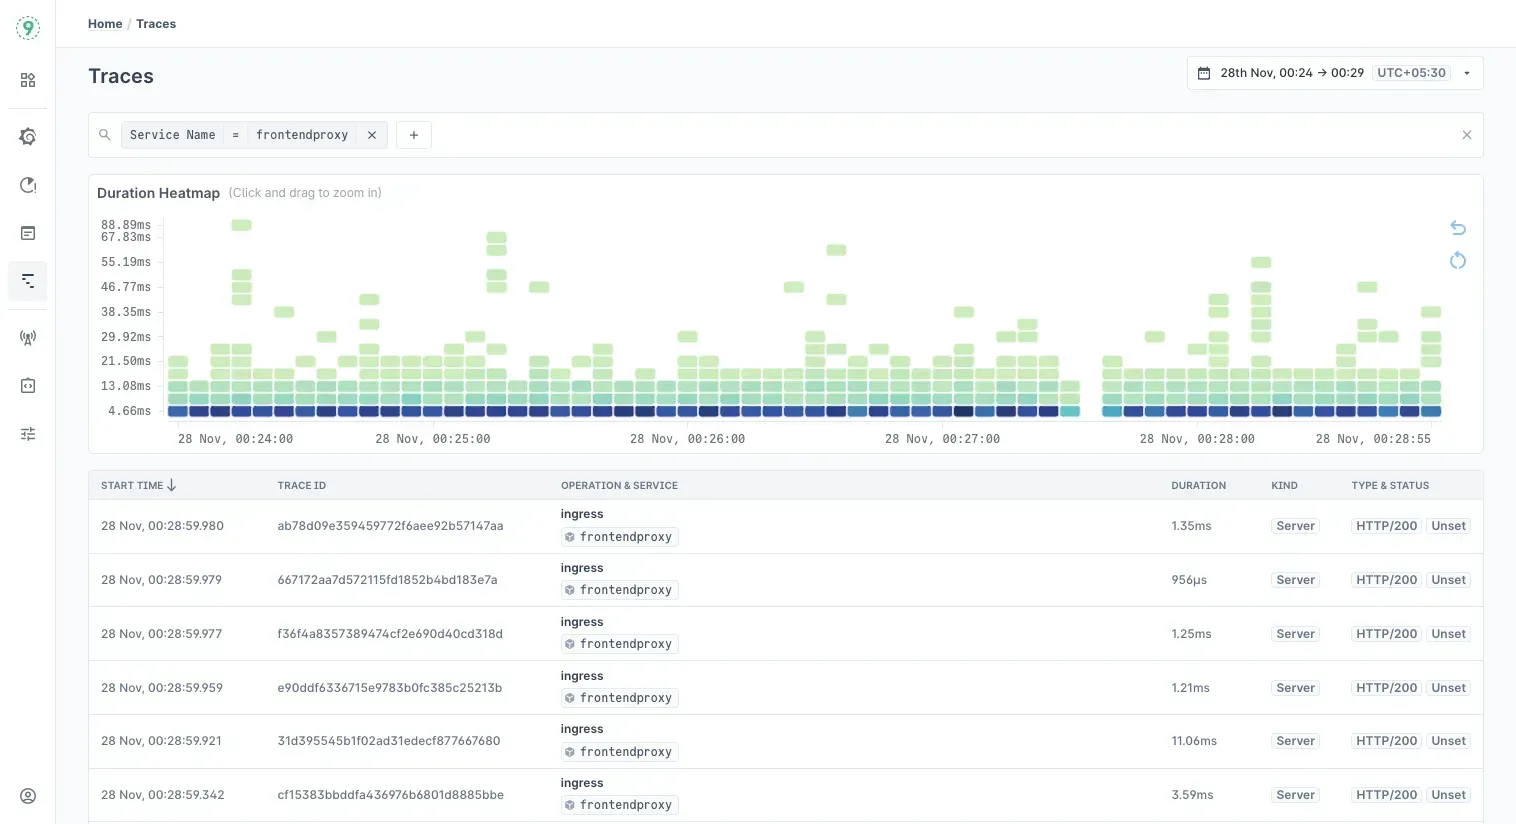
Use Last9’s Trace Search to Troubleshoot LangChain and LangGraph Issues
Once your LangChain or LangGraph instrumentation is set up, Last9’s Trace Explorer helps you dig into your trace data with powerful search queries. This makes it easier to spot hidden problems that don’t show up on regular dashboards.
Here’s how to run some key queries, what they mean, and how to use them to troubleshoot common issues.
How to Run Queries in Last9 Trace Explorer
- Open your Last9 dashboard and go to the Traces Explorer tab.
- Enter your query in the search bar at the top.
- Use filters or aggregation functions as needed.
- Analyze the results to identify missing spans, errors, or performance problems.
1. Spot Missing or Broken Traces
Incomplete or fragmented traces often point to instrumentation gaps.
Find slow traces with too few spans:
service.name="langchain-app" AND duration.ms > 5000 AND span.count < 3Traces longer than 5 seconds with fewer than 3 spans usually mean some steps are missing.
Find error traces missing exception details:
service.name="langchain-app" AND status.code="ERROR" AND NOT has_exception:trueShows error spans without proper exception info, signaling incomplete error tracing.
2. Check Token Usage and Cost Accuracy
Token count mismatches may be caused by missing LLM instrumentation.
Find traces with high token use but no LLM spans:
langchain.tokens.total > 10000 AND NOT span.name:*llm*Analyze cost and tokens by chain:
langchain.cost.usd > 1.0 AND langchain.chain.name="*"| group_by(langchain.chain.name)| avg(langchain.cost.usd), sum(langchain.tokens.total)Helps identify expensive chains and optimize usage.
3. Detect LangGraph Execution Issues
Complex workflows can cause loops or broken async context.
Find possible loops in LangGraph:
langgraph.node.visit_count > 5 AND langgraph.execution.duration_ms > 30000Detect async spans missing children:
service.name="langchain-app" AND trace.span_count = 1 AND operation.type="async"Indicates broken async context propagation.
You’ve explored traces with Last9’s Trace Explorer, finding missing spans, errors, and slow spots. But traces alone don’t tell the whole story. Connecting logs and traces gives you a clearer view of failures and odd behaviors, right down to the breadcrumbs.
Correlate Application Logs with Trace Data
1. Structured Logging for Trace Correlation
Link your logs directly with traces by injecting trace and span IDs automatically into your log entries. This helps you jump from logs to traces effortlessly.
import loggingfrom opentelemetry import trace
class TraceCorrelatedLogger:    def __init__(self, logger_name: str):        self.logger = logging.getLogger(logger_name)
    def log_with_trace_context(self, level: int, message: str, **kwargs):        current_span = trace.get_current_span()        extra_context = {            "trace_id": None,            "span_id": None,            "service.name": "langchain-app"        }        if current_span and current_span.is_recording():            span_context = current_span.get_span_context()            extra_context.update({                "trace_id": format(span_context.trace_id, "032x"),                "span_id": format(span_context.span_id, "016x"),            })        extra_context.update(kwargs)        self.logger.log(level, message, extra=extra_context)
    def info(self, message: str, **kwargs):        self.log_with_trace_context(logging.INFO, message, **kwargs)
    def warning(self, message: str, **kwargs):        self.log_with_trace_context(logging.WARNING, message, **kwargs)
    def error(self, message: str, **kwargs):        self.log_with_trace_context(logging.ERROR, message, **kwargs)
# Example usage in callbackslogger = TraceCorrelatedLogger(__name__)
class EnhancedCallbackHandler(BaseCallbackHandler):    def on_chain_start(self, serialized, inputs, **kwargs):        logger.info(            "Chain started",            chain_name=serialized.get("name", "unknown"),            input_keys=list(inputs.keys()) if isinstance(inputs, dict) else [],            run_id=str(kwargs.get("run_id"))        )
    def on_chain_error(self, error, **kwargs):        logger.error(            "Chain failed",            error_type=type(error).__name__,            error_message=str(error),            run_id=str(kwargs.get("run_id"))        )
2. Log-Trace Correlation Queries in Last9
Last9’s Trace Explorer makes it easy to connect logs and traces through the UI. But if you want more control, you can also run SQL queries directly to dig into the data. Here are a couple of handy queries to try:
Join slow traces with application logs:
SELECT t.trace_id, t.duration_ms, l.message, l.levelFROM traces tJOIN logs l ON t.trace_id = l.trace_idWHERE t.duration_ms > 10000AND l.timestamp > now() - 1hORDER BY t.duration_ms DESCFind traces linked to specific log errors:
SELECT trace_id FROM logsWHERE level="ERROR"AND message LIKE "%OpenAI API%"AND timestamp > now() - 1hThese queries help you find errors and performance issues with the full context of both logs and traces. For a quicker look, the Trace Explorer UI also lets you jump straight from traces to related logs without writing queries.
Once you can search and correlate logs and traces effectively, the next step is to optimize what data you collect and how you watch it in real time. These advanced tips help you focus on the most important signals without getting overwhelmed.
If you’re trying to correlate logs and traces, the Trace Explorer docs walk through how it works in Last9.
Advanced Debugging Tips for Trace Analysis
1. Sample Your Traces
Collecting every trace can quickly overwhelm your system. Sampling helps you keep just the important ones. Here’s a quick way to sample:
- Always keep error traces (timeouts, rate limits, etc.).
- Capture slow or timing-out operations.
- Catch lots of LLM or OpenAI calls since those matter.
- For everything else, pick a small random sample.
import randomfrom opentelemetry.sdk.trace.sampling import Sampler, SamplingResult, Decision
class DebuggingSampler(Sampler):    def __init__(self, base_rate=0.1):        self.base_rate = base_rate        self.error_keywords = ["timeout", "rate_limit", "context_length"]
    def should_sample(self, context, trace_id, name, kind=None, attributes=None, links=None, trace_state=None):        if attributes and any(k in str(attributes).lower() for k in self.error_keywords):            return SamplingResult(Decision.RECORD_AND_SAMPLE)
        if "slow" in name.lower() or "timeout" in name.lower():            return SamplingResult(Decision.RECORD_AND_SAMPLE)
        if "llm" in name.lower() or "openai" in name.lower():            if random.random() < 0.5:                return SamplingResult(Decision.RECORD_AND_SAMPLE)
        if random.random() < self.base_rate:            return SamplingResult(Decision.RECORD_AND_SAMPLE)
        return SamplingResult(Decision.DROP)
This way, you keep your tracing lean but still catch the signals you need.
2. Watch Your Traces Live
It helps to watch trace data as it comes in, so you can catch error spikes or slowdowns before they turn into bigger headaches.
Here’s a simple monitor that:
- Keeps track of recent traces (like the last 100).
- Alerts if errors suddenly spike.
- Flags when latency doubles compared to before.
- Notices when lots of traces have suspiciously few spans (maybe something’s missing).
import timefrom collections import dequefrom threading import Lock
class RealTimeTraceMonitor:    def __init__(self, window_size=100):        self.recent_traces = deque(maxlen=window_size)        self.lock = Lock()        self.alerts = []
    def record_trace(self, trace_id, duration_ms, span_count, has_errors):        with self.lock:            self.recent_traces.append({                "trace_id": trace_id,                "duration_ms": duration_ms,                "span_count": span_count,                "has_errors": has_errors,                "timestamp": time.time()            })        self._check_for_issues()
    def _check_for_issues(self):        if len(self.recent_traces) < 10:            return  # Not enough data yet
        recent = list(self.recent_traces)[-10:]
        # Check error spike        error_rate = sum(t["has_errors"] for t in recent) / len(recent)        if error_rate > 0.3:            self._alert("High error rate detected", {"error_rate": error_rate})
        # Check latency spike        durations = [t["duration_ms"] for t in recent]        if len(durations) >= 5:            recent_avg = sum(durations[-5:]) / 5            older_avg = sum(durations[:5]) / 5            if recent_avg > older_avg * 2:                self._alert("Latency spike detected", {"recent_avg": recent_avg, "older_avg": older_avg})
        # Check low span count traces        low_spans = sum(1 for t in recent if t["span_count"] < 3)        if low_spans > 5:            self._alert("Many traces with low span count", {"low_span_traces": low_spans})
    def _alert(self, message, context):        alert = {"message": message, "context": context, "timestamp": time.time()}        self.alerts.append(alert)        print(f"TRACE ALERT: {message} - {context}")
    def get_health_summary(self):        with self.lock:            if not self.recent_traces:                return {"status": "no_data"}            traces = list(self.recent_traces)            return {                "trace_count": len(traces),                "avg_duration": sum(t["duration_ms"] for t in traces) / len(traces),                "avg_span_count": sum(t["span_count"] for t in traces) / len(traces),                "error_rate": sum(t["has_errors"] for t in traces) / len(traces),                "recent_alerts": len(self.alerts)            }
This monitor keeps you in the loop and lets you identify issues early, saving you from surprises.
When Traces Don’t Tell the Full Story
Good instrumentation doesn’t always mean clear traces. Here are a few common reasons why, and what you can do about them:
- Complex async flows: If you’re using custom async patterns or thread pools, automatic context passing might break. You may need to manage context manually or create custom span handlers.
- Conflicts with third-party tools: Libraries like ORMs, HTTP clients, or vector DBs often come with their instrumentation that can clash with yours. Always test these points carefully.
- Very long spans: Operations running over 5 minutes might hit timeout limits. Try splitting these into smaller chunks or checkpoints.
- Dev vs. production differences: What works smoothly in development can behave differently with a real user load. Make sure to test in environments that mimic production concurrency and volume.
And if you still run into issues or want to explore better observability for your LLM apps, we’re here to help, just book a time with us!

