

Updated on: April 2, 2025
Tracing tools are an essential part of the observability ecosystem, offering a detailed view of the performance of your applications, especially in complex distributed systems.
In this guide, we'll explore some of the most popular open-source and commercial tracing solutions, how they work, and what you should consider when choosing the right tool for your needs.
What are Tracing Tools?
Distributed tracing tools are specialized software solutions that track and visualize the journey of requests as they travel through complex distributed systems. In modern microservices architectures, a single user request might touch dozens of different services before generating a response. Tracing tools capture this journey, making the invisible visible.
The importance of these tools cannot be overstated in today's cloud-native ecosystem:
- Enhanced Debugging: Pinpoint exactly where failures occur in complex service chains
- Performance Optimization: Identify and address latency bottlenecks across service boundaries
- System Understanding: Gain comprehensive visibility into how services interact with each other
- Root Cause Analysis: Quickly determine the origin of production issues
- Capacity Planning: Make informed scaling decisions based on actual service dependencies
As systems grow more distributed, the ability to trace requests becomes not just useful but essential for maintaining reliability and performance.
A Quick Comparison of 7 Leading Tracing Tools
Here’s a quick comparison to help you decide which tool best fits your observability needs:
| Tool | Best For | Pricing Model | Key Strengths |
|---|---|---|---|
| Jaeger | Large teams with DevOps resources | Free, open-source | Distributed monitoring, flexible sampling strategies |
| OpenTelemetry | Teams needing vendor-neutral instrumentation | Free, open-source | Unified traces, metrics, and logs framework |
| Last9 | Teams dealing with high cardinality and need a unified view of logs, metrics, and traces | Pricing based on the number of events ingested | Unified view, cardinality explorer, observability at scale with minimal overhead |
| Zipkin | Small to medium-sized teams | Free, open-source | Low overhead, easy to set up |
| Datadog APM | Enterprises needing unified monitoring | Starts at $31/month per host | AI-powered analysis, seamless integration |
| Grafana Tempo | Teams using Grafana, cost-effective tracing | Free, open-source | Cost-effective trace storage, integrates with Grafana |
| Dynatrace | Large enterprises needing full observability | Starts at $69/month per host | Full-stack observability, AI-powered insights |
7 Popular Tracing Tools for Distributed Systems
From open-source pioneers to enterprise-grade commercial offerings, each solution brings unique capabilities to help teams understand and optimize their distributed systems.
Here's an overview of the most influential tracing tools available today:
Jaeger
Jaeger is an open-source distributed tracing system developed by Uber Engineering. It helps monitor and troubleshoot microservices by providing distributed transaction monitoring across service boundaries.
Jaeger also offers root cause analysis for performance bottlenecks and service dependency analysis with visualization. It supports flexible sampling strategies for high-volume environments and provides pluggable storage backends, including Elasticsearch, Cassandra, and Kafka.
Jaeger’s architecture includes collectors, agents, and a query service with a visualization UI, making it suitable for organizations with dedicated DevOps resources and Kubernetes-based environments.
Jaeger's architecture—consisting of collectors, agents, and a query service with a visualization UI—makes it well-suited for organizations with dedicated DevOps resources and Kubernetes-based environments.
- Best For: Large teams with dedicated DevOps resources or Kubernetes environments.
- Pricing: Open-source and free to use. Infrastructure costs (storage, maintenance, etc.) are additional.
OpenTelemetry
OpenTelemetry is a vendor-neutral standard for collecting telemetry data. It combines the best aspects of OpenTracing and OpenCensus into one comprehensive framework.
OpenTelemetry provides auto-instrumentation for major languages and frameworks, and it works seamlessly with a variety of backends. It also includes a collector component for processing and routing telemetry data.
OpenTelemetry has quickly become the go-to solution for modern observability due to its scalability and broad compatibility.
- Best For: Teams looking for a flexible, vendor-neutral instrumentation framework.
- Pricing: Open-source and free, but you'll need a backend storage/visualization solution (e.g., Jaeger, Last9).
Last9
Last9 is built specifically for modern cloud-native architectures, offering an integrated observability solution. We simplify trace and metric visualization in one platform, with minimal configuration needed for Kubernetes environments.
We provide advanced trace analytics and offer pre-built dashboards for common service types. Our tool reduces the complexity of observability, making it an excellent choice for teams seeking actionable insights without managing multiple disconnected systems.
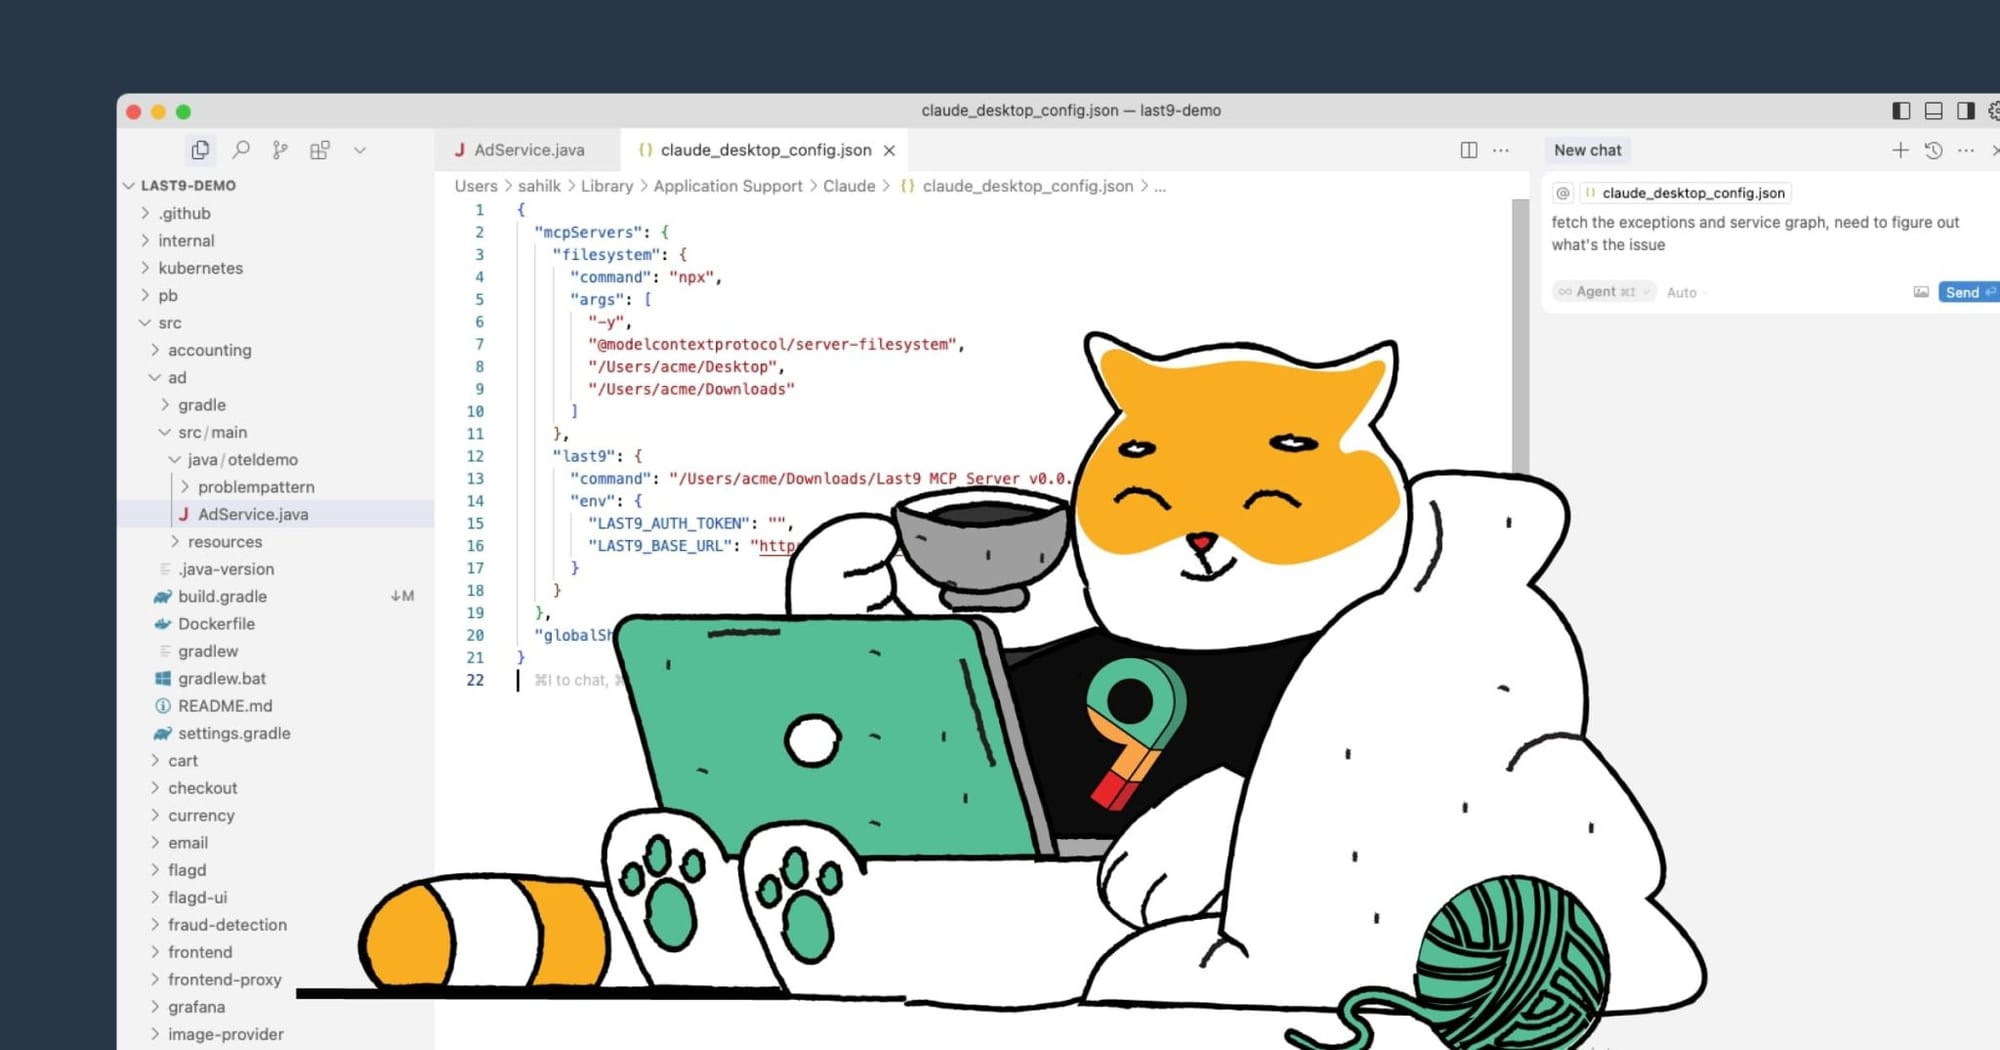
Plus, now with Last9 MCP, you can bring real-time production context — logs, metrics, and traces — into your local environment to auto-fix code faster.
- Unified visualization of metrics and distributed traces
- Simplified operational model with reduced maintenance requirements
- Advanced trace analytics for pattern recognition
- Pre-built dashboards for common service types
- Seamless Kubernetes integration with minimal configuration
Best For: Teams looking for an easy-to-use, integrated solution with low operational overhead.
Pricing: Our pricing is straightforward, based on the number of events ingested. As your data grows, the price reduces.
Zipkin
Zipkin is one of the earliest open-source distributed tracing systems, inspired by Google's Dapper paper. It features a simplified architecture and low operational overhead.
Zipkin supports polyglot environments and offers intuitive trace visualization for debugging. It integrates easily with other monitoring systems and provides a REST API for customization. Zipkin is particularly beneficial for teams new to distributed tracing or those working with limited infrastructure.
- Best For: Small to medium-sized teams or those with limited infrastructure.
- Pricing: Open-source and free, but requires infrastructure management (storage, setup, etc.).
Datadog APM
Datadog APM is a comprehensive application performance monitoring solution that includes distributed tracing capabilities. It offers automatic service discovery and instrumentation, along with AI-powered anomaly detection and root cause analysis. Datadog provides seamless correlation between traces, logs, and metrics, giving users a unified view of their systems. This makes Datadog a good choice for teams looking for a one-stop solution to monitor, analyze, and troubleshoot.
- Best For: Enterprises seeking a unified monitoring solution with minimal configuration.
- Pricing: Starts at $31/month per host for APM. Offers various pricing tiers based on infrastructure needs.
Grafana Tempo
Grafana Tempo is a distributed tracing system developed by Grafana Labs. It uses object stores for exceptionally cost-effective trace storage. Tempo integrates deeply with Prometheus and Loki, offering powerful trace filtering through its TraceQL query language. Tempo supports multiple trace protocols, including Jaeger, Zipkin, and OpenTelemetry. It’s well-suited for high-volume environments, where traditional trace storage can be prohibitively expensive.
- Best For: Teams already using Grafana and those needing cost-effective trace storage.
- Pricing: Open-source and free. Infrastructure costs (e.g., cloud storage) are additional.
Dynatrace
Dynatrace provides an all-in-one enterprise observability platform with AI-driven distributed tracing through its proprietary OneAgent technology. It offers end-to-end transaction capture, automatic service topology mapping, and deep visibility into performance bottlenecks. Dynatrace’s Davis AI automatically detects problems and provides root cause analysis. Its unified platform also includes infrastructure monitoring and digital experience management, making it ideal for large enterprises.
- Best For: Large enterprises needing a unified solution for observability, security, and performance.
- Pricing: Starts at $69/month per host for full-stack observability.
How to Evaluate the Best Tool for Tracing
Selecting the right tracing tool requires careful consideration of several key factors:
Scalability:
- Can the tool handle your current and projected trace volume?
- Does it support intelligent sampling to manage high traffic loads?
- How efficiently does it store and query trace data?
Performance Impact:
- What is the overhead of the tracing instrumentation?
- Does the tool support asynchronous export to minimize latency?
- Are there options to control the granularity of tracing?
Deployment Model:
- Self-hosted vs. SaaS options
- Integration with your existing infrastructure
- Resource requirements and operational complexity
Environment Compatibility:
- Support for cloud-native architectures (Kubernetes, containers)
- Capabilities for serverless environments
- Multi-cloud deployment options
Data Retention and Analysis:
- Query capabilities for finding specific traces
- Visualization features for understanding trace data
- Analytics for identifying patterns and anomalies
Standards Compliance:
- OpenTelemetry compatibility
- Support for W3C Trace Context
- Ability to work with existing monitoring tools
These criteria should be weighted according to your specific organizational needs and technical environment to find the most suitable solution.
Conclusion
Tracing tools are essential for observability, offering valuable insights into system performance, particularly in distributed environments like Kubernetes, microservices, and serverless systems.
To enhance your observability experience and gain deeper insights into your infrastructure, give Last9 a try or talk to us if you'd like to know more about our platform capabilities.
FAQs
What is the best tool for tracing?
The best tracing tool depends on your needs. OpenTelemetry is popular due to its vendor-neutral approach. For visualization, Last9 is great for integrated trace and metric analysis with minimal operational overhead. Other options include Jaeger (open-source, widely used for microservices-based architectures), Datadog APM (comprehensive but commercial), and Grafana Tempo (cost-effective and integrates well with Splunk).
Why are tracing tools important?
Tracing tools help diagnose performance issues in distributed systems, enabling end-to-end visibility. They allow for quicker troubleshooting, track request flows, and optimize system performance by identifying bottlenecks, especially in microservices-based environments. Tracing tools also assist in mapping dependencies, spotting anomalies, and improving resource allocation.
What is a Jaeger tool?
Jaeger is an open-source tool for tracing requests across microservices-based systems. It helps track performance, debug, and visualize dependencies, often used with OpenTelemetry for instrumentation. Jaeger supports various storage formats and is ideal for troubleshooting system issues at scale. It integrates easily with tools like Splunk and GitHub for additional analytics.
How to choose the right distributed tracing tool?
To choose a tool, consider your environment (cloud, on-premises, hybrid), the performance issues you’re troubleshooting, and integration needs. For DevOps teams, tools like Last9 and Grafana Tempo are easy to set up and scale. You should also evaluate backend tools based on their graphs, storage options, and ease of integration with existing monitoring systems.
What are good options for observability for a tiny startup?
For startups, OpenTelemetry and Jaeger are cost-effective, easy-to-deploy options for tracing and observability. Last9 is another great choice, offering quick setup with integrated metrics and tracing at a reasonable cost, reducing the operational complexity. As your team grows, consider upgrading to more advanced tools like Datadog or Splunk for more features.
What tools to use for distributed tracing with OpenTelemetry?
Jaeger, Grafana Tempo, and Last9 all integrate easily with OpenTelemetry for distributed tracing. Jaeger provides solid visualization and is great for DevOps teams, while Last9 simplifies both trace and metric analysis, minimizing operational overhead. Splunk and Datadog offer comprehensive solutions but come with higher costs.
What benefits are achieved by adopting Open Tracing Tools?
Adopting Open Tracing standards like OpenTelemetry provides vendor-neutrality, future-proofing your observability stack. It simplifies instrumentation and unifies end-user telemetry (traces, metrics, logs) for efficient troubleshooting. Open Tracing also integrates well with popular tools like Splunk, offering a scalable observability solution for both small teams and large enterprises.
What sets AWS OpenSearch Service apart?
AWS OpenSearch Service offers a managed backend solution for distributed tracing, supporting tools like Jaeger. It simplifies troubleshooting and performance analysis by integrating well with AWS X-Ray and Splunk. Its high-performance query capabilities and cost-effective pricing make it an excellent choice for tracing in AWS-centric environments.
Can distributed tracing work in serverless environments?
Yes, distributed tracing works in serverless setups like AWS Lambda and Google Cloud Functions, although there are challenges like cold starts. Tools like AWS X-Ray and Google Cloud Trace provide easy integrations for serverless DevOps teams. For more control, OpenTelemetry offers lightweight options tailored for serverless applications.
What are the top network tracing tools for diagnosing connectivity issues?
For network-level tracing, Wireshark, tcpdump, and mtr are essential for diagnosing connectivity issues. Pingplotter helps visualize latency and packet loss, and NetFlow tools like SolarWinds are excellent for deeper network traffic analysis. These tools complement distributed tracing tools like Jaeger or Last9, providing a complete view of system performance.
What are the key features to look for in APM and tracing tools?
Look for tools with comprehensive instrumentation that support microservices-based environments, intuitive graphs and visualization, and effortless DevOps integration. The best tools offer anomaly detection, root cause analysis, and effective sampling strategies. Tools like Last9 excel at integrating tracing and metrics with minimal overhead.
What are the most popular network tracing tools available today?
The most popular network tracing tools include Wireshark, SolarWinds Network Performance Monitor, and PRTG Network Monitor. These tools provide deep packet inspection, network flow analysis, and diagnostic capabilities. They are often used in conjunction with application tracing tools like Jaeger or Last9 to provide full-stack observability.
How do tracing tools help in debugging microservices architecture?
Tracing tools like Jaeger, Last9, and OpenTelemetry help DevOps teams debug microservices-based architectures by providing end-to-end request visibility. They identify latency, errors, and dependencies, making it easier to troubleshoot performance issues. By connecting traces with logs and metrics, they offer a holistic approach to troubleshooting and performance optimization.
Which tracing tools are compatible with microservices architecture?
For microservices-based environments, tools like Jaeger, Zipkin, and Last9 are ideal. They offer lightweight agents, dependency visualization, and easy integration with OpenTelemetry. Grafana Tempo also supports microservices and is cost-effective for large-scale deployments, while Splunk offers enterprise-grade analytics.

