

When something breaks in production, logs are usually where you start. They help you figure out what happened, where, and why. But with microservices architecture, logging isn’t simple anymore.
In a traditional monolithic application, logs live in one place. With microservices, they’re scattered across multiple services, containers, and sometimes even data centers. What used to be a simple grep command now feels like solving a mystery without most of the clues.
You’re dealing with:
- Volume challenges - Hundreds of services generating thousands of logs
- Context switching - Tracking requests across multiple service boundaries
- Correlation complexity - Figuring out which logs matter for a specific issue
This guide walks through eleven logging tools DevOps teams are using in 2025, with their strengths, best for, and pricing details.
What Makes a Good Logging Tool for Microservices?
In a microservices setup, logs aren’t just for postmortems—they’re essential for understanding system behavior in real time. But as systems grow, so does the complexity of logging.
Here’s what to look for in a logging tool that can keep up:
- Centralized collection
Logs from all services, environments, and containers should land in one place. Fragmented logging wastes time during incidents. - Search that works under pressure
Filter by timestamp, service, user ID, or error code—without memorizing a custom query language. - Correlation ID support
Track a request as it moves across services. Essential for debugging distributed flows. - Structured formats (e.g., JSON)
Makes logs easier to parse, filter, and route. Also improves automation for alerting and storage. - Basic visualizations
Trend lines, error spikes, and volume charts help spot issues before users do—even without deep dashboards. - Real-time ingestion
Delays in log delivery slow down incident response. In microservices, seconds matter. - Volume and cost controls
Tools should help manage noisy logs—drop what’s irrelevant, archive cold data, and route smartly. - Scales with your system
Adding services shouldn’t require a full re-architecture of your logging pipeline. - Security and compliance
Built-in encryption, access controls, and support for redaction are table stakes—not add-ons.
The Top 11 Microservices Logging Tools of 2025
Last9 – High cardinality observability at scale
We built Last9 for teams running distributed systems at scale, where logging isn’t just about collecting data, but understanding what’s going wrong, when, and why. Our platform brings together logs, metrics, and traces in one place, built to handle the volume and complexity of modern applications.
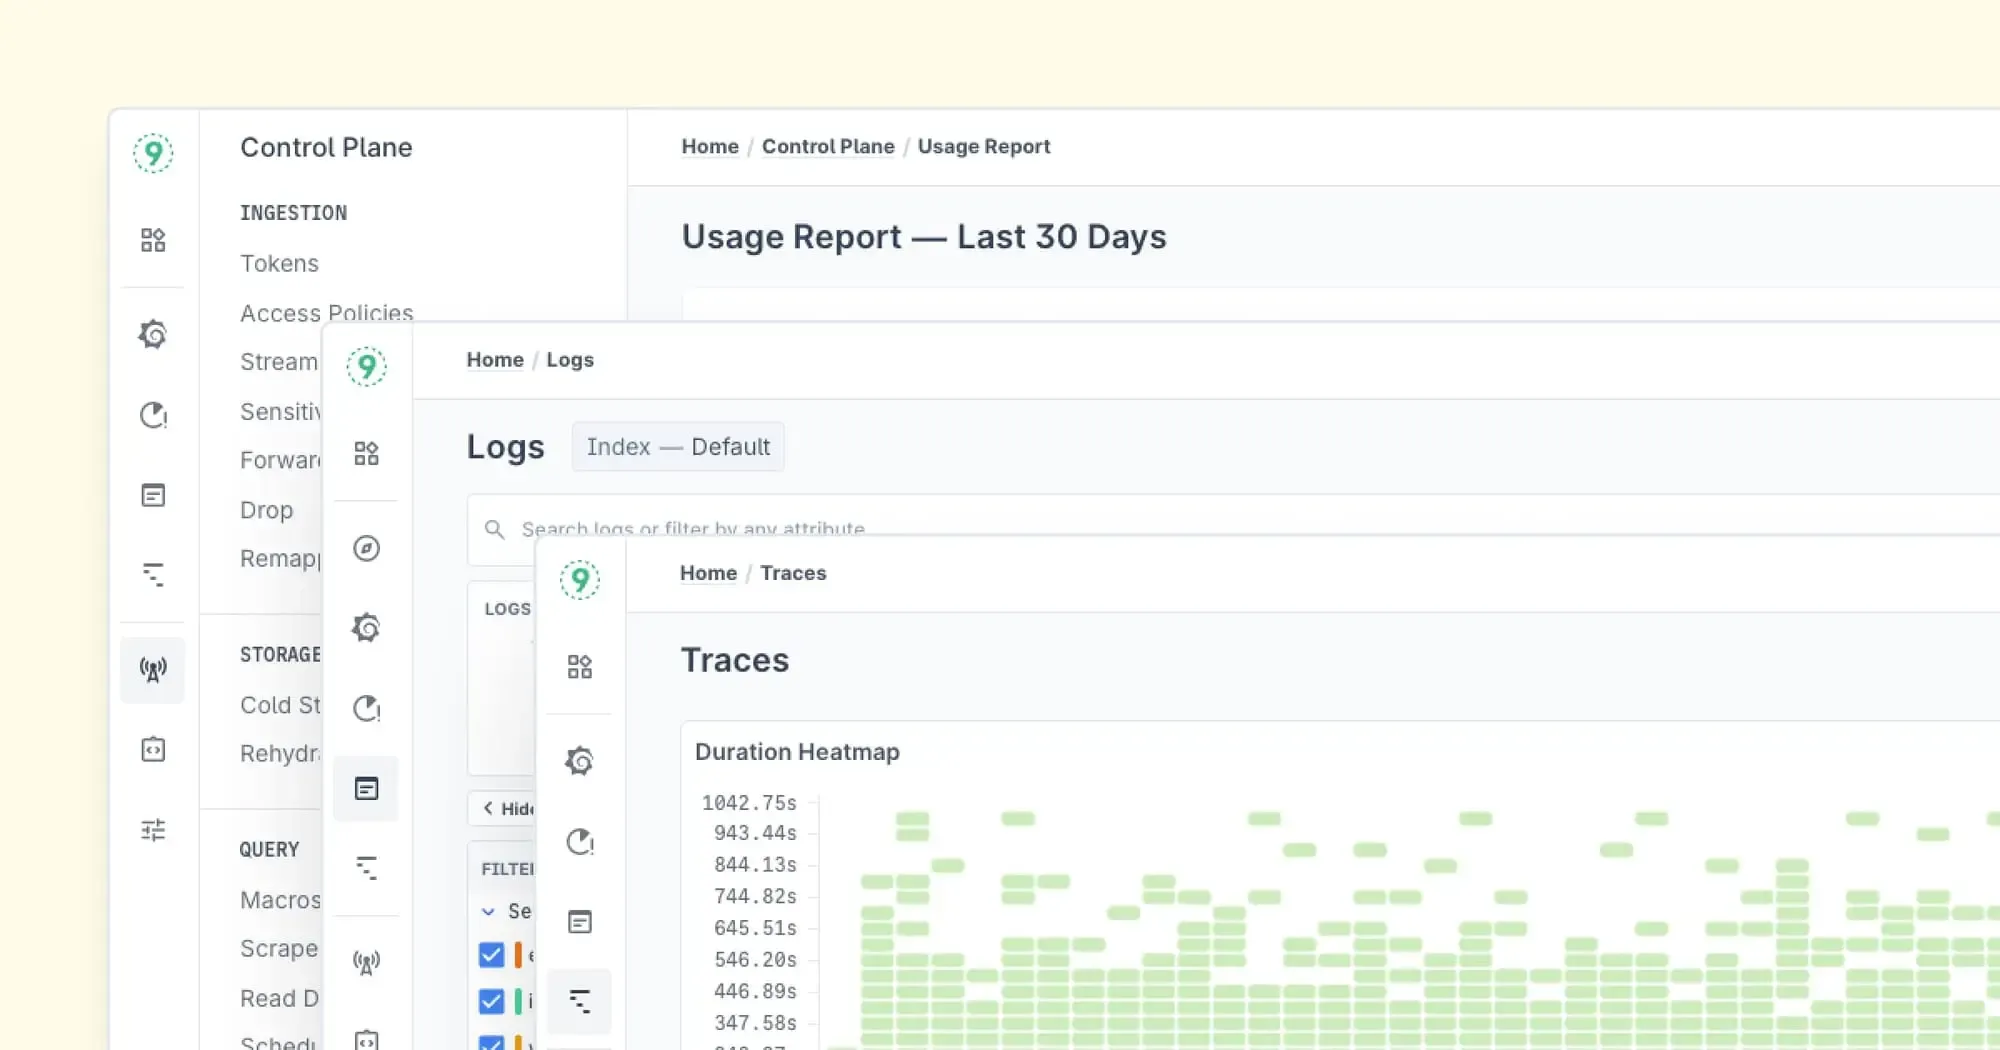
What we offer:
- First-class support for OpenTelemetry and Prometheus
No adapters or workarounds—just plug into your existing observability stack. - Handles high-cardinality logs without slowdowns
Whether you’re tracking user sessions, customer IDs, or dynamic labels, we make sure queries stay fast and storage costs stay predictable. - Log and metric correlation built in
Switch between logs and metrics without jumping across tools. See the full context of a request in real time. - Proven stability at scale
Used in production by teams at Replit, CleverTap, and Probo—even during high-traffic live events and unpredictable spikes. - MCP: Fix issues faster, right from your IDE
Last9 MCP, brings real-time production context—logs, metrics, traces—into your local environment. See what failed, where, and why. Then debug and fix code faster, with AI-assisted context from production. - Straightforward pricing
Everything—logs, metrics, traces—is treated as an event. You’re billed based on the number of events ingested. That’s it.
Who it’s for:
Teams looking for a managed observability solution that’s kinder to your budget, without compromising on performance.
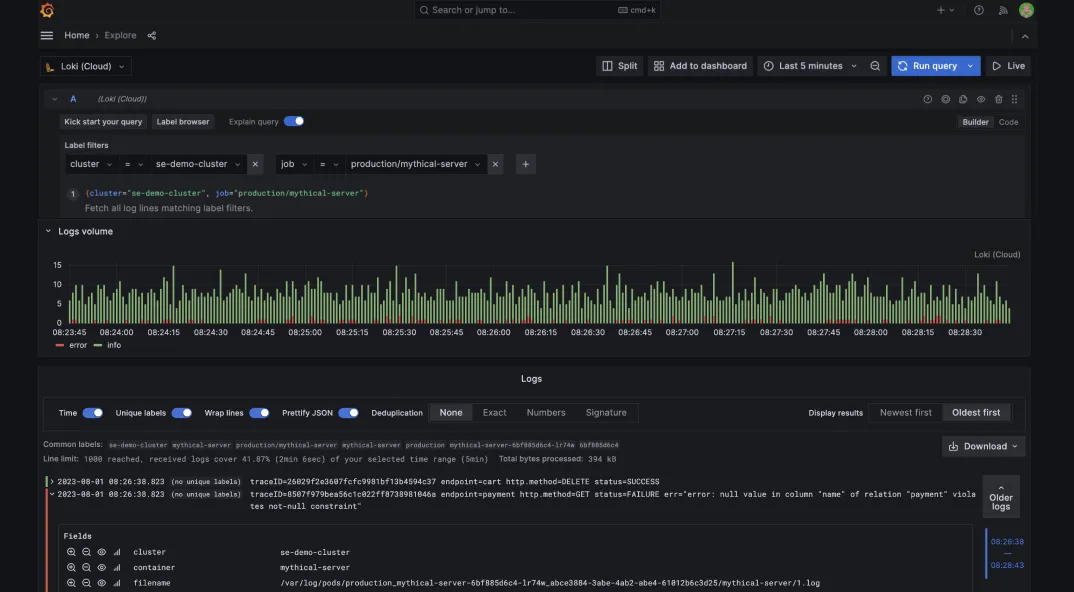
Grafana Loki – Log Aggregation Built for Prometheus Users
Grafana Loki is a log aggregation system designed to feel familiar if you’re already using Prometheus. It shares a similar architecture and uses LogQL—a Prometheus-like query language—so teams can bring logs into Grafana without a steep learning curve.
What it offers:
- Lightweight and efficient
Loki avoids indexing full log content, making it more resource-friendly and cost-effective than traditional log tools. - LogQL for querying
Query logs using syntax similar to PromQL, which keeps the learning curve low for Prometheus users. - Tight Grafana integration
Logs and metrics can be viewed side-by-side in the same dashboard, supporting faster root cause analysis. - Scales horizontally
Built to handle large volumes of log data across distributed environments. - Great fit for Prometheus-based setups
Works well as part of the Grafana + Prometheus observability stack.
Who it’s for:
Teams already invested in Prometheus and Grafana, who want a logging solution that fits into their existing workflow without needing to learn new tools or query formats.
Pricing model:
Free and open-source, with hosted and enterprise versions available through Grafana Cloud.
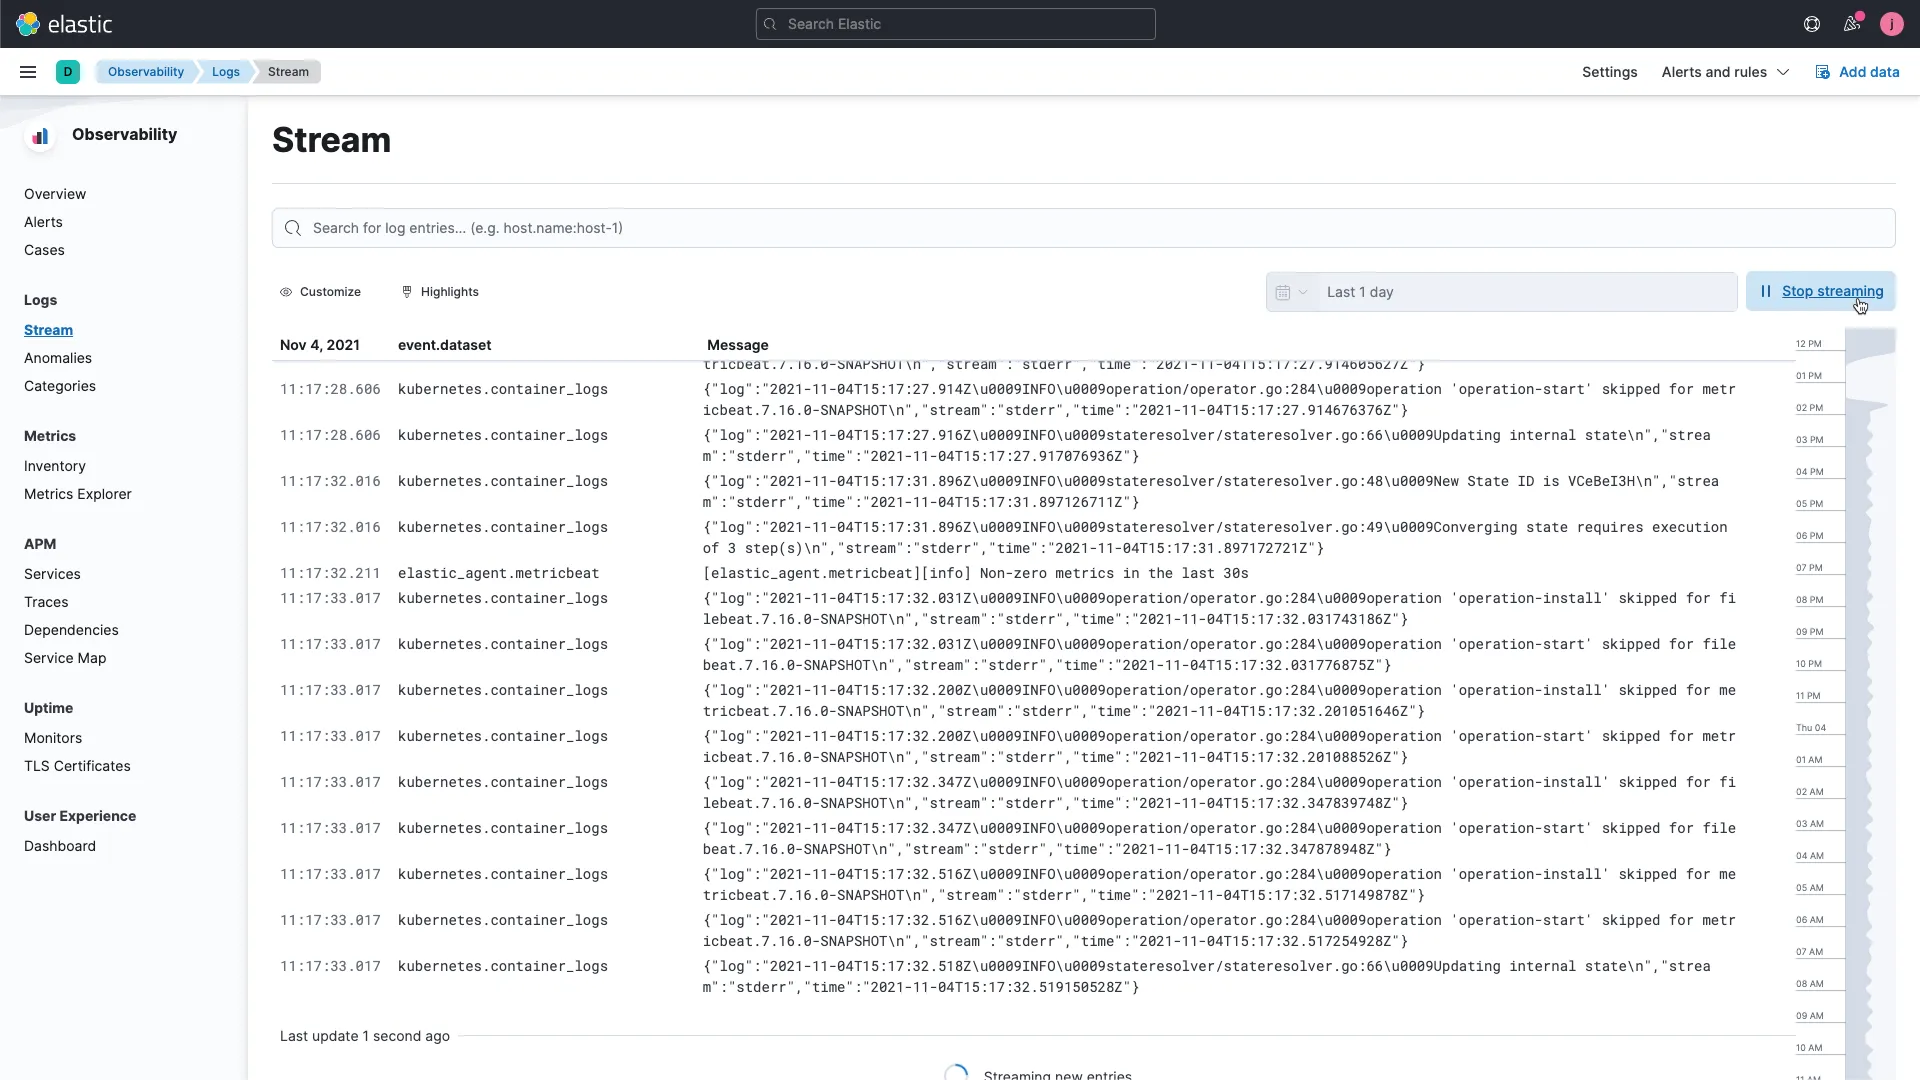
ELK Stack – Open-Source Logging with Full Control
The ELK Stack—Elasticsearch, Logstash, and Kibana—remains a popular choice for teams that want a powerful, flexible logging setup they can shape to fit their needs. It’s open-source at its core, with commercial options available if you need support or managed hosting.
What it offers:
- Strong community and ecosystem
With wide adoption, there’s no shortage of documentation, plugins, and community support. - Customizable dashboards with Kibana
Visualizations can be built from the ground up, tailored to your workflows and environments. - Advanced search and filtering
Elasticsearch supports complex queries, full-text search, and log correlation at scale. - Open-source flexibility
You can self-host, customize ingest pipelines, and control how data is stored and visualized. - Optional paid support or managed services
Elastic (the company behind ELK) offers hosted versions and premium features if needed.
Who it’s for:
Engineering teams with the time and expertise to manage their observability stack. If you want fine-grained control over everything—from log parsing to dashboards—ELK is still a strong option.
Pricing model:
Free and open-source with paid tiers for managed services or advanced features.
BetterStack – SQL-Compatible Log Management
BetterStack takes a familiar approach to logs: you query them like a database. If you’re used to writing SQL, you’ll feel right at home. Under the hood, they use ClickHouse to power fast searches—even at large scale. It’s a solid option if you want a flexible, low-overhead way to explore logs and build alerts.
What they offer:
- SQL-based log queries
Logs are structured and queryable with standard SQL, making it easier to work with complex data and join across fields. - Collaboration-friendly interface
Multiple team members can work together on queries, dashboards, and alerts—similar to how you’d collaborate in Google Docs. - Built-in anomaly detection
Automatically alerts you when logs deviate from expected patterns. - Simple, clean UI
Easy to navigate, especially if you’re just getting started with log analysis. - Out-of-the-box integrations
Supports common tools like AWS, Docker, Kubernetes, and more, so setup is quick.
Who it’s for:
Teams that want flexible log querying and collaboration without the overhead of setting up their pipeline. Their free tier and pay-as-you-go pricing also make it a practical choice for side projects or smaller teams.
Pricing model:
Free tier available, with usage-based pricing as your volume grows.
Papertrail – Lightweight, Reliable Logging
Papertrail offers a clean and efficient way to collect and search logs, with a setup process that’s fast and straightforward. It’s especially useful for teams that want reliable logging without needing to manage infrastructure or navigate complex UIs.
What they offer:
- Fast setup
Send logs using syslog, HTTP, or standard agents. It takes just a few steps to get going. - Minimal, familiar interface
The log viewer has a terminal-like feel that’s easy to navigate and efficient for quick checks. - Cron job monitoring
Useful for keeping an eye on scheduled tasks and background jobs. - Anomaly detection
Flag unusual behavior or unexpected patterns in your logs. - Broad language and platform support
Works across various environments, including older systems and containers.
Who it’s for:
Teams looking for a dependable, low-maintenance logging tool. Papertrail is a solid choice for smaller setups or projects where simplicity and speed are the priority.
Pricing model:
Tiered by volume, with plans starting at $7/month.
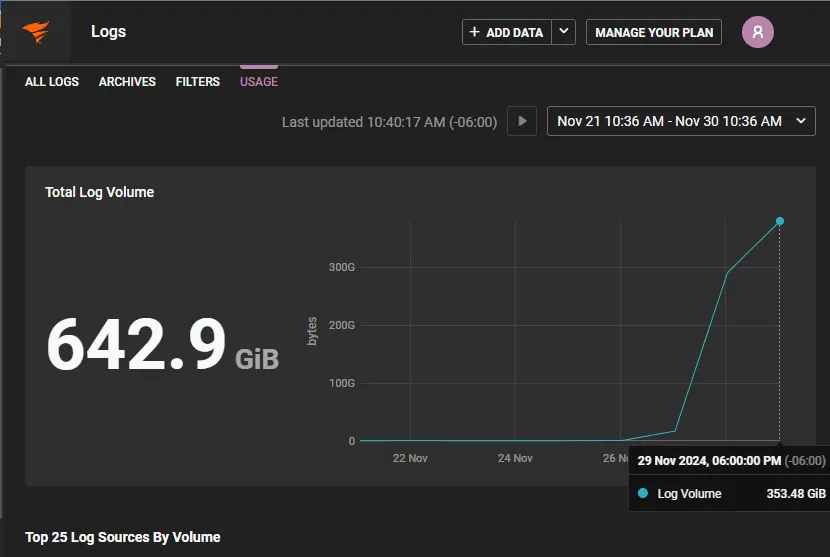
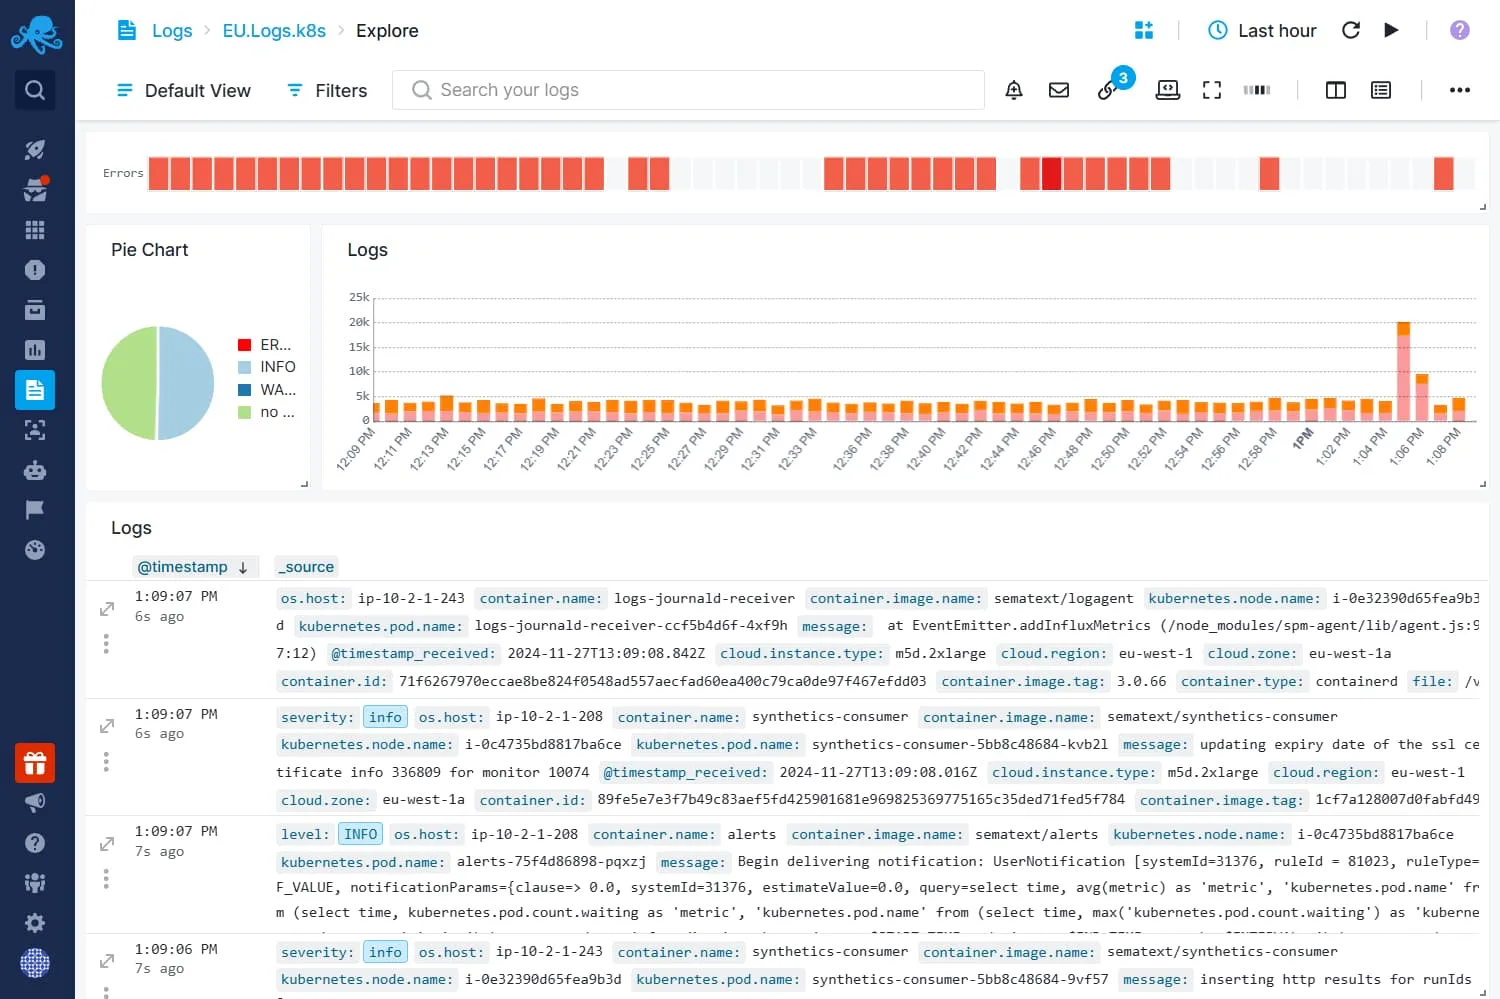
Sematext Logs – Logs and Infrastructure Monitoring in One Platform
Sematext offers a full-stack observability platform that brings log management and infrastructure monitoring under one roof. It builds on the ELK stack model (Elasticsearch, Logstash, Kibana), with a managed setup and additional integrations baked in.
What they offer:
- Real-time alerting for logs and metrics
Set up alerts on both infrastructure metrics and log patterns, with flexible thresholds and conditions. - Integration with popular incident tools
Works with Slack, email, PagerDuty, and more for routing alerts to the right place. - Secure by default
Logs are encrypted in transit over HTTPS/TLS, which helps with compliance and data protection. - Combined monitoring and logging
View logs, metrics, and infrastructure health from a single dashboard—no need to toggle between systems. - Pre-built dashboards
Ready-to-use visualizations for common environments and frameworks, so you don’t start from scratch.
Who it’s for:
DevOps teams looking for a unified monitoring and logging tool without managing ELK themselves. It’s useful when you want both logs and metrics in one system with minimal configuration.
Pricing model:
Tiered, starting at $5/month, depending on log volume and retention.
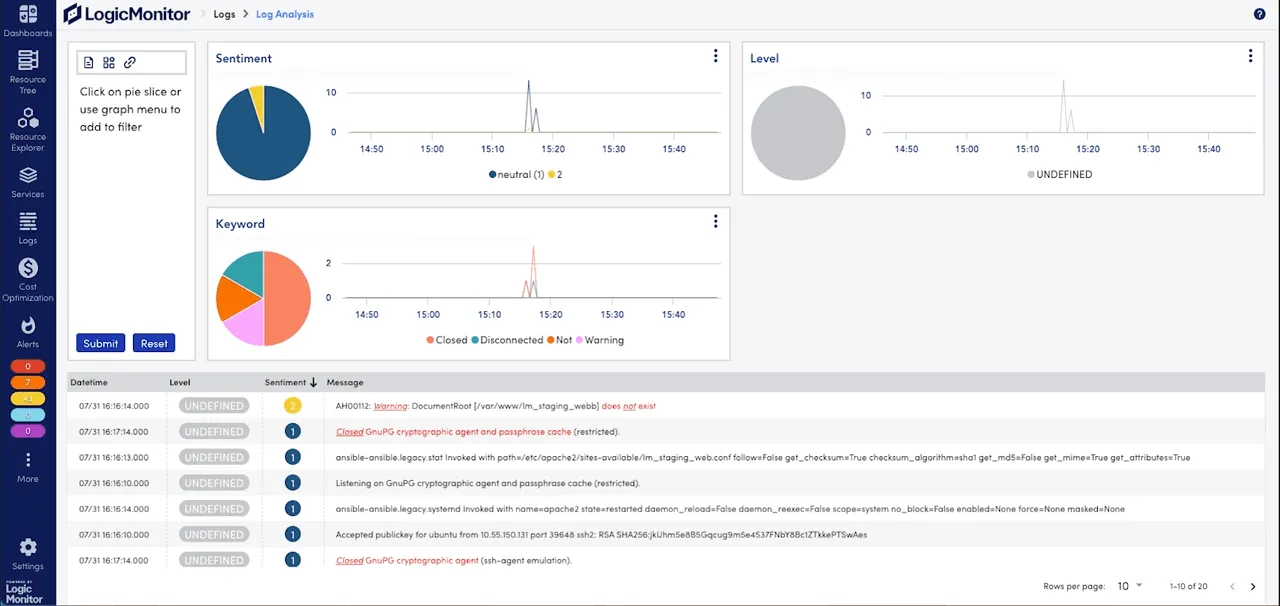
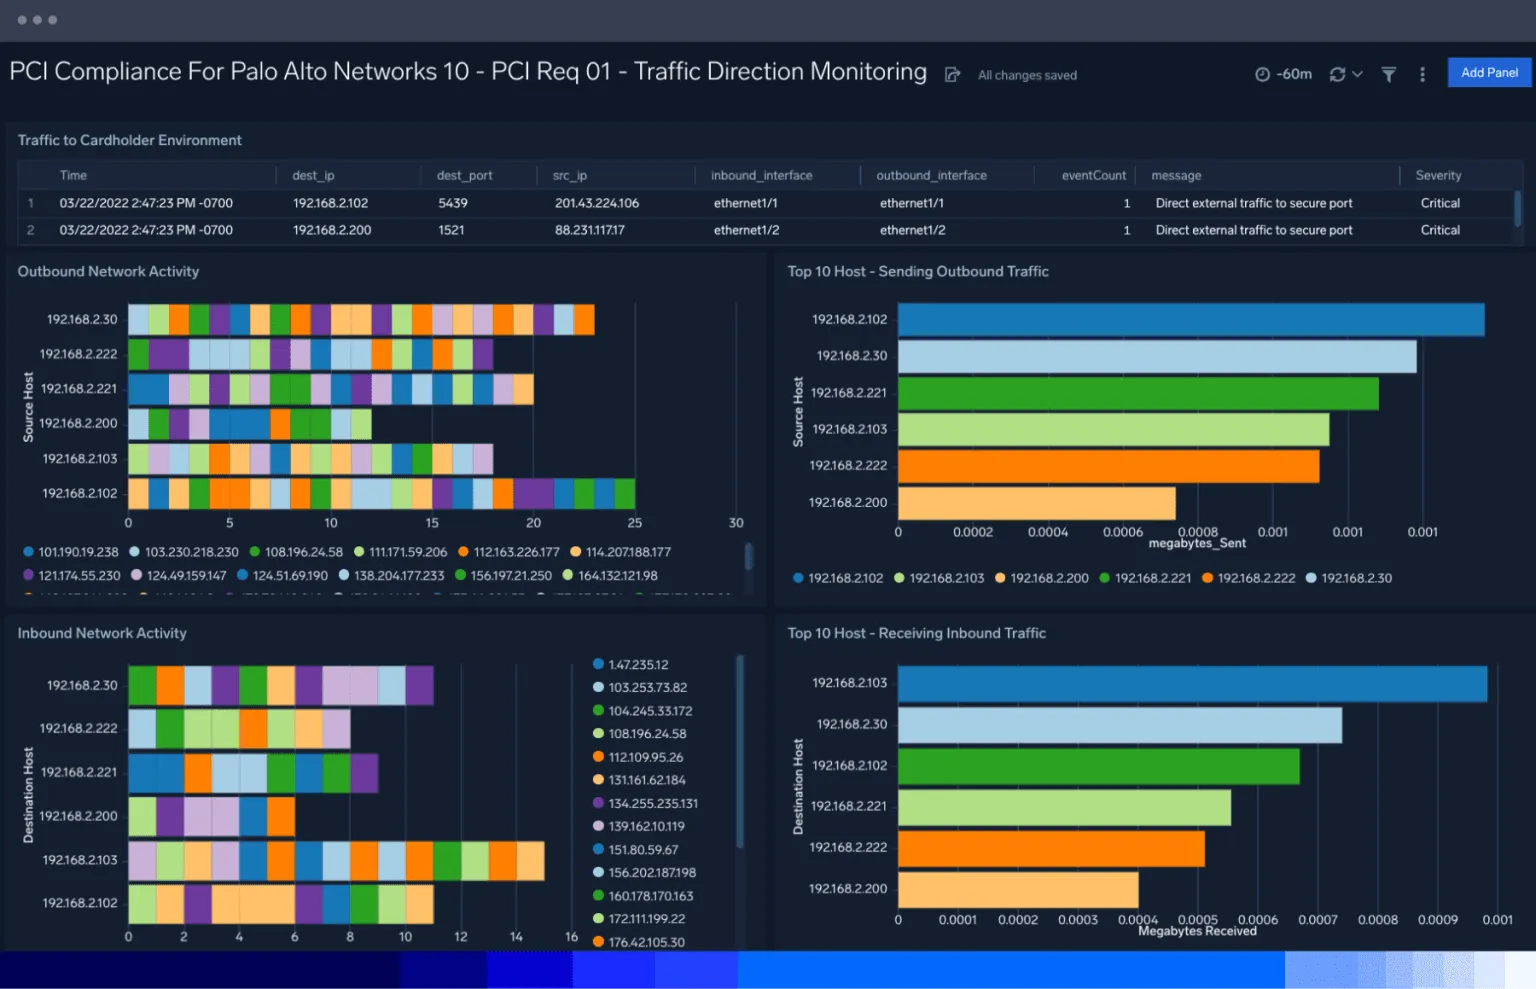
LogicMonitor – Full-Stack Monitoring for IT Operations
LogicMonitor is designed for teams that need broad visibility across infrastructure, applications, and services. It combines logs, metrics, and alerting with automation and long-term data retention, making it well-suited for IT operations at scale.
What they offer:
- Extensive integration support
Prebuilt templates and out-of-the-box integrations for over 2,000 technologies—from cloud providers to on-prem systems. - Flexible querying options
Interfaces for both beginners and advanced users, depending on how deep you need to go. - Access to historical data
Raw logs and metrics can be retained and accessed for up to 12 months, useful for trend analysis and compliance. - Built-in machine learning features
Helps surface anomalies and reduce noise during incident triage. - Covers the full IT operations lifecycle
Monitoring, alerting, troubleshooting, and reporting—all under one roof.
Who it’s for:
Teams that manage large, mixed environments and need a single platform to monitor infrastructure, applications, and services, especially when long-term retention and automation are priorities.
Pricing model:
Feature-based, with plans tailored to the scope of monitoring and retention required.
Sumo Logic – SaaS-First Log Management
Sumo Logic is a cloud-native log management platform that emphasizes scalability, continuous intelligence, and enterprise-readiness. It’s often used by larger teams that want fully managed infrastructure with built-in dashboards, analytics, and security tooling.
What it offers:
- Fully managed SaaS platform
No infrastructure to maintain—log collection, storage, and scaling are handled for you. - Powerful search and query tools
Use their query language to dig deep into structured and unstructured log data. - Out-of-the-box integrations
Connects easily to AWS, GCP, Kubernetes, and CI/CD tools. - Security and compliance features
Built-in support for SIEM use cases, role-based access, and audit trails. - Real-time analytics and alerting
Supports dashboards, anomaly detection, and predictive alerting.
Who it’s for:
Organizations looking for a mature, scalable observability platform with built-in compliance and security support.
Pricing model:
Tiered by data volume and features, enterprise-focused plans are available.
Timber.io (now Vector/Datadog integrations) – Developer-Centric Structured Logging
Timber originally focused on making structured logging easier for developers—now its ideas live on through projects like Vector (from the same team, now part of Datadog) and Datadog’s logging suite.

What it offers (Vector/Datadog):
- Structured logs by default
Emphasizes clean, structured logs to support querying, filtering, and visualization. - Lightweight, performant agent
Vector is designed to run with minimal overhead, making it ideal for edge environments or containers. - Supports multiple outputs
You can route logs to Datadog, S3, Elasticsearch, and other backends. - Developer-first tooling
Built with flexibility and transparency in mind, especially for custom pipelines.
Who it’s for:
Teams that want full control over log ingestion and routing, or are already working within the Datadog ecosystem.
Pricing model:
Vector is open-source. Datadog Logging follows a pay-per-ingested-event model.
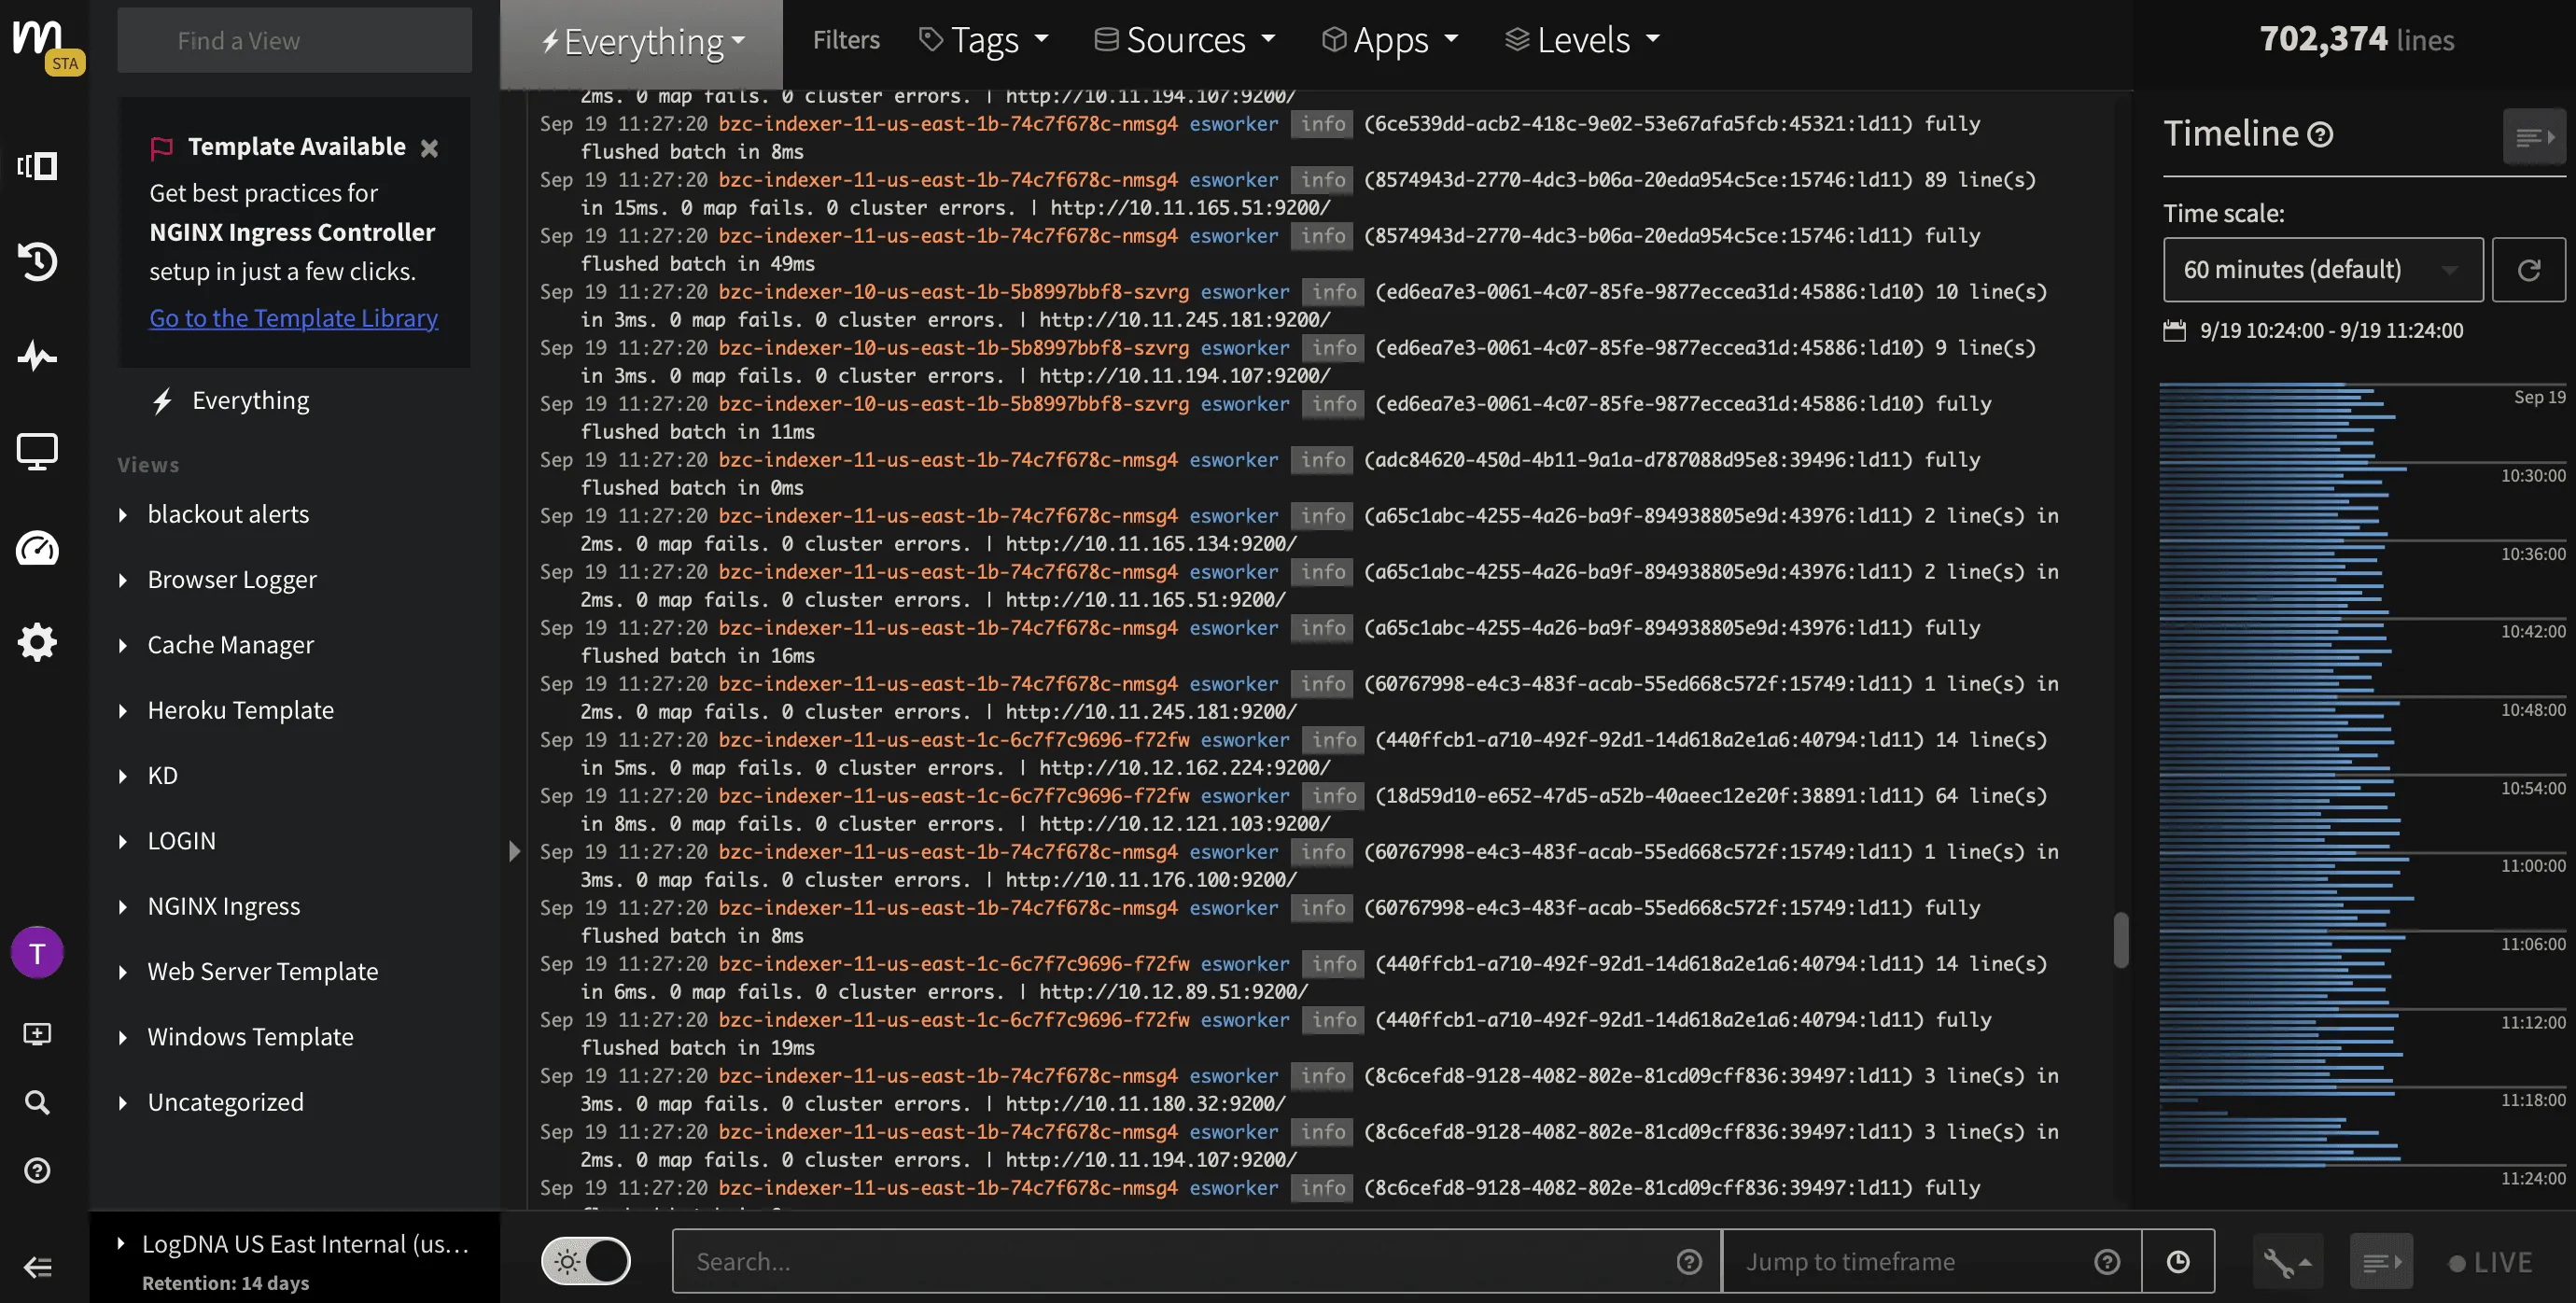
Mezmo – Developer-Friendly Log Management with Flexible Pipelines
Mezmo (formerly LogDNA) is built for teams that want fast, structured access to logs with minimal setup and strong support for custom data workflows. It’s designed to work well across Kubernetes, multi-cloud environments, and modern CI/CD pipelines.
What it offers:
- Fast, structured log ingestion
Ingest logs from multiple sources with minimal latency and built-in parsing for structured formats like JSON. - Live tail and instant search
View logs in real time with support for quick filtering, search history, and saved views. - Pipeline control and routing
Enrich, filter, or route log data to different destinations before it hits your backend. - Kubernetes-native support
Automatically captures pod, namespace, and container metadata to simplify debugging. - Security and compliance features
Built-in support for redaction, RBAC, and audit logging.
Who it’s for:
Engineering teams looking for a fast, developer-first logging tool that can adapt to both simple and complex use cases—especially in Kubernetes or multi-cloud setups.
Pricing model:
Free trial available; usage-based plans with volume and retention controls.
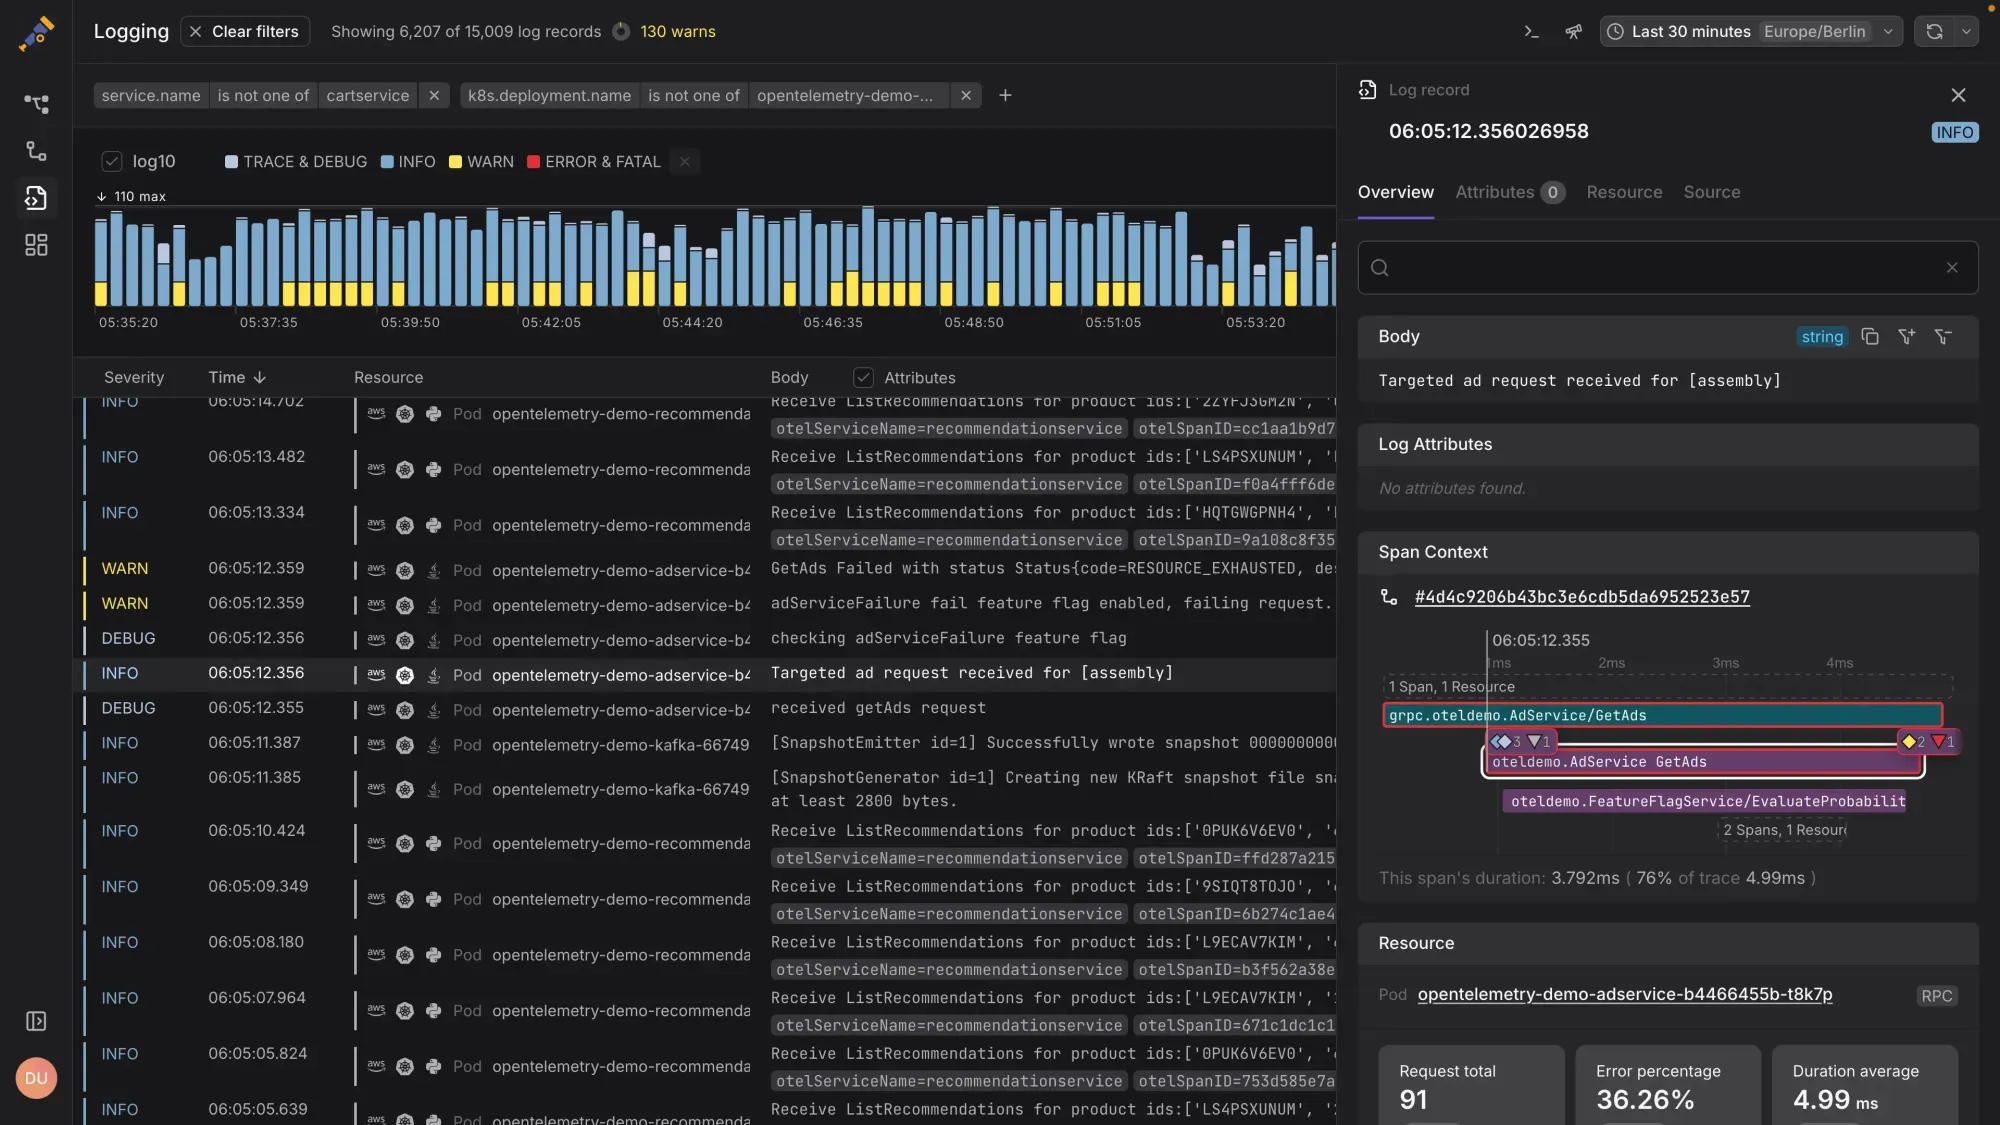
Dash0 – Log Routing and Control for Modern Pipelines
Dash0 focuses on giving teams control over how logs move through their systems. Instead of just collecting and storing everything, it helps you decide what to keep, drop, redact, or transform before it even reaches your backend.
What it offers:
- Log shaping at ingest
Filter, rewrite, or drop logs on the fly using declarative rules. Reduce volume without losing signal. - Built for high-cardinality and noisy data
Helps manage verbose logs from Kubernetes, cloud-native apps, and multi-tenant systems. - Flexible output routing
Route logs to different destinations—S3, ClickHouse, Elasticsearch, or any third-party backend. - Pipelines as code
Configuration lives in Git, making it versioned, reviewable, and CI/CD-friendly. - Lightweight and platform-agnostic
Works as an agent or sidecar, with low overhead and broad compatibility.
Who it’s for:
Teams that already have a preferred backend but want more control over what gets there. Especially useful if you’re dealing with log noise, cardinality problems, or spiraling costs from raw ingestion.
Pricing model:
Usage-based, typically tied to volume processed and features used.
A Quick Comparison of Microservices Logging Tools at a Glance
| Tool | Best For | UI & Dashboards | Correlation Support | Pricing Model |
|---|---|---|---|---|
| Last9 | Teams needing high-cardinality support across logs, metrics, and traces—with real-time correlation between them | Built-in with unified logs/metrics/traces | Yes – logs ↔ metrics/traces | Usage-based (per ingested event) |
| BetterStack | Teams that prefer SQL querying and easy collaboration | Clean, modern UI with saved views | Partial – metric integrations | Free tier + pay-as-you-go |
| Papertrail | Small teams wanting fast, simple log access | Terminal-like event viewer | Limited | Tiered (starts at $7/month) |
| Sematext | DevOps teams needing both log and infrastructure monitoring | Pre-configured dashboards | Yes – logs and metrics | Tiered (starts at $5/month) |
| ELK Stack | Teams wanting full control over self-managed logging | Fully customizable with Kibana | Yes – with manual setup | Open-source + paid Elastic offerings |
| LogicMonitor | Enterprises needing broad IT operations coverage | Full-stack dashboards | Yes – across IT layers | Feature-based (custom plans) |
| Grafana Loki | Teams already using Prometheus and Grafana | Native Grafana integration | Yes – via Grafana panels | Open-source + Grafana Cloud tiers |
| Dash0 | Teams needing control over log routing and shaping | CLI + dashboard (pipeline-focused) | N/A – focuses on ingestion control | Usage-based (by processed volume) |
| Sumo Logic | Enterprises wanting a SaaS-first, scalable observability tool | Built-in analytics and dashboards | Yes – integrated | Tiered, volume-based |
| Vector (Timber) | Developers needing fast log shipping and flexible pipelines | Minimal UI; routes to other backends | No direct UI, pipeline-focused | Open-source (Vector) + Datadog pricing |
| Logtail | Teams that want modern, fast log querying with a SQL-first approach | Fast browser-based viewer | Partial | Free tier + usage-based plans |
Conclusion
We’ve covered a range of tools that can help you get started with logging in a way that fits your architecture, team, and debugging workflow. Depending on what you’re optimizing for—simplicity, scale, or control—there’s something here to suit most environments.
If Last9 sounds like something you’d like to explore—especially for high-cardinality systems with logs, metrics, and traces all in one place—talk to us.

