Hopefully, you’ve caught our updates from Day 1 at SRECon. If you missed it, you can still check out the highlights here.
Now, let’s jump into what stood out on Day 2 of SRECon 2024!
Highlights from Day 2:
Here's a quick recap of the sessions that sparked conversations on Day 2:
Treat Your Code as a Crime Scene
The session started with a quick and engaging look at offender profiling, and then we explored how those ideas can be applied to software development. We got an idea of how version-control data, which is often just sitting there, can reveal interesting behaviors and patterns within a development team.
Finding the Capacity to Grieve Once More
Alexandros shared some fascinating stories from Wikipedia's experience with unexpected traffic spikes, particularly during significant events like notable deaths, which can sometimes cause serious outages.
He talked about how they thought they had tackled these challenges, only to face a major outage in 2020 caused by a tragic loss and a DDoS attack.
Anomaly Detection in Time Series from Scratch Using Statistical Analysis
Ivan Shubin shared his insights on tackling the tricky world of anomaly detection in time series data.
He made a compelling case that you don't need AI or machine learning to get good results.
He showcased how basic statistical methods can do the job effectively.
SRE in Small Orgs
During this session, Emil and Joan invited everyone to join a casual conversation about the ins and outs of running SRE teams in smaller organizations. It was all about connecting with others in similar situations and bouncing around ideas together.
Monitoring and Alerting
Daria and Niall had a laid-back conversation with attendees about monitoring and alerting, followed by a fun Q&A session. It was really interesting to hear how SREs think about monitoring and alerting!
Synthetic Monitoring and E2E Testing: 2 Sides of the Same Coin
Carly delivered an insightful session on the relationship between Synthetic Monitoring and E2E Testing. She addressed the cultural and tooling challenges that keep development and SRE teams in silos, even in a DevOps environment.
How Snowflake Migrated All Alerts and Dashboards to a Prometheus-Based Metrics System in 3 Months
In his talk, Carlos Mendizabal took the audience through Snowflake's journey of migrating all alerts and dashboards to a Prometheus-based metrics system in just three months. He shared the ups and downs of rewriting every single alert and dashboard for system monitoring.
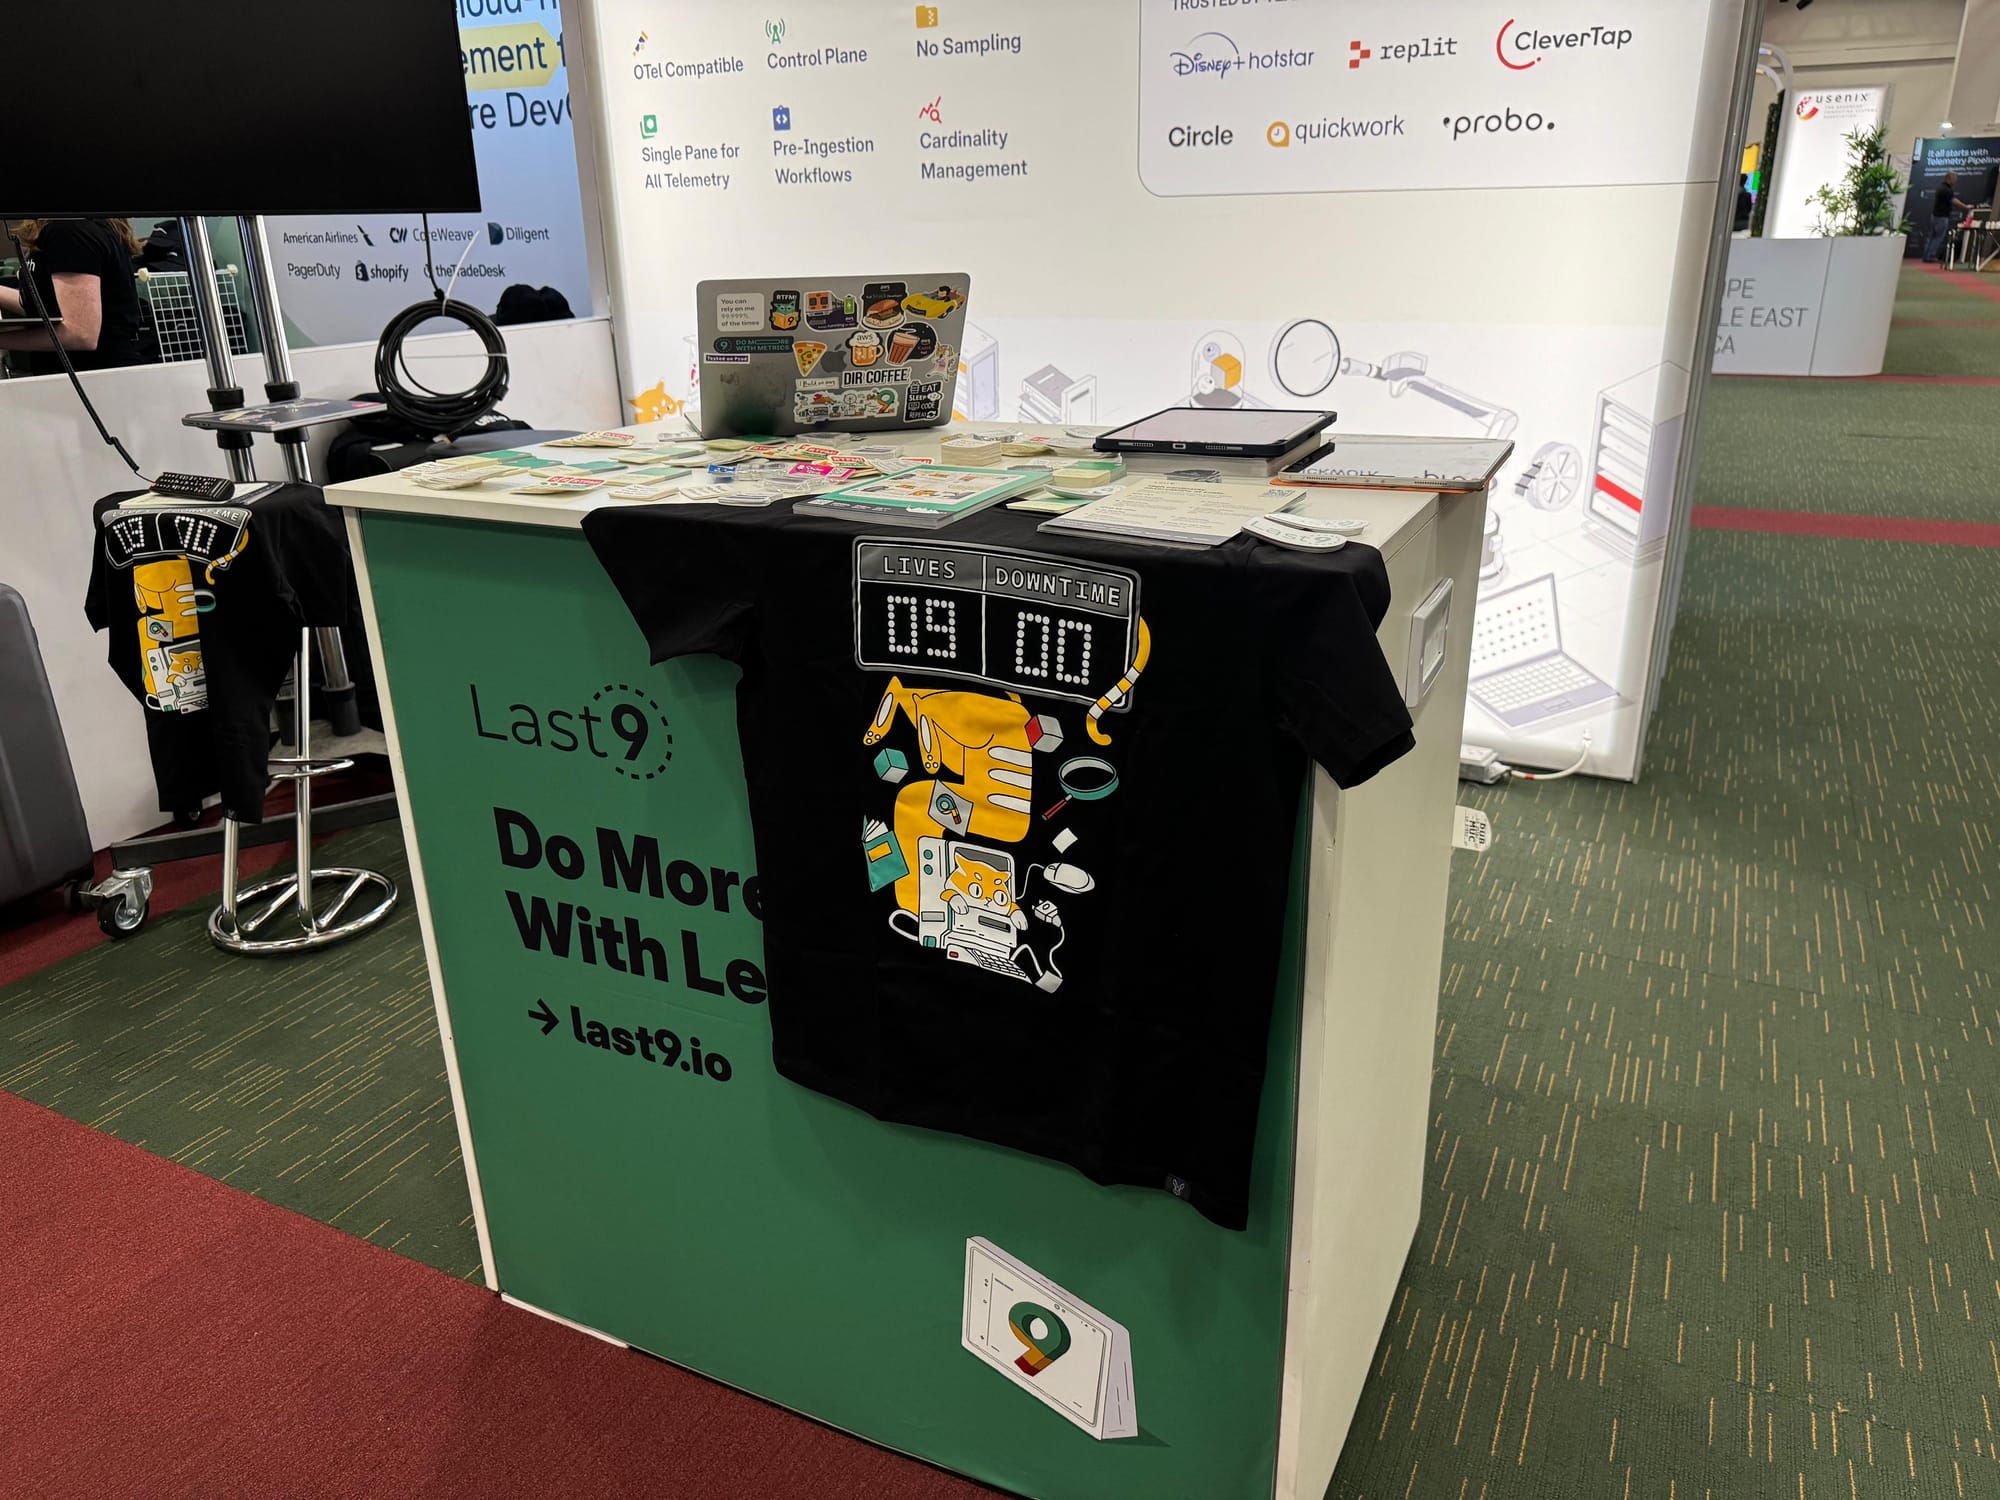
If you missed out on our amazing merch yesterday track us down and grab yours! 😎

I am already looking forward to Day 3 of SRECon Dublin 2024.


